Disclaimer: Information found on CryptoreNews is those of writers quoted. It does not represent the opinions of CryptoreNews on whether to sell, buy or hold any investments. You are advised to conduct your own research before making any investment decisions. Use provided information at your own risk.
CryptoreNews covers fintech, blockchain and Bitcoin bringing you the latest crypto news and analyses on the future of money.
Examining Bitcoin’s supply patterns as increase in long-term holdings indicates investor trust
Tracking the movement of Bitcoin’s supply, especially when segmented by the duration since last activity, is essential for comprehending investor behavior and predicting market trends. This examination illuminates the present condition of Bitcoin holdings and offers vital insights into its prospective movements.
A significant transformation in Bitcoin’s supply dynamics has occurred following its recent price increase. Within a little over a month, Bitcoin’s price rose from $26,846 to $37,964. Concurrently, the proportion of Bitcoin’s supply that last moved over a year ago grew by approximately 4%, suggesting an increased tendency among investors to retain their assets for extended periods.
Graph illustrating the percentage of Bitcoin’s supply that has remained unmoved for over a year in 2023 (Source: Glassnode)
This timeframe also witnessed alterations in shorter-term supply movements: the supply last active for 1-3 months fell from 1.16 million BTC to 895,347 BTC, marking a significant decline of around 22.7%, which reflects a reduction in short-term trading activities.
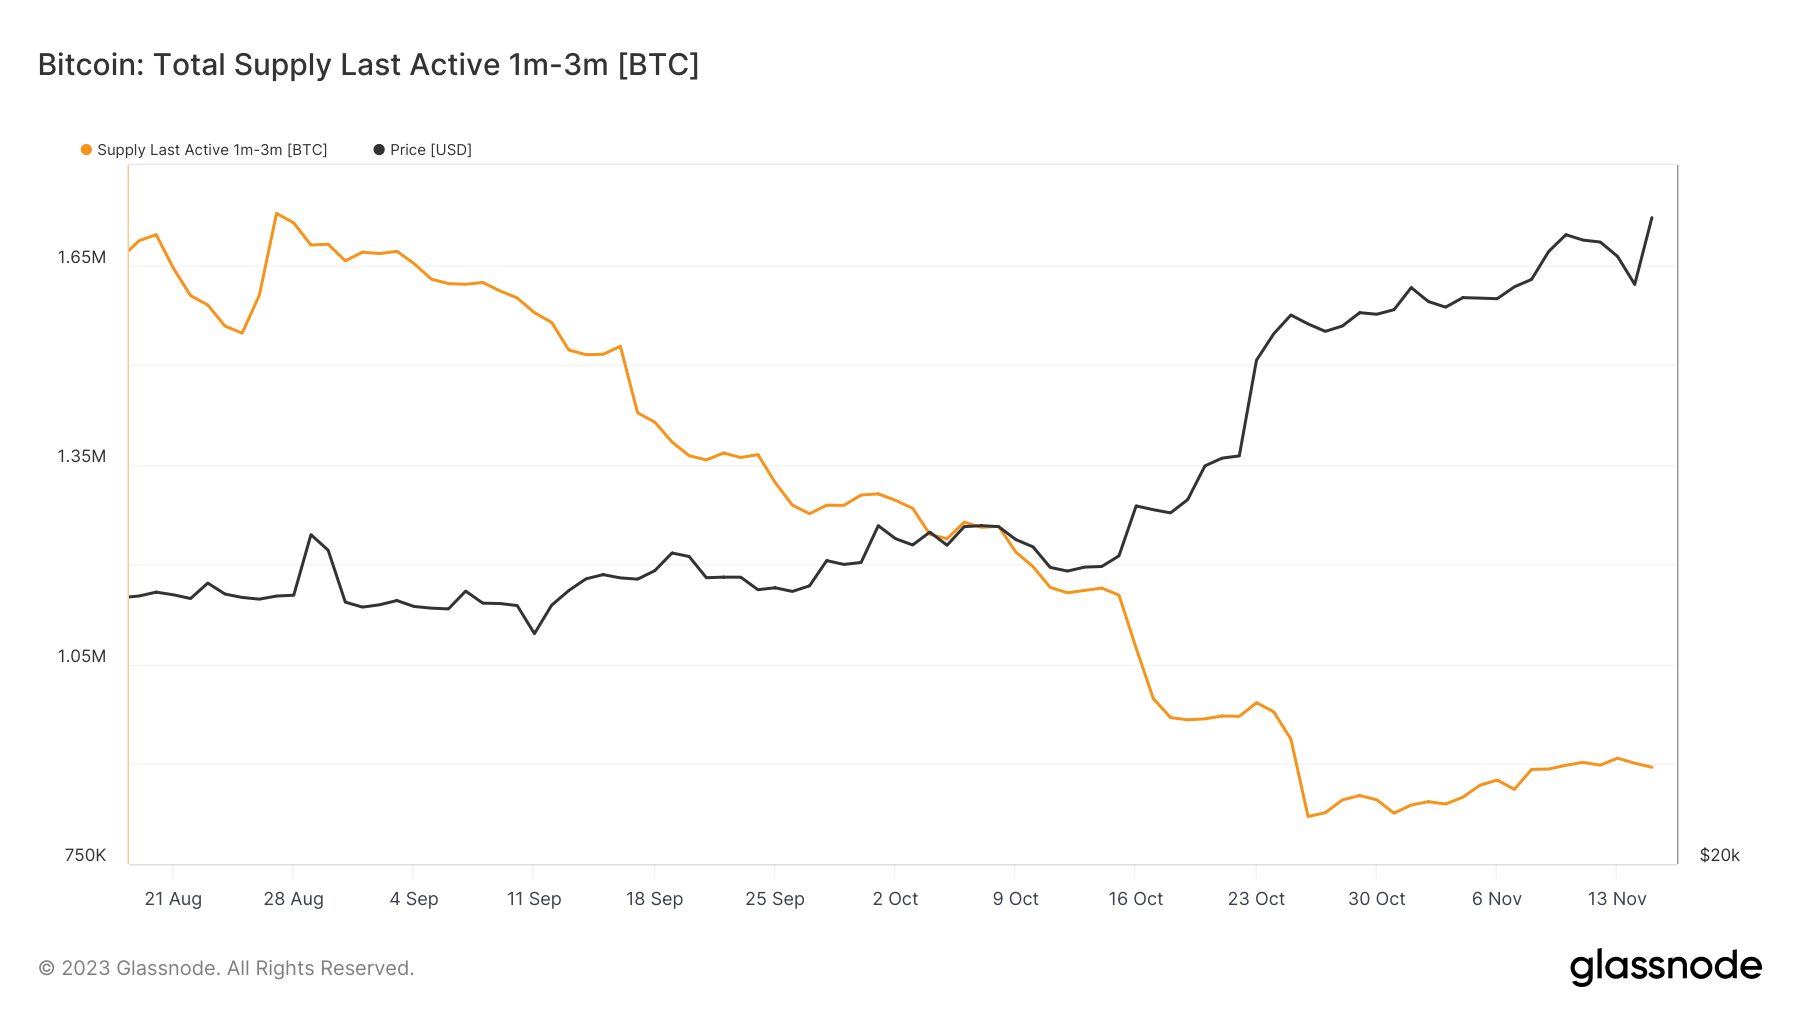 Graph depicting the supply last moved between 1 month and 3 months ago from Aug. 19 to Nov. 15, 2023 (Source: Glassnode)
These patterns suggest a broader sentiment among Bitcoin holders. The rising percentages in the supply last moved categories, particularly those over a year, underscore a strong preference for holding Bitcoin as a long-term investment or a store of value. This behavior indicates a maturing market where investors are less responsive to short-term price changes and more assured in the long-term potential of Bitcoin.
Related Posts
The supply last active in the 3-6 and 6-12 months categories also exhibited noteworthy movements. The 3-6 months category experienced an increase followed by a minor decrease, while the 6-12 months category consistently declined.
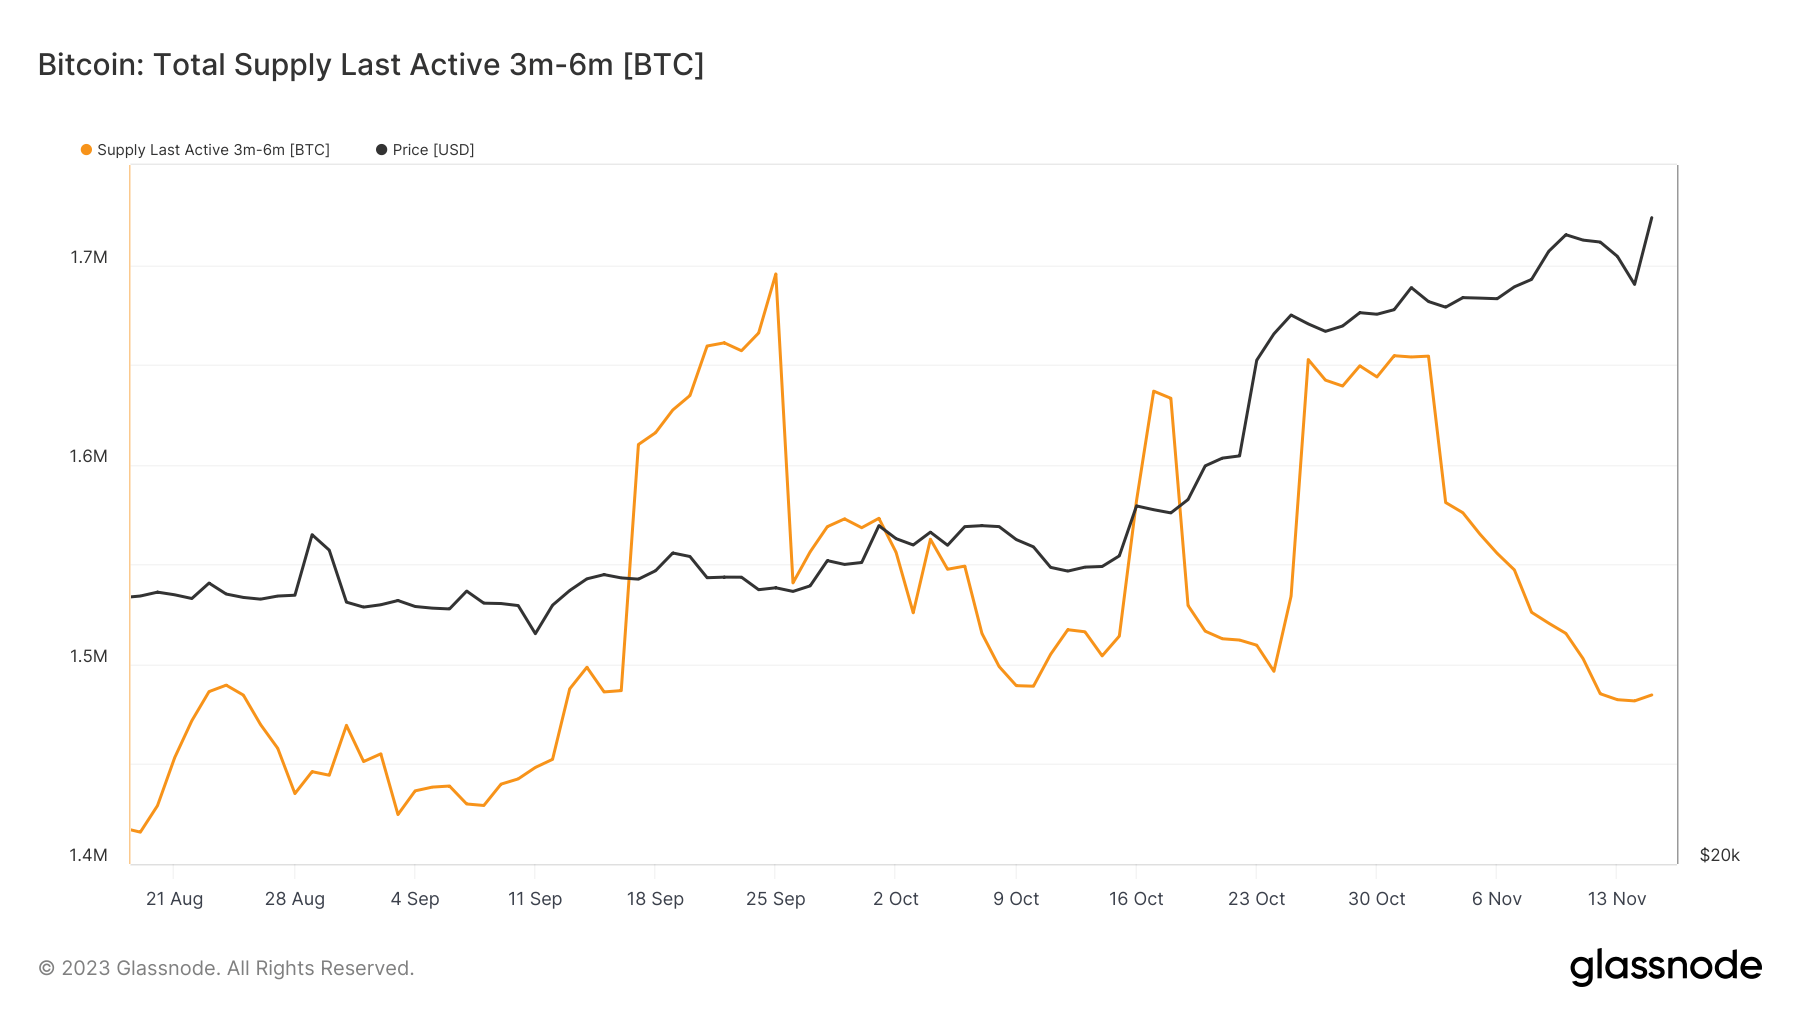 Graph showing the supply last moved between 3 months and 6 months ago from Aug. 19 to Nov. 15, 2023 (Source: Glassnode)
This variation may suggest a transition of Bitcoin from a relatively inactive state (6-12 months) to a more active state (3-6 months), possibly in response to market changes or price fluctuations.
Graph illustrating the supply last moved between 6 months and 12 months ago from Aug. 19 to Nov. 15, 2023 (Source: Glassnode)
These supply dynamics are vital for understanding the liquidity and stability of the Bitcoin market. A considerable amount of Bitcoin being held for long durations results in a reduction of the circulating supply, which can lead to price increases, particularly given Bitcoin’s limited supply. Conversely, low liquidity, characterized by a smaller supply available for trading, can result in heightened price volatility.
The insights derived from this analysis not only reflect current market conditions but also forecast potential future trends. For example, if a significant portion of Bitcoin that has been held for over three years begins to become active, it could indicate possible selling pressure, potentially resulting in a price decline. Additionally, the response of these supply categories to external events can offer valuable insights into how various investor segments perceive and react to these occurrences.
The post Analyzing Bitcoin’s supply trends as surge in long-term Bitcoin holdings points to investor confidence appeared first on CryptoSlate.