Disclaimer: Information found on CryptoreNews is those of writers quoted. It does not represent the opinions of CryptoreNews on whether to sell, buy or hold any investments. You are advised to conduct your own research before making any investment decisions. Use provided information at your own risk.
CryptoreNews covers fintech, blockchain and Bitcoin bringing you the latest crypto news and analyses on the future of money.
Bitcoin rises with oil prices as BTC begins to diverge from war-related trends, but shifts once US markets commence trading.
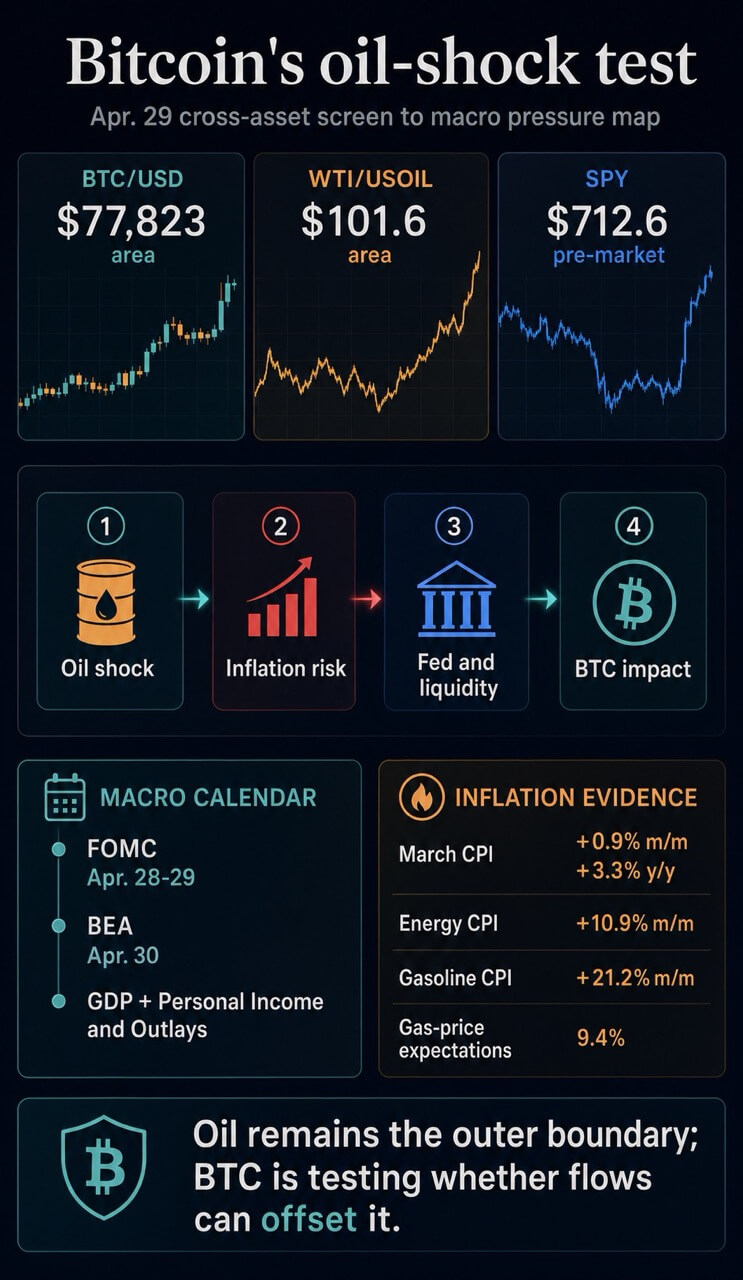
Bitcoin is currently trading around $76,600 after a retreat from an earlier intraday surge towards $78,000, while crude oil is priced near $103 and the S&P 500 declined as the US stock market commenced.
Prior to the US cash session, Bitcoin experienced an increase even as crude oil continued its ascent, indicating that crypto-specific positioning was robust enough to withstand the oil-inflation trade for part of the day.
Following the market open, the focus shifted back to equities. The chart below illustrates Bitcoin’s decline as the S&P 500 decreased, while crude oil remained high.
This creates two conflicting signals: Bitcoin can operate independently of stocks while cash equities are closed, yet US equity risk appetite can still draw it back once the main session begins.
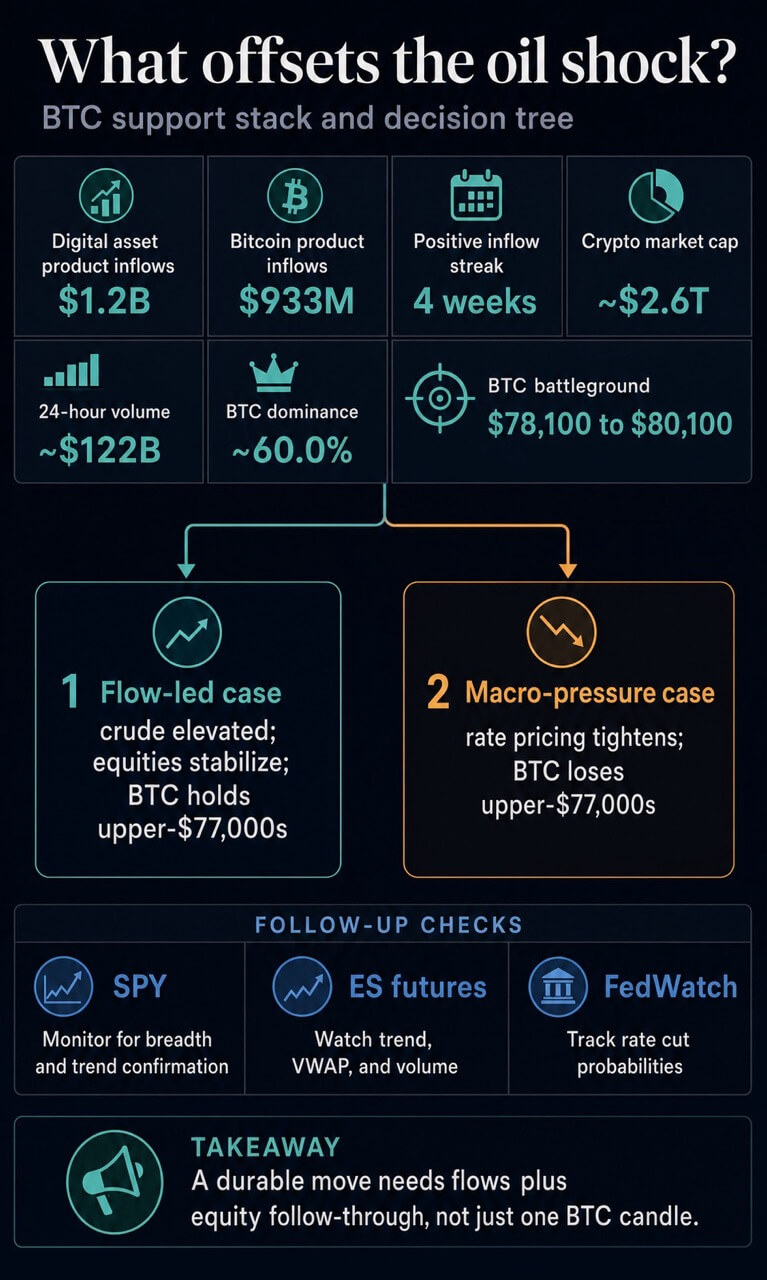
Wider market data indicates approximately $2.6 trillion in crypto market capitalization, around $122 billion in 24-hour trading volume, and Bitcoin dominance close to 60%.
CryptoSlate’s Bitcoin market page reported Bitcoin in the upper-$77,000s earlier today, reflecting an increase of about 1.6% over 24 hours, with a market cap near $1.56 trillion. The latest chart reveals why that intraday strength diminished: the US market open transformed the movement from a straightforward oil-shock divergence into an equity follow-through test.
The open made equities the trigger
The initial phase of the session undermined the straightforward April narrative that rising oil prices automatically lead to lower Bitcoin values. Crude oil advanced through the $100 mark, yet Bitcoin still approached $78,000 before the US cash equities opened.
The subsequent phase reinstated the equity aspect of the trade. Once the S&P 500 dropped at the open, Bitcoin retreated towards the mid-$76,000s even as crude oil continued to rise.
Bitcoin demonstrated its ability to withstand the oil shock for part of a session. However, the same session also illustrated that the equity open can draw the asset back into the broader risk trade.
This aligns with previous coverage from CryptoSlate. On April 23, Bitcoin’s decline below $78,000 appeared more influenced by equity and risk appetite than a direct response to oil, as crude remained relatively stable while the S&P 500 weakened.
 Related Reading
Bitcoin’s loses $78k while the US markets sleeps – risk takes over from oil as crude prices stay flat
Bitcoin’s retreat near $80K reflects a risk-off movement in equities, with oil and Fed expectations continuing to shape the macro environment. Apr 23, 2026 · Liam 'Akiba' Wright
Today’s chart presents a clearer version of that scenario. Oil is increasing, Bitcoin initially resisted the pressure, and the S&P 500 opening then became the event that pulled Bitcoin lower.
Oil still controls the outer boundary
The oil channel has already been integrated into Bitcoin’s April framework. On April 24, Bitcoin remained near $78,000 as oil surpassed $100, testing whether demand for scarce assets could endure a stronger dollar, increased real-yield pressure, and tighter liquidity conditions.
 Related Reading
Bitcoin ends week resilient around $78,000 as Trump’s new rhetoric sent oil price back above $100
Bitcoin has shown unexpected resilience by maintaining a position near $78,000, following a significant derivatives short squeeze. Apr 24, 2026 · Oluwapelumi Adejumo
A separate examination of the global oil shock and the Fed indicated that fuel, freight, and input costs can transition from commodity screens into realized inflation.
This channel can continue to influence rates and liquidity conditions even when Bitcoin experiences a short-term bid.
The official inflation data reinforces that risk. The Bureau of Labor Statistics reported that March CPI increased by 0.9% from February and 3.3% year-over-year.
Related Posts
Energy prices rose by 10.9% for the month, driven by a 21.2% surge in gasoline. The New York Fed’s March survey then indicated year-ahead gas-price expectations at 9.4%, the highest level since March 2022.
Energy-market dynamics introduce another consideration. The Energy Information Administration noted a widening Brent-WTI spread and disrupted navigation through the Strait of Hormuz as part of the global crude-market context. Crude stress can transition from commodity pricing into inflation expectations, which keeps the Fed channel active.
The calendar amplifies that pressure. The Federal Reserve’s schedule places the April 28-29 FOMC meeting directly over this cross-asset movement.
The BEA timeline lists Q1 GDP and March Personal Income and Outlays for April 30. This same late-April period has already been identified as a volatility cluster surrounding options, oil, and the Fed.
The upcoming policy and data releases can still determine whether the oil movement becomes a persistent financial-conditions issue.
Flows are the offset, equities are the confirmation
The counterbalance is demand. CoinShares’ latest weekly report revealed that digital asset investment products attracted $1.2 billion, marking the fourth consecutive positive week.
Bitcoin represented $933 million of that total. CoinShares also noted that the April 28-29 FOMC decision was likely contributing to caution at the margins.
On April 28, fund flows and spot demand were sufficiently strong to rebuild the bid, but the Fed still faced the next significant test.
 Related Reading
Bitcoin’s comeback is now in the Fed’s hands after big investors piled back in
Crypto funds have now recorded three consecutive weeks of inflows exceeding $1 billion, while Glassnode indicates that Bitcoin ETF and spot demand are recovering. Apr 28, 2026 · Gino Matos
This helps clarify the pre-open resilience. Bitcoin can rise even while crude oil remains high when fund demand, positioning, or crypto-specific liquidity is sufficiently strong for a session. The post-open reversal illustrates why that alone is insufficient.
CME’s E-mini S&P 500 futures remain a crucial follow-up indicator for whether the equity aspect supports or undermines the next Bitcoin movement.
| Signal | What supports Bitcoin | What pressures Bitcoin |
|---|---|---|
| Crude and inflation | Demand for scarce assets can re-emerge during policy stress. | Increased fuel costs can elevate inflation expectations, maintain Fed caution, and tighten liquidity. |
| Flows and positioning | CoinShares reported $933 million of Bitcoin product inflows in the latest week. | Flow strength still faces the FOMC and bond-market scrutiny. |
| Equities | S&P 500 and futures follow-through would support a risk-appetite interpretation. | A weaker equity open can draw Bitcoin back into the risk-asset trade. |
The April 22 setup provided a useful threshold for this movement. It indicated that Bitcoin maintaining stability or strengthening around $78,000 while oil remained high would weaken the narrative that rising oil prices automatically lead to lower Bitcoin values.
So far today, Bitcoin met that criterion before the US equity open and then lost momentum once the S&P 500 declined.
A subsequent April 28 bond-market analysis positioned the Bitcoin battleground around the $78,100 to $80,100 range.
Below that range, sellers may argue that the rally is yet another unsuccessful attempt at resistance. Above it, flows have a better chance of transforming the recent rebound into a lasting demand signal.
CME FedWatch continues to serve as the live market-implied indicator of how rate expectations are evolving through that test.
Two scenarios emerge from the updated chart. In the flow-led scenario, crude oil remains high but does not accelerate, the S&P 500 stabilizes, and Bitcoin reclaims the upper-$77,000s before testing the $78,100 to $80,100 range.
In the macro-pressure scenario, crude keeps inflation expectations elevated, Fed pricing moves against risk assets, the S&P 500 weakens, and Bitcoin stays below the upper-$77,000s. This would restore the familiar April sequence: oil pressure first, equity stress second, Bitcoin liquidity last.
Bitcoin has shown it can disregard crude oil for a sufficient duration to demonstrate that the oil shock is not the sole intraday influence. Once the US market opened, equities became the catalyst that pulled Bitcoin lower. The ongoing regime test now hinges on whether flows can rebuild the bid while crude oil and the Fed maintain pressure on risk assets.
The post Bitcoin surges alongside oil as BTC price finally decouples from the war narrative… until US markets opened appeared first on CryptoSlate.