Disclaimer: Information found on CryptoreNews is those of writers quoted. It does not represent the opinions of CryptoreNews on whether to sell, buy or hold any investments. You are advised to conduct your own research before making any investment decisions. Use provided information at your own risk.
CryptoreNews covers fintech, blockchain and Bitcoin bringing you the latest crypto news and analyses on the future of money.
How the $6 trillion surge in the S&P 500 highlights Bitcoin’s struggles within a limited trading range
Traditional equities such as the S&P 500 are experiencing a remarkable resurgence, overcoming weeks of geopolitical concerns to reach new all-time highs.
In contrast, Bitcoin, which has typically benefited from risk-on sentiment, is noticeably lagging, prompting investors to ponder what elements are absent from its narrative.
This week, the S&P 500 closed up by 0.8%, elevating the benchmark index to a record 7,022.95 and surpassing its previous high set in late January.
This achievement signifies a significant turnaround from the volatile first quarter, during which the index fell nearly 10% to a local low of 6,316.91 on March 30 amid the US-Israel-Iran conflict and subsequent oil price fluctuations.
While Wall Street rejoices in a return to “greed” and major tech stocks regain their market leadership, Bitcoin remains trapped in an extended consolidation phase.
The leading cryptocurrency continues to trade well below its former all-time high, underscoring a rare and ongoing decoupling from traditional risk assets that has not been seen with such intensity since 2020.
Why this matters
For years, Bitcoin has acted as a high-beta extension of the stock market, magnifying significant risk-on movements in equities. If this correlation is deteriorating just as Wall Street enters a robust momentum phase, crypto investors may miss a crucial segment of the global risk rally or face a sharper catch-up move if capital suddenly shifts back on-chain.
The ‘momentum thrust' fueling equities
The speed of the stock market’s recovery has taken many institutional desks by surprise.
In the two weeks following the late-March lows, markets have swiftly adapted to the ongoing geopolitical uncertainty in the Middle East, adding over $6 trillion in market capitalization.
Warren Pies, founder of 3F Research, noted that the market’s trajectory over the past ten days represents a statistical anomaly. The S&P 500’s nearly 10% increase places it in the 99.7th percentile of all 10-day returns.
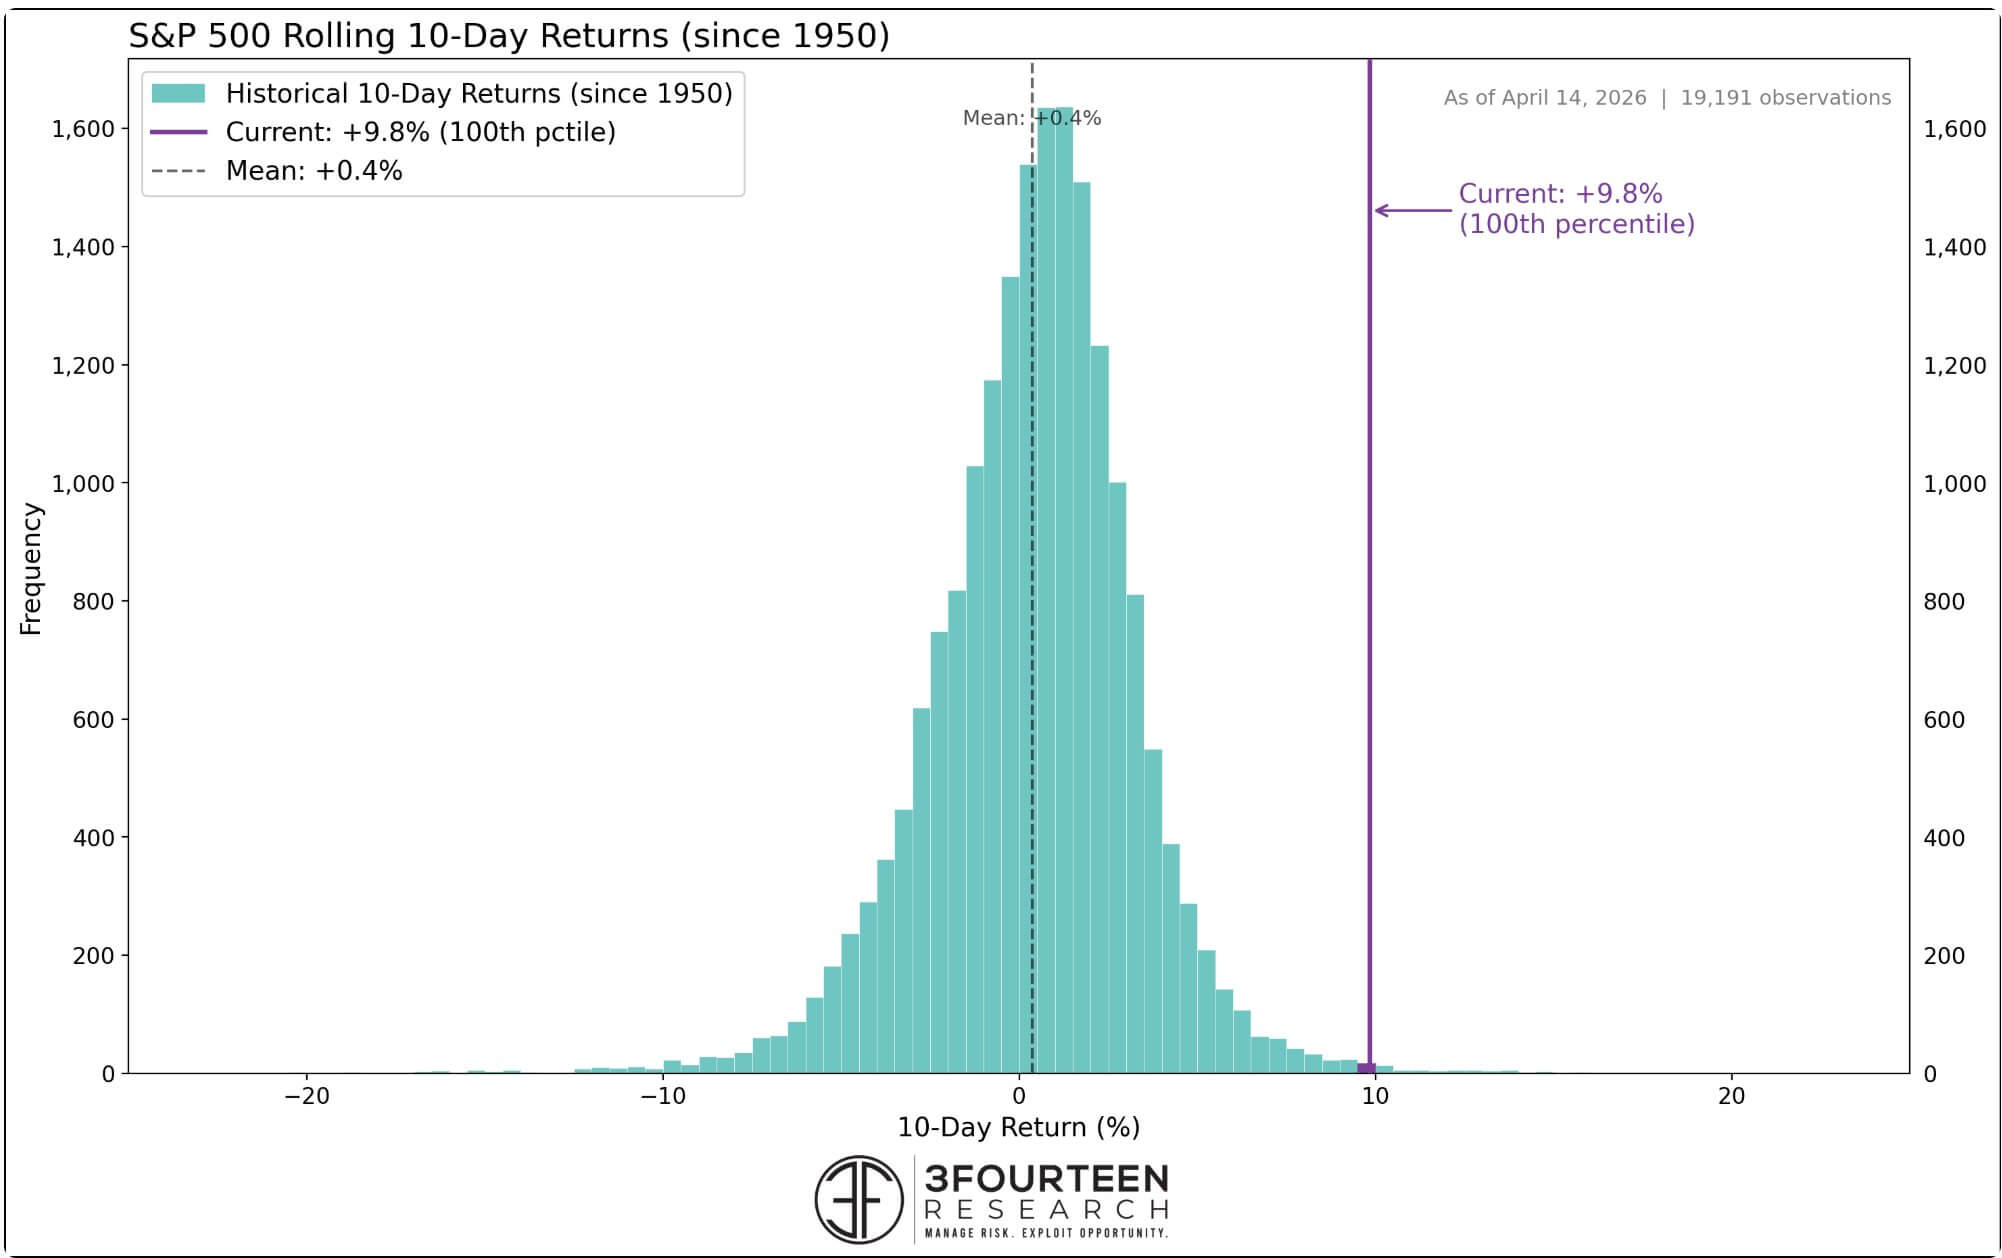 S&P 500 10-Day Return (Source: 3F Research)
Historically, there have only been 20 instances since 1950 where the stock market has achieved such aggressive short-term gains. Pies described these occurrences as bullish “momentum thrusts,” which typically yield an average return of 19% over the following twelve months.
 Related Reading
Global markets crash as everything including Bitcoin sells off at once erasing trillions
Over $800 million in long positions were eliminated in minutes as the US open turned into a severe liquidity crisis for unsuspecting traders.
Jan 29, 2026 · Liam 'Akiba' Wright
However, what distinguishes the current equity rally is its proximity to all-time highs.
Pies pointed out that previous momentum thrusts almost exclusively occurred during deep bear markets, with indices still languishing 20% or more below their peaks.
In contrast, the current market recovery has been notably top-heavy. Since the March 30 low, a fund tracking the “Magnificent 7” mega-cap technology stocks has surged nearly 18%, outpacing the broader S&P 500 by approximately 8% when excluding those seven companies.
This vigorous institutional buying is primarily driven by the “AI-Infrastructure” narrative, with sector leaders like Oracle acting as the main engines of global productivity growth.
Additionally, the macroeconomic environment has provided a strong tailwind.
Decreasing tensions in the Persian Gulf, underscored by diplomatic discussions and a temporary ceasefire, have eased immediate concerns of a prolonged blockade in the Strait of Hormuz.
Simultaneously, the US Producer Price Index (PPI) data for March came in significantly below expectations at 0.1%, indicating that the US economy remains highly resilient and largely insulated from the temporary energy-driven inflation spikes that limited market gains earlier in the year.
A historic decoupling for the crypto market
While the Nasdaq Composite simultaneously celebrated a 10-day winning streak, its longest since late 2021, the digital asset sector has not mirrored this unrestrained optimism.
Despite the easing macroeconomic pressures, Bitcoin remains heavily discounted, trading in the $74,000 to $76,000 range.
This represents a substantial 40% decline from its previous all-time high of over $126,000, reflecting the sluggishness that has persisted for several months.
Data gathered by CryptoQuant highlights this divergence. The firm notes that Bitcoin has traditionally functioned as a high-beta asset that loosely follows the liquidity trends of the S&P 500 and Nasdaq.
Related Posts
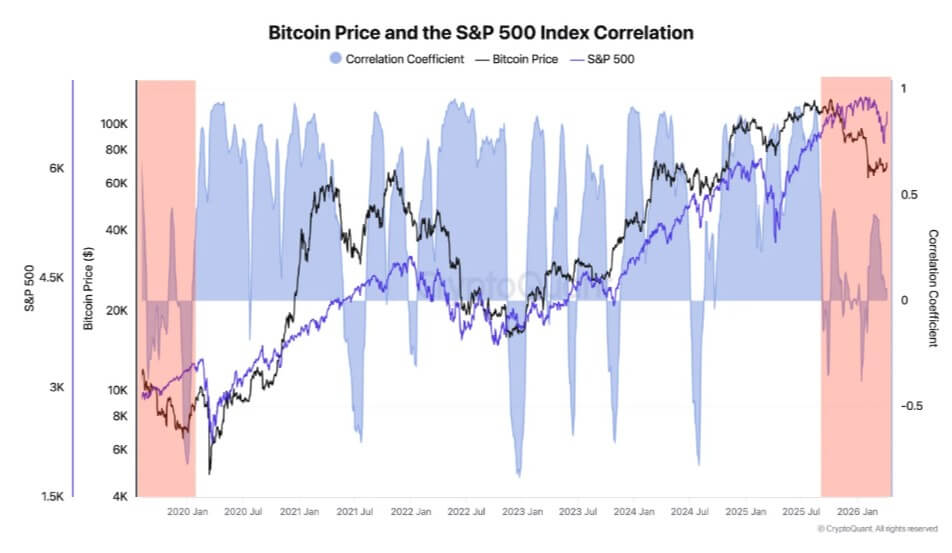 Bitcoin Decouples from S&P 500 (Source: CryptoQuant)
However, its current price performance is influenced by its own internal sluggish dynamics. Consequently, the ongoing period of weak correlation with the S&P 500 is now the longest stretch observed in over four years.
This is also evident in the sentiment across the digital asset space, which has shifted into a “complacency phase.”
According to analytics firm Alphractal, broader crypto market sentiment is at a neutral, borderline bullish level, which is highly unusual given the asset’s significant distance from price discovery.
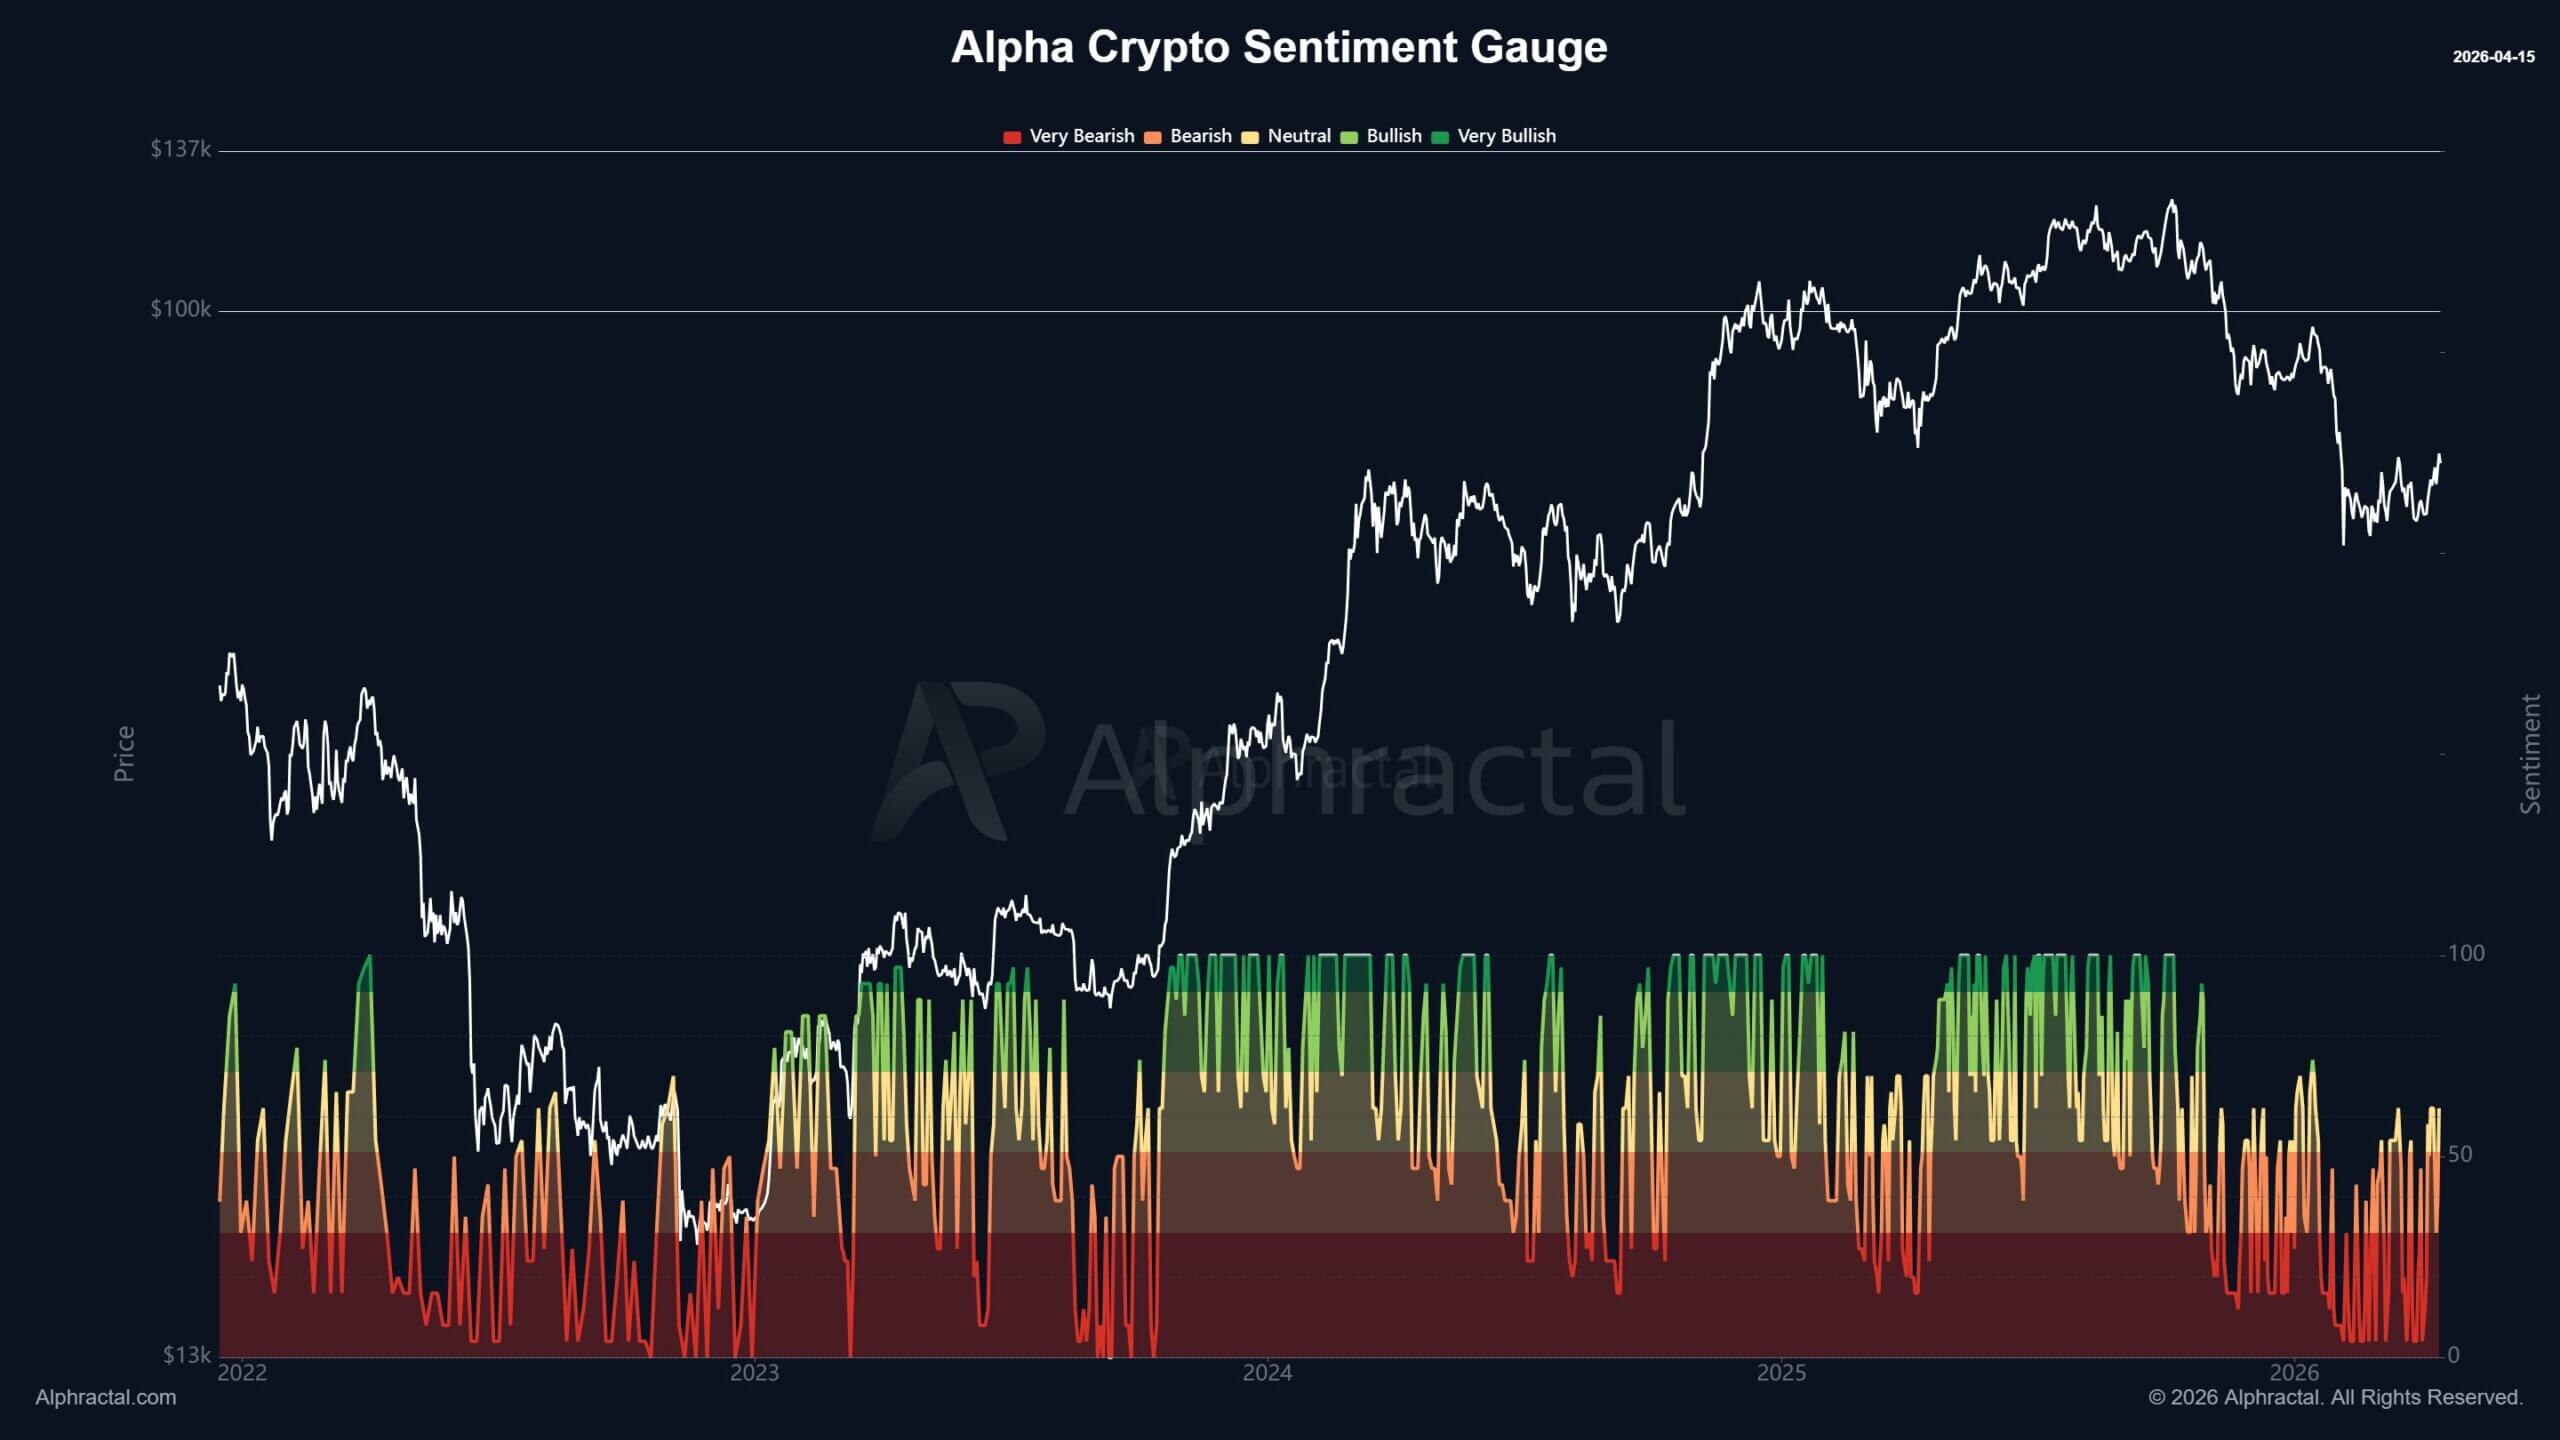 Crypto Market Sentiment Gauge (Source: Alphractal)
On-chain metrics signal a fragile recovery
Underneath the surface, on-chain data reveals the reasons behind Bitcoin’s struggle to break out: a significant lack of sustained capital inflow.
Alex Adler, an analyst at CryptoQuant, pointed to the 30-day Realized Cap change, a metric that tracks net capital inflow into the Bitcoin network.
Since mid-January, this metric has been signaling warning signs. Out of the first 105 days of 2026, only seven recorded a positive 30-day Realized Cap change. Since January 23, capital has been systematically exiting the network, culminating in an extreme localized outflow in late February.
Adler remarked:
“Since mid-January, capital has been systematically leaving the network without meeting compensating demand.”
While the outflow pressure has eased in recent weeks, improving to -0.32% from steeper deficits earlier in the month, a genuine macroeconomic reversal has yet to take place.
For Bitcoin to mount a credible challenge to its all-time highs, Adler contends that the Realized Cap must shift into sustained positive territory for several weeks, accompanied by price appreciation above key short-term holder cost bases.
There are, however, early signs of structural improvement. Bitcoin is currently testing its Adjusted Realized Price, which is approximately $72,300. This metric represents the average break-even level for a large group of active investors.
Reclaiming and maintaining this cost basis is typically a prerequisite for a sustained bullish trend, serving as a crucial psychological support level that encourages investors to hold rather than capitulate during pullbacks.
Institutional positioning and the path forward
Despite the absence of a definitive breakout, the institutional presence in the crypto market remains highly apparent.
Rachel Lucas, a crypto analyst at BTC Markets, emphasized that Bitcoin’s recent move toward a 70-day high of $76,000 was significantly supported by $411.5 million in daily spot ETF inflows, the second-largest single-day figure recorded in April.
Moreover, options markets are reflecting a subtle shift in risk appetite. According to Block Scholes, the strong skew towards put contracts (downside protection) in Bitcoin options markets has begun to diminish following the de-escalation in the Middle East.
However, this reduction in downside fear has not directly resulted in aggressive spot buying.
Glassnode data indicates that while spot and ETF demand are improving, the market is characterized by quick profit-taking and cautious options positioning.
According to the firm, the current recovery is highly “twitchy” and flow-driven, lacking the deep-seated conviction seen in traditional equities.
In light of this, market-structure analysts at Bitunix informed CryptoSlate that Bitcoin is currently serving as a real-time test of the market due to its ability to absorb risk.
The asset faces a significant supply zone and clear resistance around $75,500, with a dense cluster of leveraged liquidations positioned just above $76,000.
For now, the $70,000 level remains the critical support floor that institutional buyers are actively defending.
If Bitcoin can convincingly surpass the $76,000 resistance, it could trigger a cascading short squeeze, forcefully concluding the asset’s historic decoupling and realigning it with the broader, record-setting Wall Street supercycle.
Lucas explained:
“A sustained break above US$76,000 would represent a meaningful structural shift and open the path toward the $80,000 handle.”
Until then, the crypto market remains in a tense holding pattern, awaiting the capital inflows necessary to validate a new bull phase.
The post Why S&P 500’s $6 trillion melt up rally exposes Bitcoin amid range-bound weakness appeared first on CryptoSlate.