Disclaimer: Information found on CryptoreNews is those of writers quoted. It does not represent the opinions of CryptoreNews on whether to sell, buy or hold any investments. You are advised to conduct your own research before making any investment decisions. Use provided information at your own risk.
CryptoreNews covers fintech, blockchain and Bitcoin bringing you the latest crypto news and analyses on the future of money.
Bitcoin whales have acquired the highest amount of BTC since 2013, yet the price remains under $80,000.
Throughout much of 2026, Bitcoin has oscillated between attempts at recovery and macroeconomic shocks, yet one segment of the market has consistently progressed in a singular direction. Major holders have been increasing their purchases.
On April 16, Bitfinex showcased CryptoQuant data indicating that whales acquired 270,000 BTC in the preceding 30 days, marking the most significant buying surge since 2013, while exchange reserves dwindled to their lowest point since December 2017.
This combination carries more significance than usual, suggesting a market where the available supply is diminishing beneath the surface, even as the price remains significantly below the all-time high of $126,198 reached in October 2025.
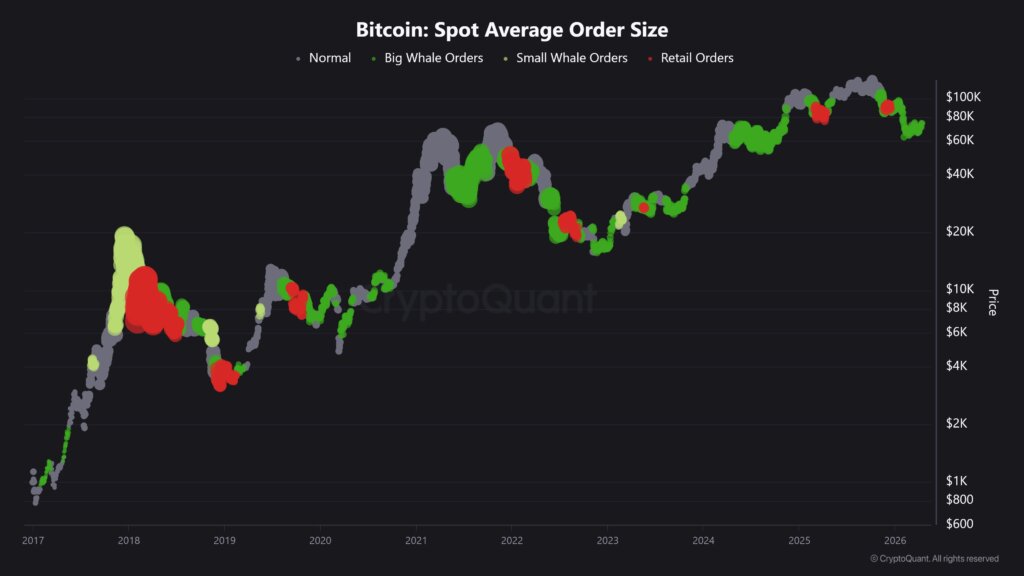 CryptoQuant chart illustrating Bitcoin’s spot average order size from 2017 to 2026, with color-coded markers emphasizing periods dominated by large whale orders, small whale orders, retail orders, and typical market activity.
As of the time of this report, CryptoSlate’s Bitcoin data page indicates BTC trading at approximately $74,500, reflecting a 0.9% increase over the past 24 hours, a 3.3% rise over the last week, and a 0.7% gain over the past month. The market capitalization is around $1.5 trillion, with a 24-hour trading volume exceeding $41.2 billion.
![]() #1 Bitcoin BTC $74,934.01 +0.74% Market Cap $1.5T 24h Volume $41.21B All-Time High $126,198.07 Sectors Coin Layer 1 PoW
#1 Bitcoin BTC $74,934.01 +0.74% Market Cap $1.5T 24h Volume $41.21B All-Time High $126,198.07 Sectors Coin Layer 1 PoW
These figures depict a market that has regained equilibrium following a challenging first quarter, although they only represent a portion of the supply dynamics that the CryptoQuant chart is beginning to reveal. The price has rebounded sufficiently to attract renewed interest, while the more profound change lies in the distribution of coins and their holders.
Coins held on exchanges are readily available for immediate sale. In contrast, coins transferred into colder, long-term holdings require more time and stronger conviction to re-enter the market.
When such transfers occur on a large scale, the price may remain stable for a time and then react more sharply once new demand enters a reduced supply pool. This is the fundamental development driving the recent whale activity.
Whale accumulation has turned into a supply event
Bitcoin frequently interprets whale accumulation as a sentiment indicator, suggesting that larger holders anticipate higher prices in the future. The signal from April 16 indicates something more tangible in market dynamics.
When whales accumulate such a significant amount of BTC within 30 days as exchange balances decline, the primary concern shifts to inventory. A market with fewer easily accessible coins behaves differently when buying pressure emerges.
CryptoSlate reported in February that accumulator addresses received 66,940 BTC in a single day following a liquidation shock, an amount valued at approximately $4.7 billion at that time. Later that month, CryptoSlate noted that whales had added 200,000 BTC over the course of a month, even as short-term demand waned and the market struggled to regain momentum.
The groundwork was already laid. The April 16 CryptoQuant signal extends and sharpens this narrative.
Consistency is the key change. A one-day spike may indicate custody adjustments or balance-sheet management. A 30-day accumulation of 270,000 BTC, coupled with exchange reserves at a seven-year low, exhibits the characteristics of genuine supply withdrawal.
The calculations surrounding issuance help clarify why this phase in the cycle carries additional significance. Since the April 2024 halving, Bitcoin has generated 3.125 BTC per block, resulting in annual supply growth significantly lower than in previous cycles.
CryptoSlate’s Bitcoin reference data indicates that over 20.02 million BTC have already been mined out of the maximum 21 million. In a market already grappling with a limited float, the movement of another 270,000 BTC into stronger hands alters the balance between buyers and sellers.
A breakout still hinges on demand, but the threshold for a more substantial movement becomes easier to achieve when fewer coins are available at market price.
The current contradiction is evident. Bitcoin remains approximately 40.77% below its peak, which keeps the chart far from euphoric.
Simultaneously, the supply side appears considerably tighter than what the price alone indicates. The 30-day return remains below 1%, suggesting the market is in a holding pattern. The CryptoQuant chart indicates a different trajectory.
Surface stability can coexist with a diminishing pool of available coins, and this combination often creates the conditions for a more pronounced movement later.
It would be simplistic to state, “whales are bullish,” as that only captures part of the situation. Bullishness is a perspective. A reduced pool of readily available coins is a condition.
Conditions influence how markets respond once a catalyst emerges. If the largest holders continue to absorb supply and exchange reserves keep declining, Bitcoin will require less incremental demand to elicit a more significant price reaction.
This is the mechanism underlying the current setup, and it elucidates why this accumulation wave warrants more attention than the typical on-chain signal.
ETF flows and treasury buyers are testing a thinner market
A thin supply becomes potent once demand returns with sufficient persistence to challenge it. This is why ETF flows and treasury purchases remain crucial to the next phase.
The overall trend since February has been inconsistent, although the direction has improved over the last several sessions. Farside Investors’ daily Bitcoin ETF flow data reveals that U.S. spot Bitcoin ETFs absorbed $471 million on April 6, then shifted to a $159 million outflow on April 7, followed by a $93 million outflow on April 8, and then rebounded to $358 million of inflows on April 9, $256 million on April 10, $411 million on April 14, and $186 million on April 15.
This indicates a buyer base returning in bursts rather than following a linear trajectory.
The weekly fund data reflects a similar narrative. On March 30, CoinShares reported $414 million in digital asset fund outflows, marking the first weekly outflow in five weeks, as concerns regarding the Iran conflict and a shift in June FOMC expectations impacted sentiment.
The United States accounted for $445 million of those outflows, while Germany and Canada capitalized on the weakness. Bitcoin products still maintained a robust year-to-date net inflow position, although the weekly movement illustrated how swiftly macro stress can disrupt demand.
Two weeks later, CoinShares’ report indicated $1.1 billion of inflows, the strongest weekly total since early January, with Bitcoin alone attracting $871 million. Concurrently, trading volumes at $21 billion remained significantly below the year-to-date average of $31 billion, and short-Bitcoin products continued to see substantial inflows.
Demand has improved, although conviction remains incomplete, and hedging activity continues to play a noticeable role.
Related Posts
Public company demand for Bitcoin remains active but is primarily concentrated in a single entity. Strategy’s Bitcoin purchases page indicates that this company now holds 780,897 BTC at an average acquisition price of $75,577.
Corporate treasury accumulation does not exhibit the same daily rhythm as ETF flows, yet it reaches the same conclusion. Coins exit the liquid market and are transferred into the hands of those who intend to hold through volatility, assuming that thesis holds.
 Related Reading
Bitcoin treasury trade faces a stress test as debt pressure triggers selling
Corporate and sovereign BTC holders are selling into stress, raising new questions about the durability of treasury demand.
Apr 4, 2026 · Andjela Radmilac
When ETF inflows, treasury purchases, and whale accumulation occur simultaneously, they deplete the same pool of spot inventory.
The market has another reason to focus on this setup, as the macro backdrop remains unresolved. Earlier this month, CryptoSlate noted that Bitcoin entered April on a stronger footing following a late-March relief rally, although the recovery still faced a macro test linked to Fed expectations and geopolitical risks.
This framework remains applicable. ETF demand can resurge, whales can continue their buying, and reserves can keep diminishing, while a sharper repricing in rates or renewed geopolitical tensions can still hinder the entire process.
The recent flow pattern effectively captures that tension. Buyers have returned, yet they have not committed to a smooth, uninterrupted trajectory.
Macro pressure still shapes the speed of the move
This leaves Bitcoin in a position that is both delicate and powerful. Delicate, because the marginal buyer still reacts to macro headlines. Powerful, because once that buyer commits, the spot market may have fewer coins to offer than it did earlier in the year.
This is where the April 16 accumulation data gains broader significance. It exists at the intersection of supply, ETF demand, corporate purchasing, and macro sensitivity, all simultaneously.
The next question is straightforward, even if the answer remains uncertain. Does Bitcoin possess sufficient returning demand to compel a repricing in a market that appears short on easily accessible sell-side supply?
A definitive affirmative would transform how the market behaves from this point forward. A sustained series of positive ETF flows, combined with ongoing reserve compression and further whale accumulation, would exert more pressure on price than the current seven-day gains imply.
Under such conditions, resistance begins to weaken as the market operates with less nearby inventory. Price increases can also become more abrupt, as the next seller often waits at a higher level.
An alternative path is less dramatic but still constructive. Demand can remain positive yet inconsistent, as observed in recent ETF flow data and CoinShares’ weekly volume figures.
In that scenario, Bitcoin can continue to trend higher or sideways without generating the kind of breakout that attracts a much broader audience. The supply squeeze remains genuine, although the market may not receive enough demand at once to fully reveal it.
This would keep Bitcoin in a regime where every positive week appears promising, and every macro fluctuation interrupts the movement before it fully develops.
A weaker path also warrants attention, though for a narrower reason than usual. The primary risk is not that the accumulation data is inaccurate, but rather that it becomes overwhelming. Macro shocks still hold veto power over risk assets.
As Fed expectations shift toward tighter policies and geopolitical tensions continue to escalate, buyers may retreat even while supply remains limited. In that scenario, Bitcoin trades primarily as a macro-sensitive asset and secondarily as a scarcity asset.
Another risk lies within the on-chain data itself. As CryptoSlate noted in February, custody reshuffles can sometimes mimic fresh accumulation. That caveat remains relevant.
The April signal carries more significance due to its duration and its correlation with lower exchange reserves, while disciplined reporting continues to distinguish strong evidence from absolute proof.
Bitcoin is trading against a tighter supply base
At present, the most evident conclusion is that Bitcoin has entered a more sensitive market structure. The latest price, the recent rebound in ETF inflows, Strategy’s ongoing purchases, and the 270,000 BTC whale accumulation wave all point toward the same outcome.
A larger portion of the coin supply appears increasingly reluctant to sell at current price levels. If demand continues to return, the market may uncover that the real shortage was hiding in plain sight. If demand wanes again, the setup remains incomplete rather than invalidated.
In either case, the whale data adds a vital detail to the current market landscape.
Bitcoin is trading against a supply base that may already be tighter than many in the market assume.
Exchange reserves have declined to their lowest level since December 2017, whales have accumulated at a rate not seen since 2013, ETF inflows have resumed after a turbulent period, and one of the largest public corporate holders continues to withdraw coins from circulation. Each of these developments has its own rationale.
Together, they illustrate a market where available supply is contracting while several demand channels remain active.
The outcome is an asymmetric sensitivity setup. A modest increase in demand can have a more significant impact than it would in a looser market. A pause in demand can leave Bitcoin range-bound for an extended period, although the underlying supply situation would still remain tight.
This is why the upcoming weeks could hold unusual significance.
The post Bitcoin whales just bought the most BTC since 2013 – so why is the price stuck below $80,000? appeared first on CryptoSlate.