Disclaimer: Information found on CryptoreNews is those of writers quoted. It does not represent the opinions of CryptoreNews on whether to sell, buy or hold any investments. You are advised to conduct your own research before making any investment decisions. Use provided information at your own risk.
CryptoreNews covers fintech, blockchain and Bitcoin bringing you the latest crypto news and analyses on the future of money.


Ethereum continues to face downward pressure near $2.3K, as its most recent price rally proved insufficient to halt the prevailing bearish trend. Having lost the ascending daily channel, market focus has now shifted to immediate support levels and areas of high liquidation volume located below the current price.
Ethereum Price Analysis: The Daily Chart
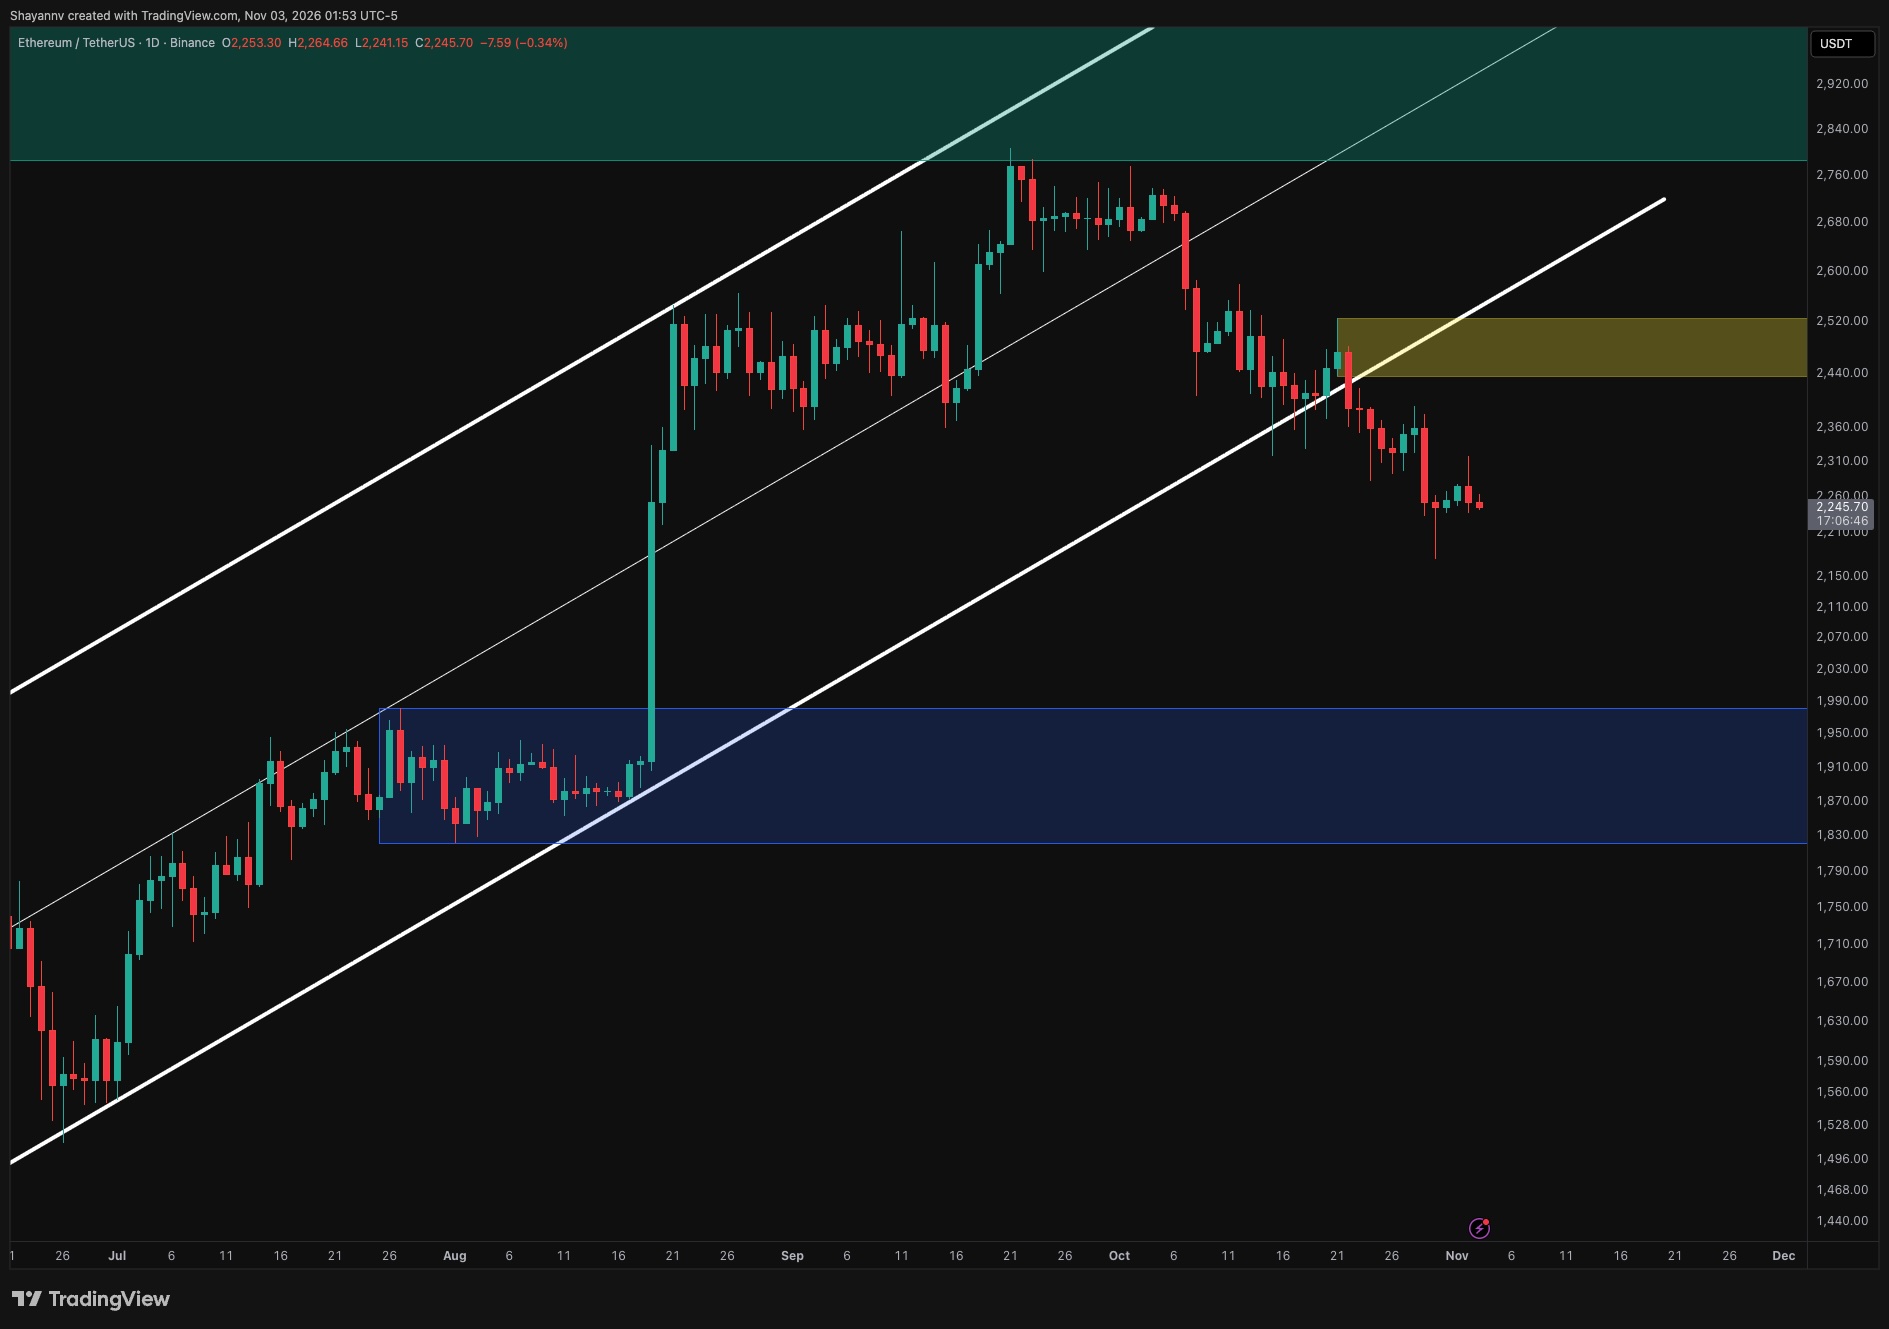
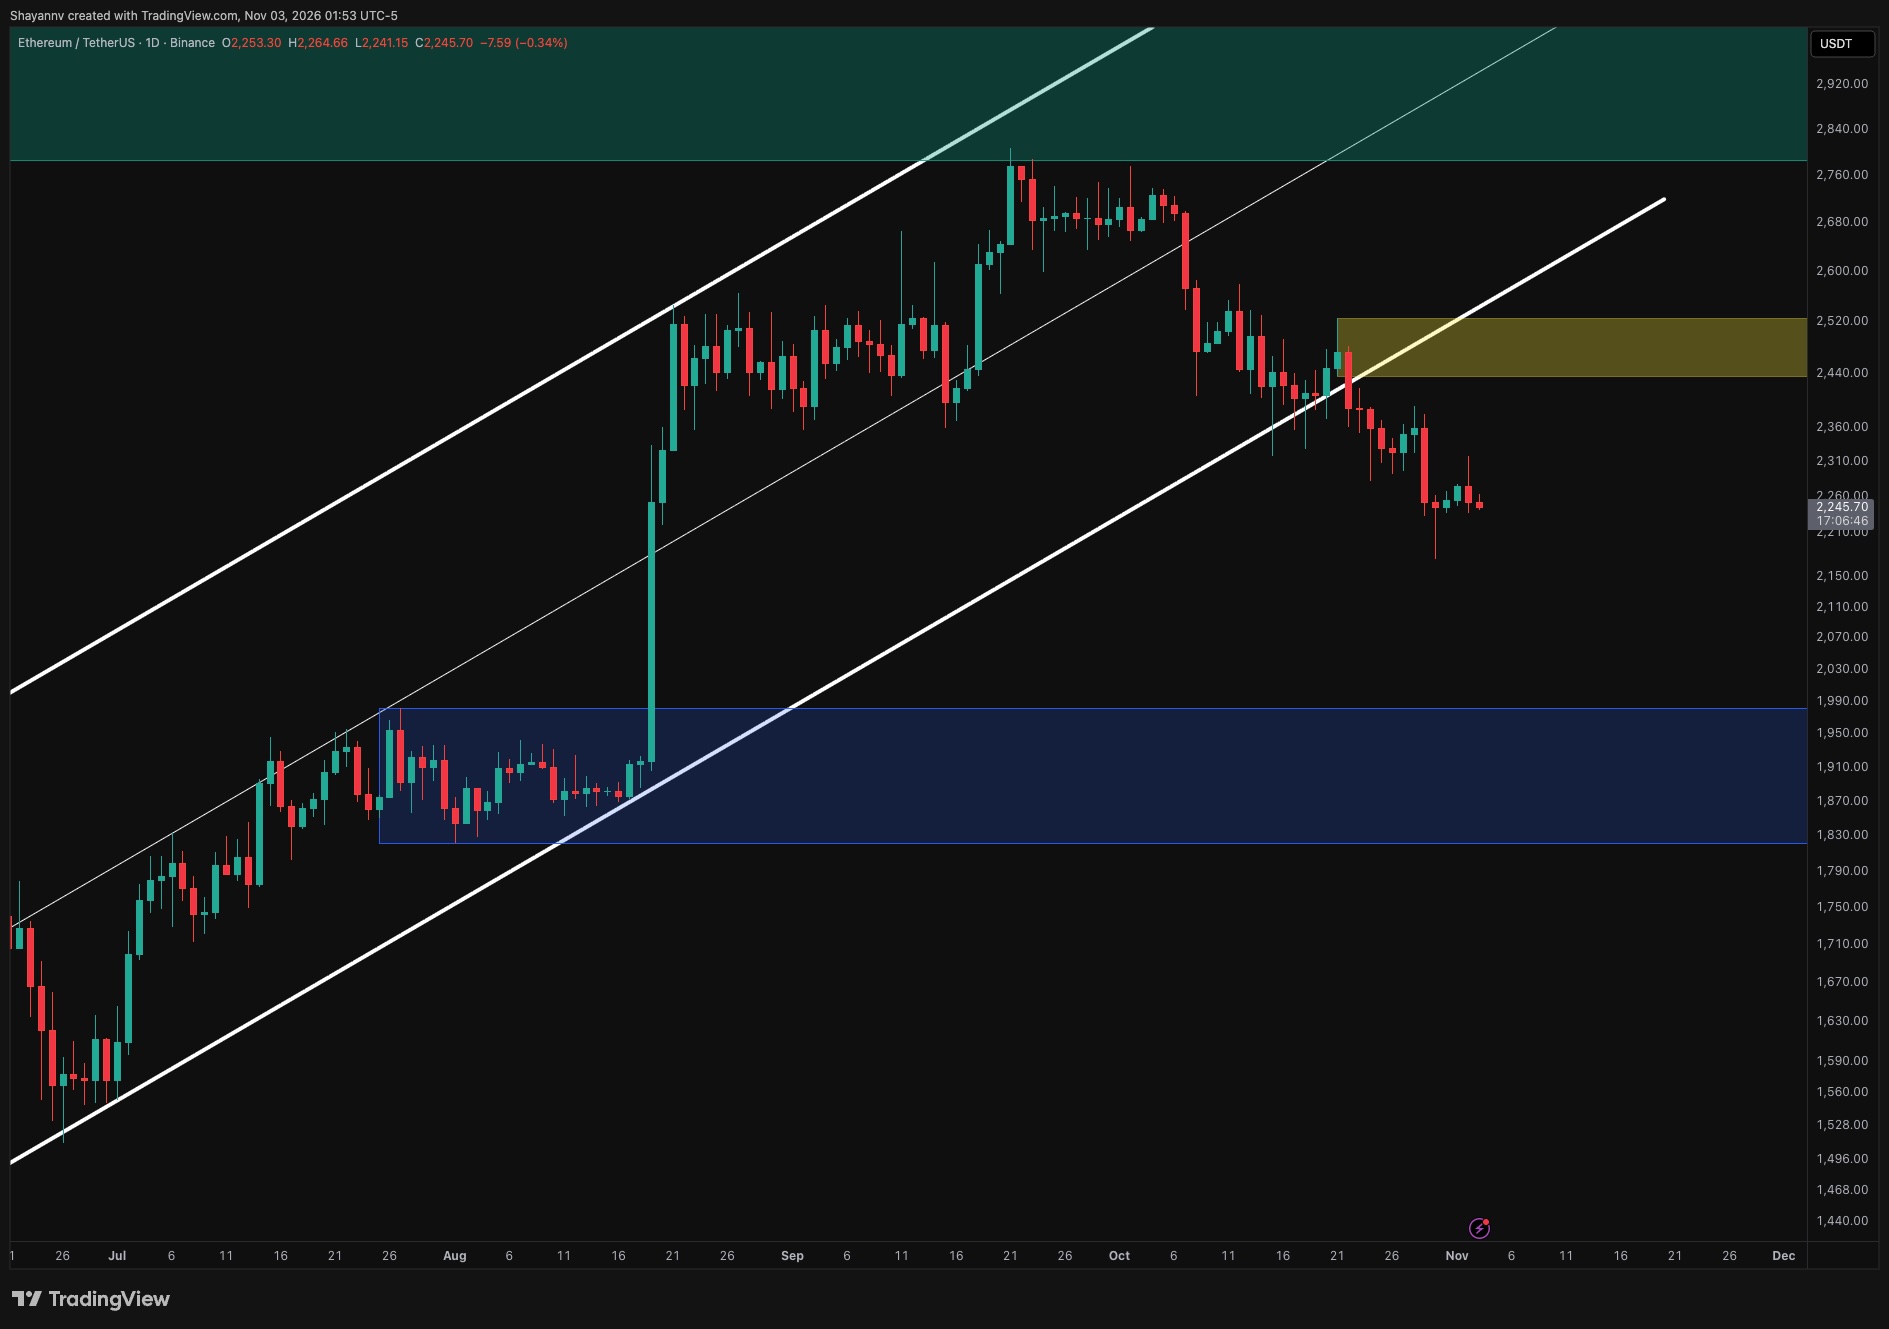
The daily chart reveals a weakening structure for Ethereum following its exit from the ascending channel. A subsequent price rally into the $2.44K–$2.52K supply area was rejected, confirming the bearish weight of the broken channel boundary. Since that rejection, ETH has consistently generated lower highs and lower lows.
The most recent price drop created a sharp wick down to $2.17K, followed by a slight recovery that has struggled to maintain levels above $2.26K. This indicates that buyers are attempting to defend recent lows, but their efforts have not yet created a definitive trend reversal. The $2.17K–$2.22K area now serves as a critical near-term support level. A decisive break below this zone would expose the psychological $2K level, with the broader daily demand zone sitting at approximately $1.82K–$1.98K.
For the bullish outlook to improve, ETH must first reclaim the $2.31K–$2.36K region, where multiple recent candles consolidated prior to the latest selloff. However, the more formidable obstacle remains the $2.44K–$2.52K supply zone. Until this area is reclaimed, any price recoveries remain susceptible to renewed selling pressure.
ETH/USDT 4-Hour Chart
Related Posts
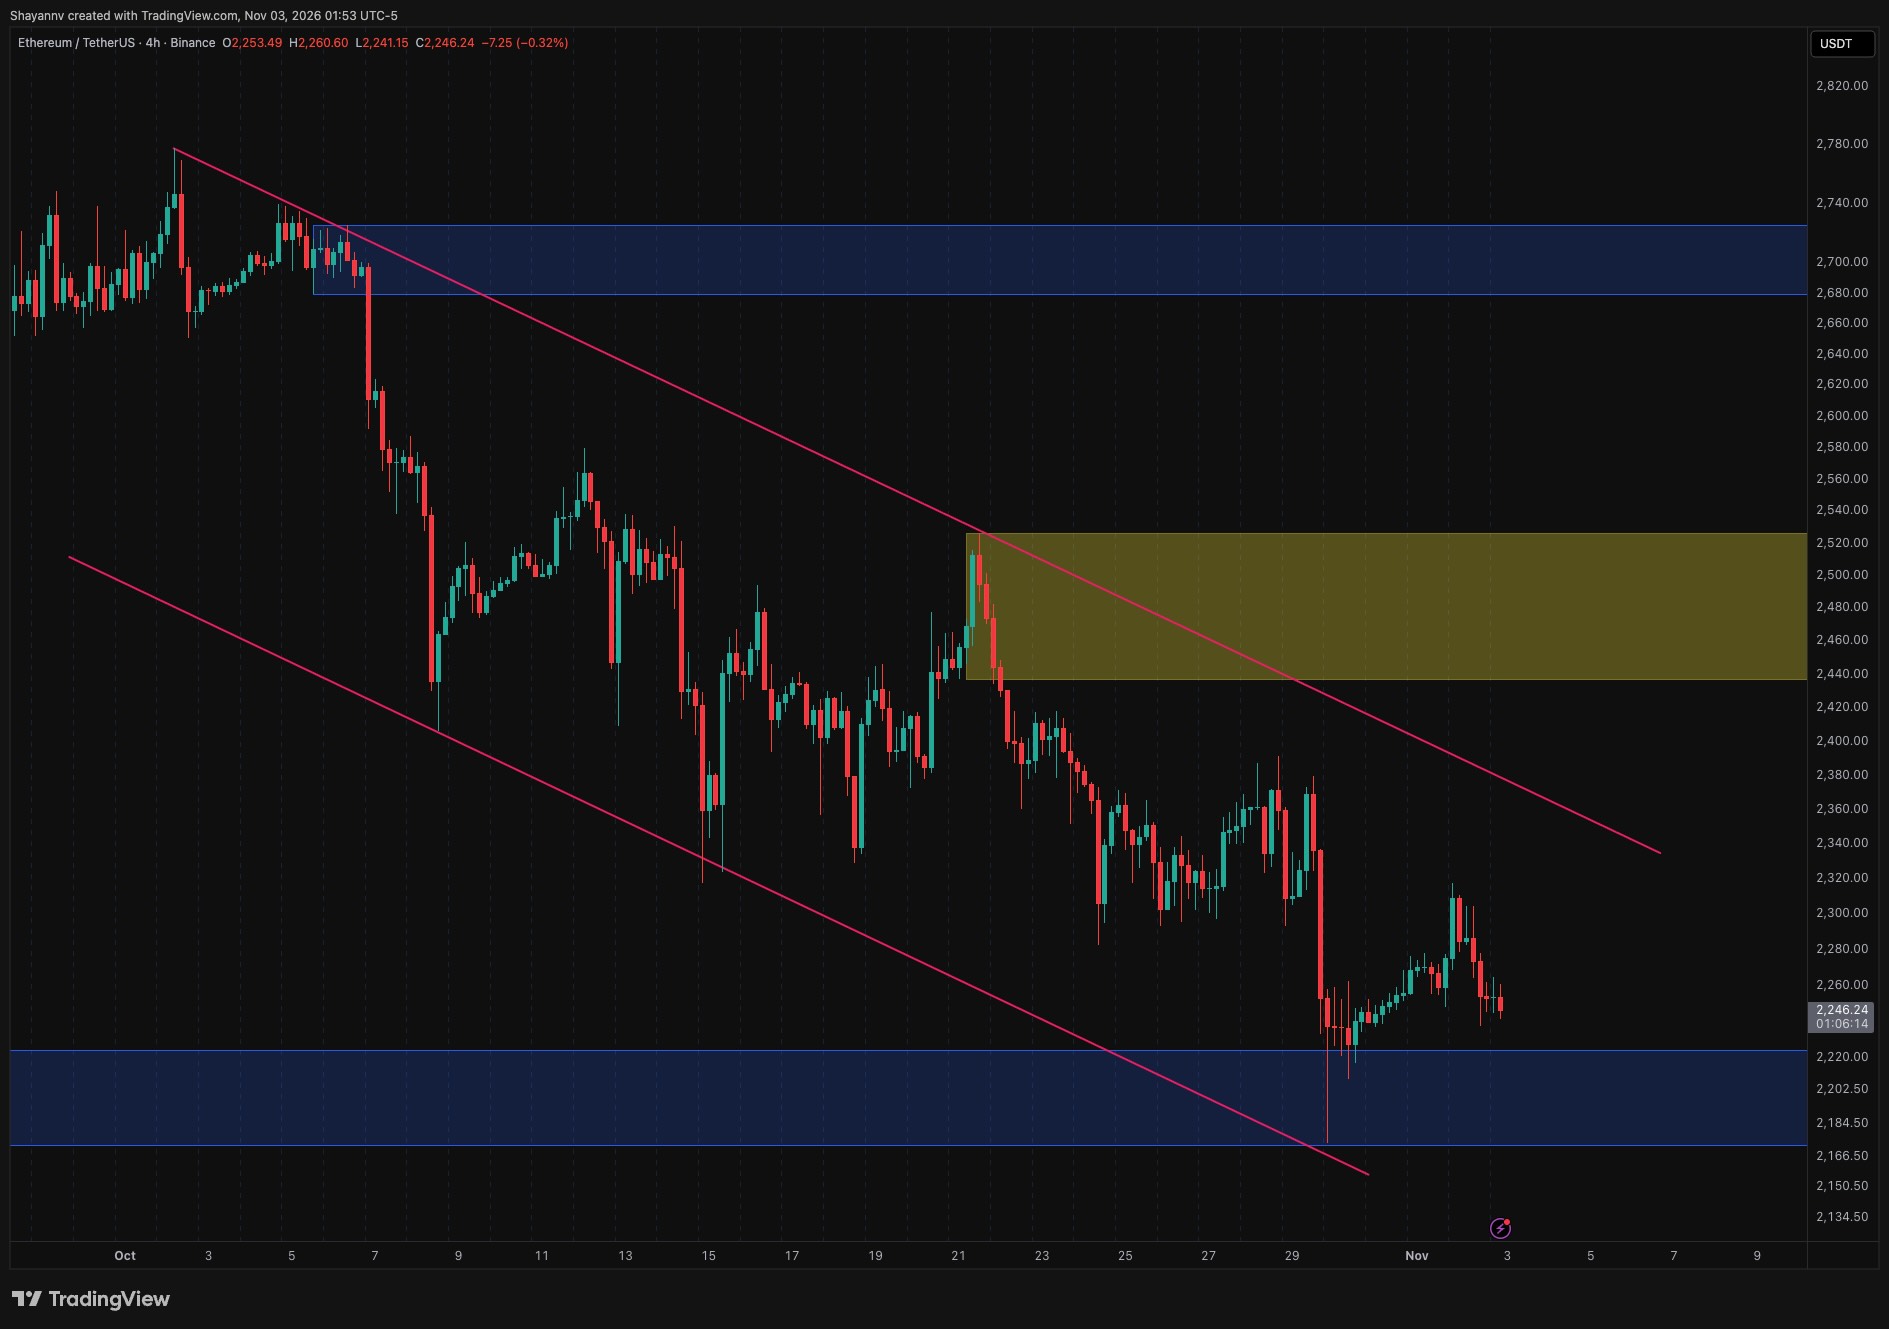
On the four-hour timeframe, Ethereum is trading within a descending channel. The recent selloff extended into the $2.17K–$2.22K demand zone near the channel's lower boundary, sparking a rebound toward $2.31K. This recovery was subsequently rejected, pushing the price back to approximately $2.25K.
The inability to sustain the bounce maintains the pattern of lower highs, suggesting that sellers retain control of the short-term structure. If ETH fails to regain the $2.30K–$2.31K area, another test of the $2.17K–$2.22K support zone becomes likely. Continued pressure on this demand zone could heighten the risk of a breakdown, though the recent rejection wick indicates that buying interest persists.
Conversely, a sustained move above $2.31K would bring the upper boundary of the descending channel, currently located around $2.35K–$2.38K, into focus. A break above this trendline would weaken the immediate bearish setup and could facilitate a broader recovery toward the $2.44K–$2.52K supply zone.
Sentiment Analysis
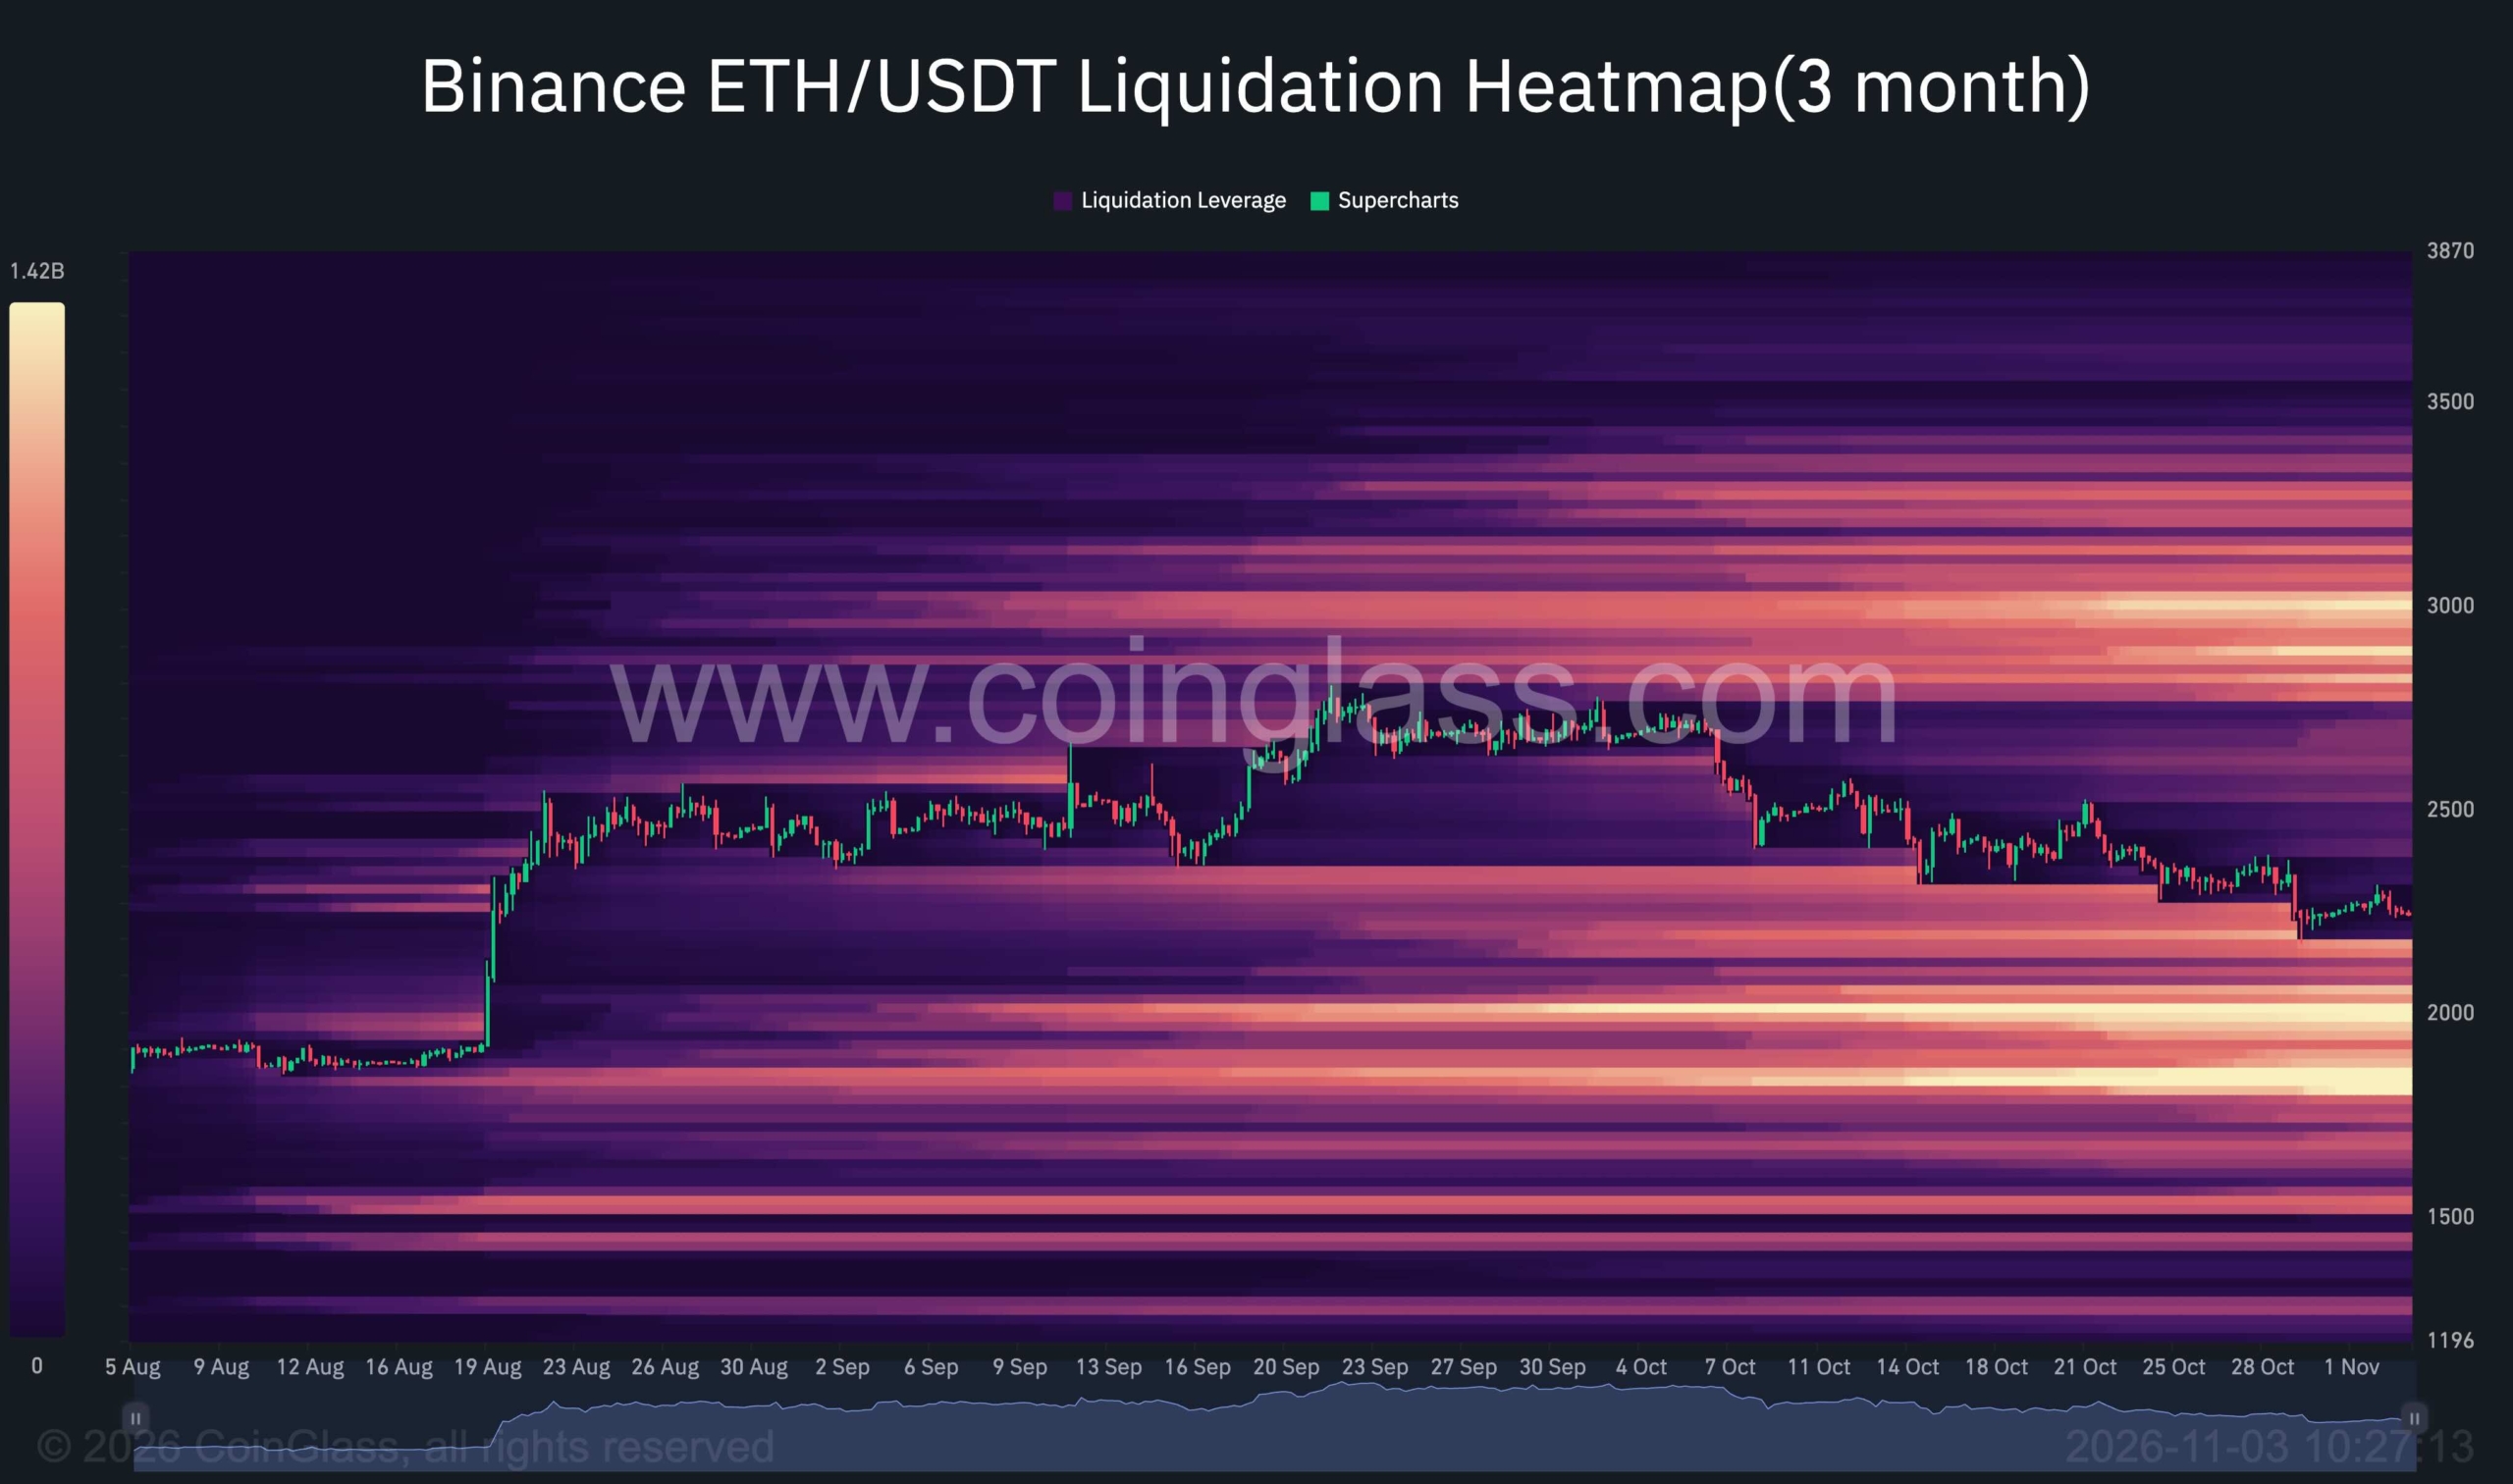
The Binance ETH/USDT liquidation heatmap reveals estimated concentrations of liquidations below the current price. A nearby band exists around $2.15K–$2.20K, largely overlapping the support region identified on price charts. A larger, more intense concentration is visible around $2K–$2.05K.
This positioning makes the area just above $2K particularly significant if Ethereum loses its recent lows. A move into these levels could trigger long liquidations and amplify downside volatility. However, the heatmap highlights potential liquidation exposure rather than guaranteed price targets or confirmed buying support.
Above the current market, substantial liquidation concentrations remain around $2.8K–$3K, but these are distant from the active price structure. For now, nearby downside clusters and repeated failed recoveries keep the focus on support levels. A recovery above the four-hour descending channel would be the first technical development to alleviate this pressure.
