Disclaimer: Information found on CryptoreNews is those of writers quoted. It does not represent the opinions of CryptoreNews on whether to sell, buy or hold any investments. You are advised to conduct your own research before making any investment decisions. Use provided information at your own risk.
CryptoreNews covers fintech, blockchain and Bitcoin bringing you the latest crypto news and analyses on the future of money.

The cryptocurrency market expands amid zero likelihood of interest rate declines: what lies ahead?, 2026/03/13 16:19:18


Мнение Конфликт между США и Израилем на Ближнем Востоке продолжается, и свежие данные из США не оказались катастрофически плохими. Без новых шокирующих новостей криптоинвесторы вздохнули с облегчением, и цифровые активы немного увеличили свою стоимость.
Related Posts
Биткоин
С 6 по 13 марта 2026 года цена биткоина возросла на 4,67%. Крупнейшая криптовалюта по рыночной капитализации продолжает оставаться в диапазоне $70 000–$72 000. Если первые две торговые сессии на неделе завершились снижением BTC, то последние пять показали рост.
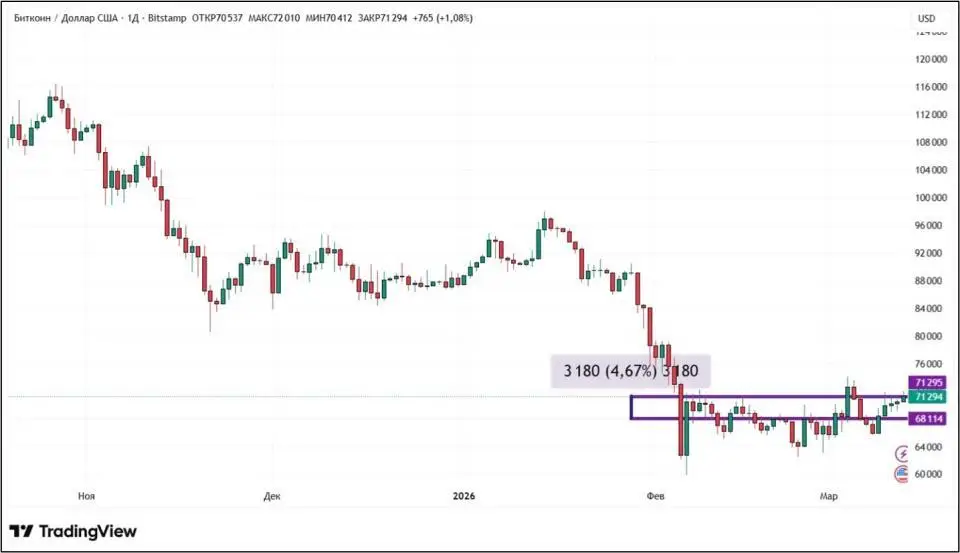
Источник: tradingview.com
Прошедшая неделя была отмечена значительным объемом опубликованных экономических данных из США. Сначала были обнародованы данные по инфляции за февраль. В годовом выражении рост составил 2,4%, что полностью совпало с консенсус-прогнозом. Этот показатель остается на самых низких уровнях с мая прошлого года. Базовая инфляция, исключающая цены на продукты питания и энергоносители, составила 2,5%, что также соответствует консенсус-прогнозу. Позже появились данные о количестве заявок на пособия по безработице за первую неделю марта. Их число составило 213 000, что немного ниже ожидаемых 215 000. В результате информация по ценам и рынку труда оказалась нейтральной. Это не увеличило вероятность снижения ключевой ставки на ближайшем заседании ФРС США, запланированном на 18 марта. По данным Чикагской товарной биржи (CME), вероятность того, что ставка останется в диапазоне 3,5%–3,75%, составляет 99,8%.
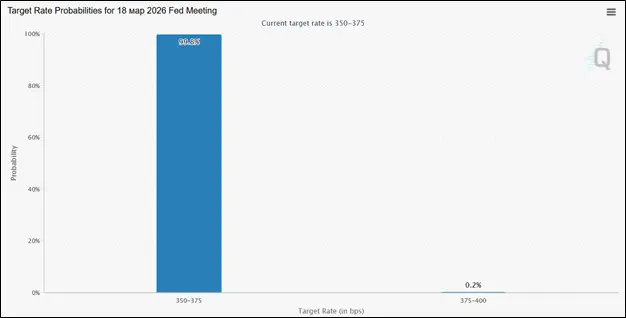
Источник: cmegroup.com
Аналитики платформы CryptoQuant также не испытывают эйфории в связи с ростом биткоина на прошлой неделе. Эксперты обращают внимание на показатель Supply in Loss, который отражает процент держателей BTC, находящихся в убытке, то есть купивших коины по цене выше рыночной. На середину марта этот показатель колебался в диапазоне 40–45%. Исторически это указывает на возможность сильной коррекции. В то же время, дно обычно формируется, когда доля холдеров в убытках превышает 50%. Другими словами, снижение цены, по мнению представителей CryptoQuant, еще может произойти.
Спотовые ETF на биткоин третий раз подряд демонстрируют приток средств. На этот раз за четыре торговые сессии инвесторы добавили в криптовалютные биржевые фонды $586,99 млн. Большая часть этой суммы, $456,47 млн, пришлась на фонд компании BlackRock, iShares Bitcoin Trust (IBIT).
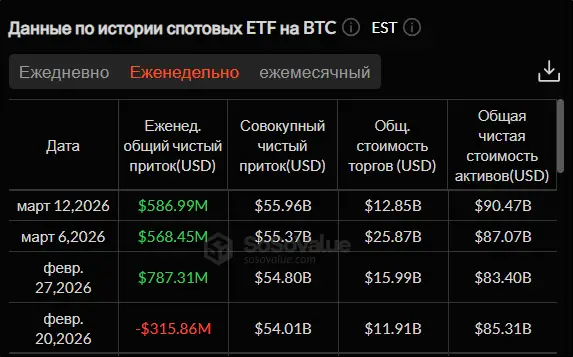
Источник: sosovalue.com
С точки зрения технического анализа, тренд биткоина остается нисходящим. Это подтверждается тем, что цена находится ниже 50-дневной скользящей средней (отмечена синим цветом). Однако индекс денежного потока (MFI) подает бычьи сигналы (на покупку). Во-первых, этот индикатор поднялся выше значения 50. Во-вторых, если проанализировать ситуацию с 4 по 13 марта, он подал сигнал о бычьей дивергенции — в этот период цена показала небольшое снижение, а индикатор вырос (на изображении ниже отмечено желтыми наклонными линиями). Ближайшие уровни поддержки и сопротивления на дневном графике: $59 930 и $72 174 соответственно.
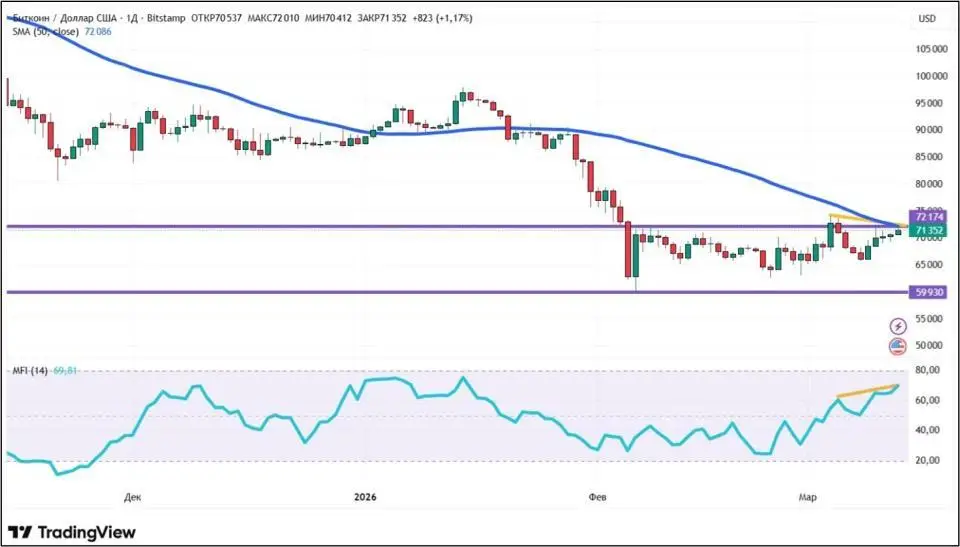
Источник: tradingview.com
Индекс страха и жадности по сравнению с прошлой неделей снизился на три пункта. Его текущее значение составляет 15. Это указывает на то, что в настроениях криптоинвесторов по-прежнему преобладает экстремальный страх.
Эфириум
Эфир с 6 по 13 марта показал более значительный рост по сравнению с биткоином, увеличившись на 6,7%. Это позволило ETH вновь подняться выше $2100. Недельное движение второй по капитализации криптовалюты довольно точно повторило путь BTC: первые две торговые сессии завершились снижением, а затем последовали пять с ростом.
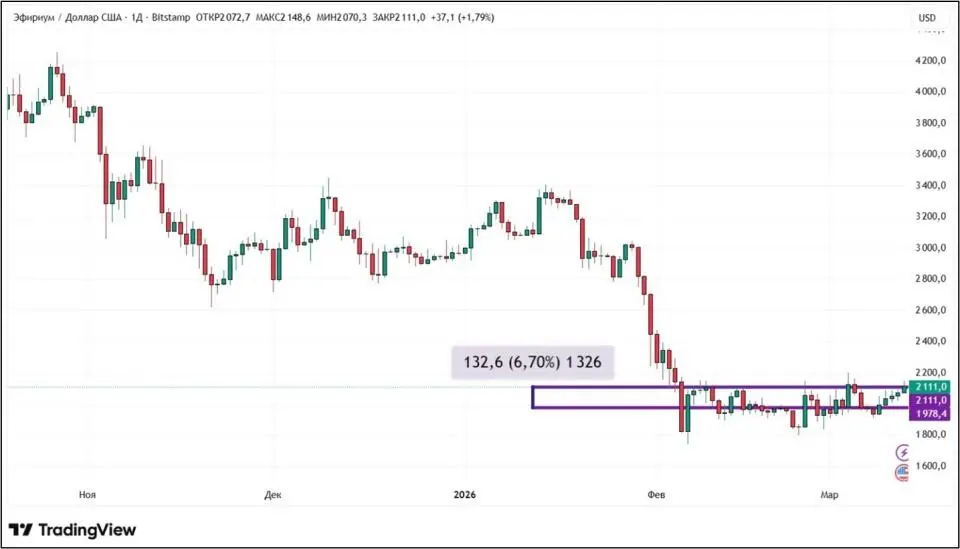
Источник: tradingview.com
Аналитики платформы Santiment сообщили, что эфир опережает биткоин и USDT в борьбе за аудиторию. В качестве аргумента эксперты приводят показатель кошельков с ненулевым балансом. Таковых в Эфириуме чуть меньше 183 млн. Показатель биткоина составляет 58,51 (менее чем в три раза меньше), а у основного стейблкоина Tether – 12,96 млн (менее чем в четырнадцать раз). Впервые ETH обогнал BTC по количеству ненулевых кошельков в 2019 году. За семь лет разрыв только увеличился.
В то же время аналитики другой платформы, CryptoQuant, поднимают вопрос о «парадоксе распространения» (adoption paradox). Эксперты заметили, что несмотря на рост таких показателей, как активные адреса и внутренние запросы смарт-контрактов, цена ETH падает. Конвергенция, наблюдавшаяся между сетевыми показателями и ценой, фиксировавшаяся на ранних стадиях развития эфира, прекратилась.
Как и в случае со спотовыми ETF на биткоин, аналогичные фонды на эфир зафиксировали третий подряд приток средств. Теперь он составляет $90,65 млн. Наиболее популярным среди инвесторов оказался фонд компании Fidelity, Fidelity Ethereum Fund (FETH), который был пополнен на $98,03 млн.
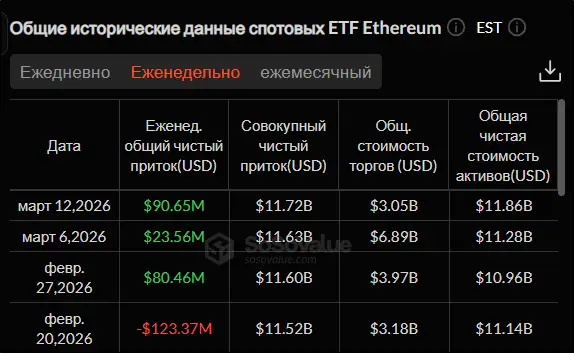
Источник: sosovalue.com
С точки зрения технического анализа, тренд эфира остается нисходящим. Это подтверждается тем, что цена находится ниже 50-дневной скользящей средней (обозначена синим цветом). Однако стоит отметить, что расстояние уже минимальное, что говорит о росте силы покупателей. В пользу быков свидетельствует и подъем индикатора RSI, который также превысил значение 50. Уровни поддержки и сопротивления на дневном графике пока остаются неизменными: $1741,8 и $2149,9 соответственно.
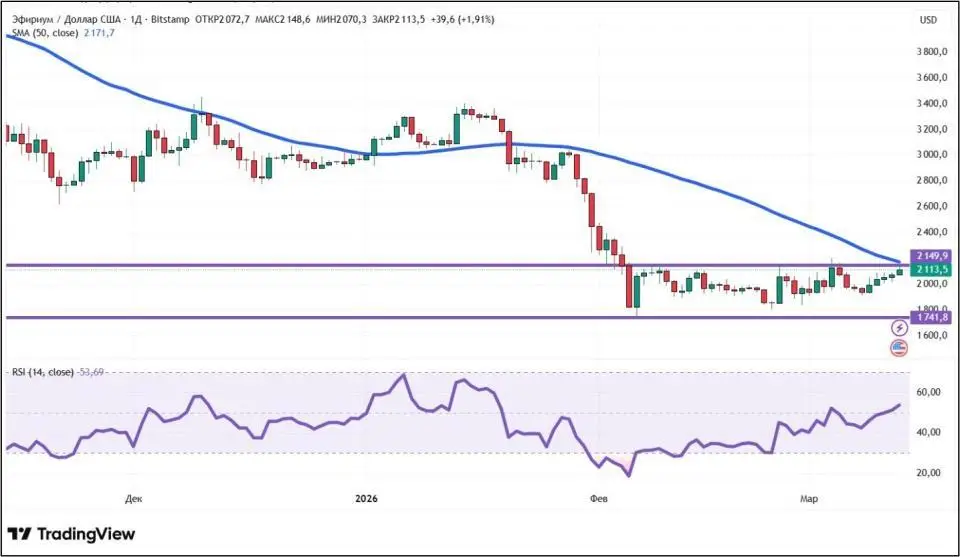
Источник: tradingview.com
Avalanche
Криптовалюта Avalanche с 6 по 13 марта показала рост на 9,67%. Токен AVAX обновил свой месячный максимум, достигнув $9,95 на торгах во вторник, 10 марта. Как и в случае с биткоином и эфиром, неделя для Avalanche началась с двух отрицательных сессий, за которыми последовали пять положительных.
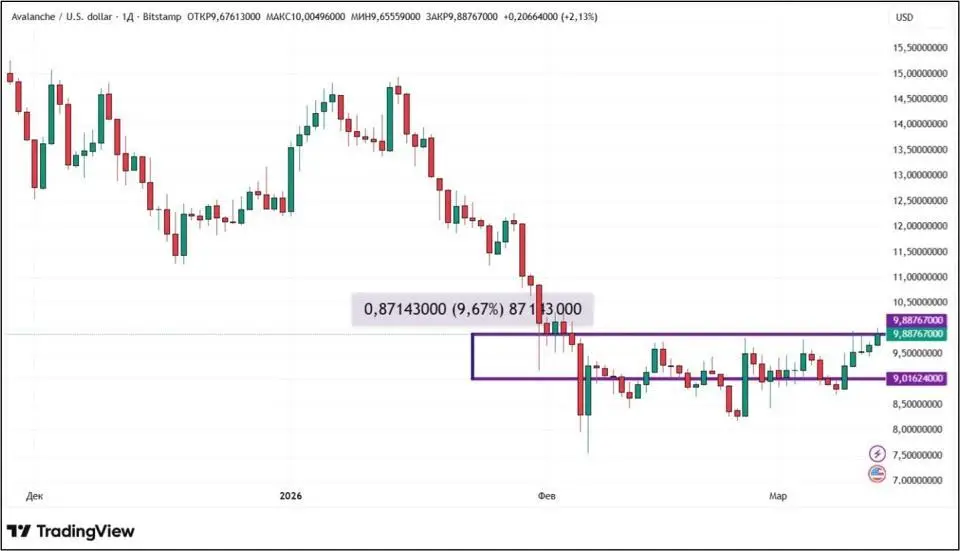
Источник: tradingview.com
Одной из ключевых новостей для AVAX стал запуск инвестиционной компанией Grayscale нового траста с функцией стейкинга — Grayscale Avalanche Staking Trust. Размещение его акций (паев) произошло на бирже Nasdaq под тикером GAVA. Фонд в основном ориентирован на корпоративных инвесторов, желающих инвестировать в цифровые активы, но предпочитающих более прозрачные рынки.
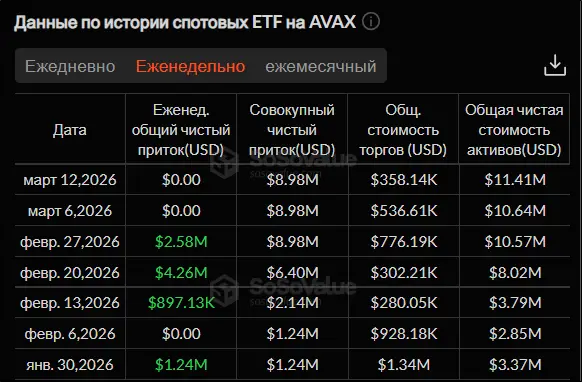
Единственный спотовый ETF на AVAX, VanEck Avalanche ETF (VAVX), второй раз подряд демонстрирует нулевую динамику. Это третий такой случай с момента листинга фонда в конце января 2026 года.
Источник: sosovalue.com
Технологическая компания Ava Labs, стоящая за Avalanche, официально присоединилась к недавно запущенной криптовалютной программе системы Mastercard. Совместно две организации будут работать над созданием продуктов, которые адаптируют специфику цифровых активов под современные платежные карты. Кроме Ava Labs, партнерами программы стали более 85 компаний, среди которых Circle, Polygon и Ripple.
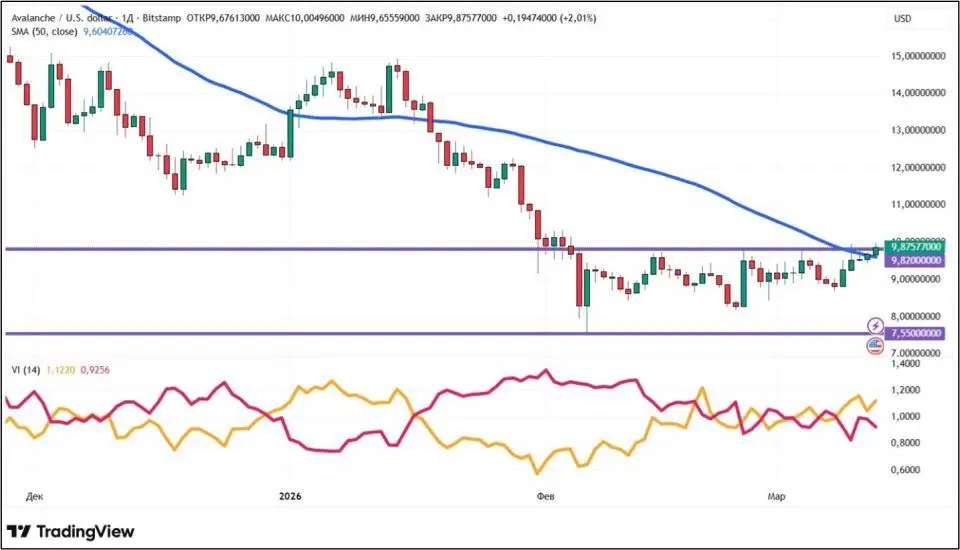
С точки зрения технического анализа, тренд Avalanche изменился с нисходящего на восходящий. Это подтверждается индикаторами. Цена превысила 50-дневную скользящую среднюю (отмечена синим цветом), а линия VI+ (оранжевая) индикатора Vortex расположена выше VI- (бордовой). Для дальнейшего роста Avalanche необходимо закрепиться выше уровня сопротивления $9,82, около которого сейчас и торгуется криптовалюта. Уровень поддержки составляет $7,55.
Источник: tradingview.com
Вывод
Крупнейшие криптовалюты с 6 по 13 марта продемонстрировали положительную динамику. Avalanche увеличилась в цене больше, чем биткоин и эфир. Увеличение стоимости было обусловлено отсутствием новых негативных новостей и сильными сетевыми показателями альткоинов.
Данный материал и информация в нем не является индивидуальной или иной другой инвестиционной рекомендацией. Мнение редакции может не совпадать с мнениями аналитических порталов и экспертов.
