Disclaimer: Information found on CryptoreNews is those of writers quoted. It does not represent the opinions of CryptoreNews on whether to sell, buy or hold any investments. You are advised to conduct your own research before making any investment decisions. Use provided information at your own risk.
CryptoreNews covers fintech, blockchain and Bitcoin bringing you the latest crypto news and analyses on the future of money.
Bitcoin BTC Spot CVD, or Cumulative Volume Delta, surged by 199.1% over the last week, increasing from $18.3 million to $54.8 million, indicating robust buying activity in the spot market. Concurrently, parallel perpetual CVD rose by 174.7% to $315.1 million, reinforcing the same upward pressure across both markets. ETF inflows are once again gaining momentum after a period of stagnation, providing a support layer that keeps Bitcoin above $78,000.
BlackRock’s IBIT experienced a gain of 1.33% in yesterday’s trading session as institutional demand for crypto displayed renewed vigor following a three-day phase of net outflows. This resurgence comes after a period where ETF outflows had negatively impacted spot liquidity.
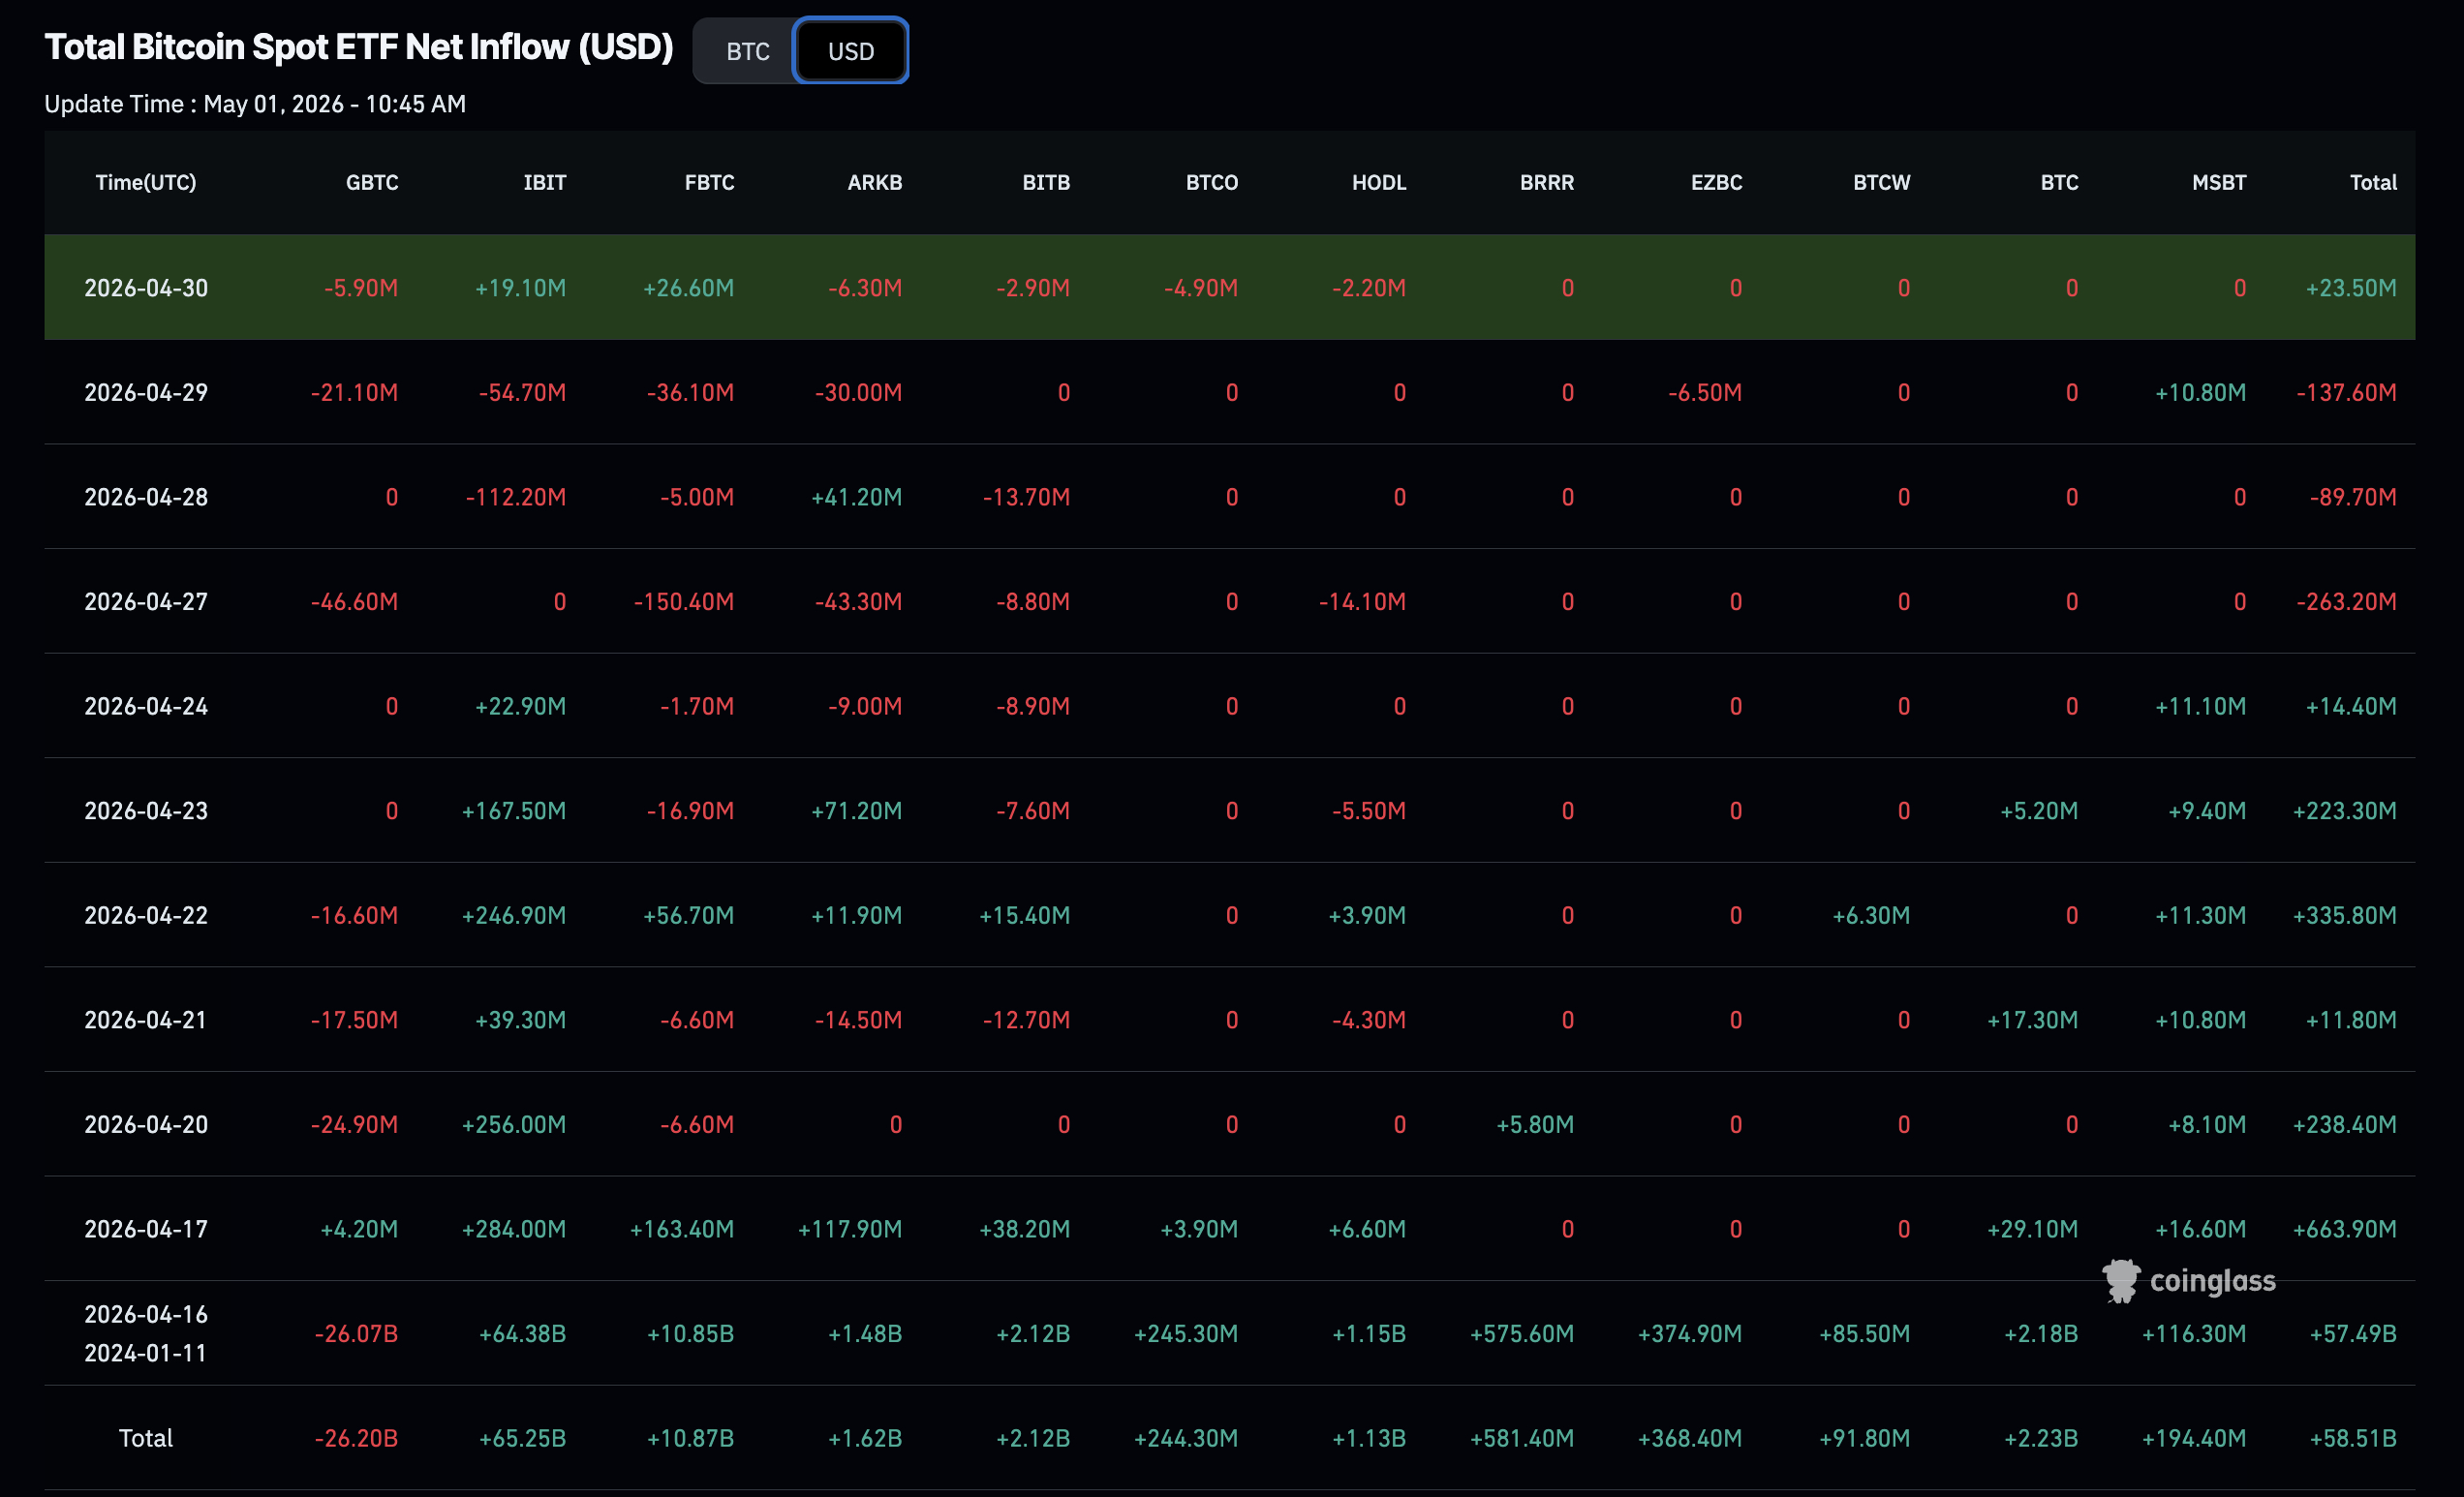 Bitcoin ETFs Flows, Coinglass
Open interest has rebounded to $25 billion, which Bernstein analysts noted as indicative of returning leverage. The spot-driven nature of this movement, confirmed by CVD composition, suggests that the current rally is based on different fundamentals compared to January’s futures-driven increase.
Explore: Bitcoin price prediction – key support and resistance levels to monitor
Can Bitcoin Finally Surpass $80K This May?
Bitcoin is currently positioned at $77,000 intraday after regaining this support level. CVD lines are maintaining their positions above moving averages, which serves as the minimum confirmation for bullish sentiment. The RSI is elevated but not yet at overbought levels, allowing for potential continuation.
 BTC/USDT daily chart with Spot CVD overlay – TradingView
If $75,000 holds on a weekly close, this structure paves the way for a move towards $80,000 and, beyond that, the $82,000 area identified by on-chain resistance clustering. Should $75,000 fail, the actual floor is nearer to $72,000. The risk scenario involves an open interest flush; $25 billion in OI with increasing leverage could trigger a liquidation cascade.
Related Posts
The objective assessment: the structure remains bullish as long as spot CVD remains positive and ETF inflows do not reverse. Monitor the weekly close.
Discover: The best pre-launch token sales
Wall Street Backdrop: Market Structure Turns Bullish
The macroeconomic environment is favorable. The Wall Street rally, fueled by strong earnings from Alphabet and Caterpillar, propelled U.S. equities into April’s close with positive momentum, and Bitcoin mirrored this trend, rising 1.17% in direct correlation with NASDAQ’s risk-on sentiment.
As observed, traditional fund managers are increasingly viewing BTC as a high-velocity proxy for high-beta tech exposure, tightening its correlation with equities in trending macroeconomic conditions.
BREAKING:
Nasdaq and S&P 500 have just reached a NEW ALL TIME HIGH.
US stocks have now added over $10 trillion in market cap in the last 30 days. pic.twitter.com/ipimnCw4S5— Bull Theory (@BullTheoryio) April 30, 2026
Bitcoin is now establishing higher lows, has reclaimed $77,000 as support, and is maintaining a bullish market structure. If equities continue their recovery leading up to the next FOMC decision, BTC’s macro tailwind remains intact and enhances the spot demand signal.
The combined analysis from CVD, ETF inflows, and on-chain transfer volume leads to one conclusion: this is a structurally supported movement, not merely a leverage fluctuation.
Discover: The best crypto to diversify your portfolio with
The post Bitcoin Spot CVD Surges 199% as Institutional Inflows Re-Accelerate appeared first on Cryptonews.