Disclaimer: Information found on CryptoreNews is those of writers quoted. It does not represent the opinions of CryptoreNews on whether to sell, buy or hold any investments. You are advised to conduct your own research before making any investment decisions. Use provided information at your own risk.
CryptoreNews covers fintech, blockchain and Bitcoin bringing you the latest crypto news and analyses on the future of money.
Bitcoin is currently stabilizing just under $70,000, with a significant event scheduled for this week that could influence the trend in either direction: the March CPI report set to be released on April 10 at 8:30 AM ET. The outcome is straightforward; if U.S. inflation figures are low enough to prompt a shift in Federal Reserve rhetoric towards rate cuts, BTC‘s $75K becomes an immediate target; conversely, if core CPI remains persistently above 0.3% month-over-month, the “higher for longer” narrative will reemerge, directing the price back toward the $60,000–$62,000 range.
The Cleveland Fed’s nowcast, based on late-March data, anticipates a 0.84% monthly headline increase, primarily driven by a 26.2% year-over-year rise in gasoline prices and a 50.4% increase in diesel prices. If this projection is validated, it would represent a significant acceleration from February’s 0.27% headline and effectively halt any discussions regarding a Federal Reserve pivot until at least mid-summer. Macro crypto trading desks are already factoring in two distinctly different scenarios into options flow. The CPI report on Thursday will determine which scenario prevails.
Bitcoin’s $75K Level: Comprehensive Technical Analysis and Price Scenarios
Bitcoin Price Outlook: Regain $75,000 or Decline to $60,000
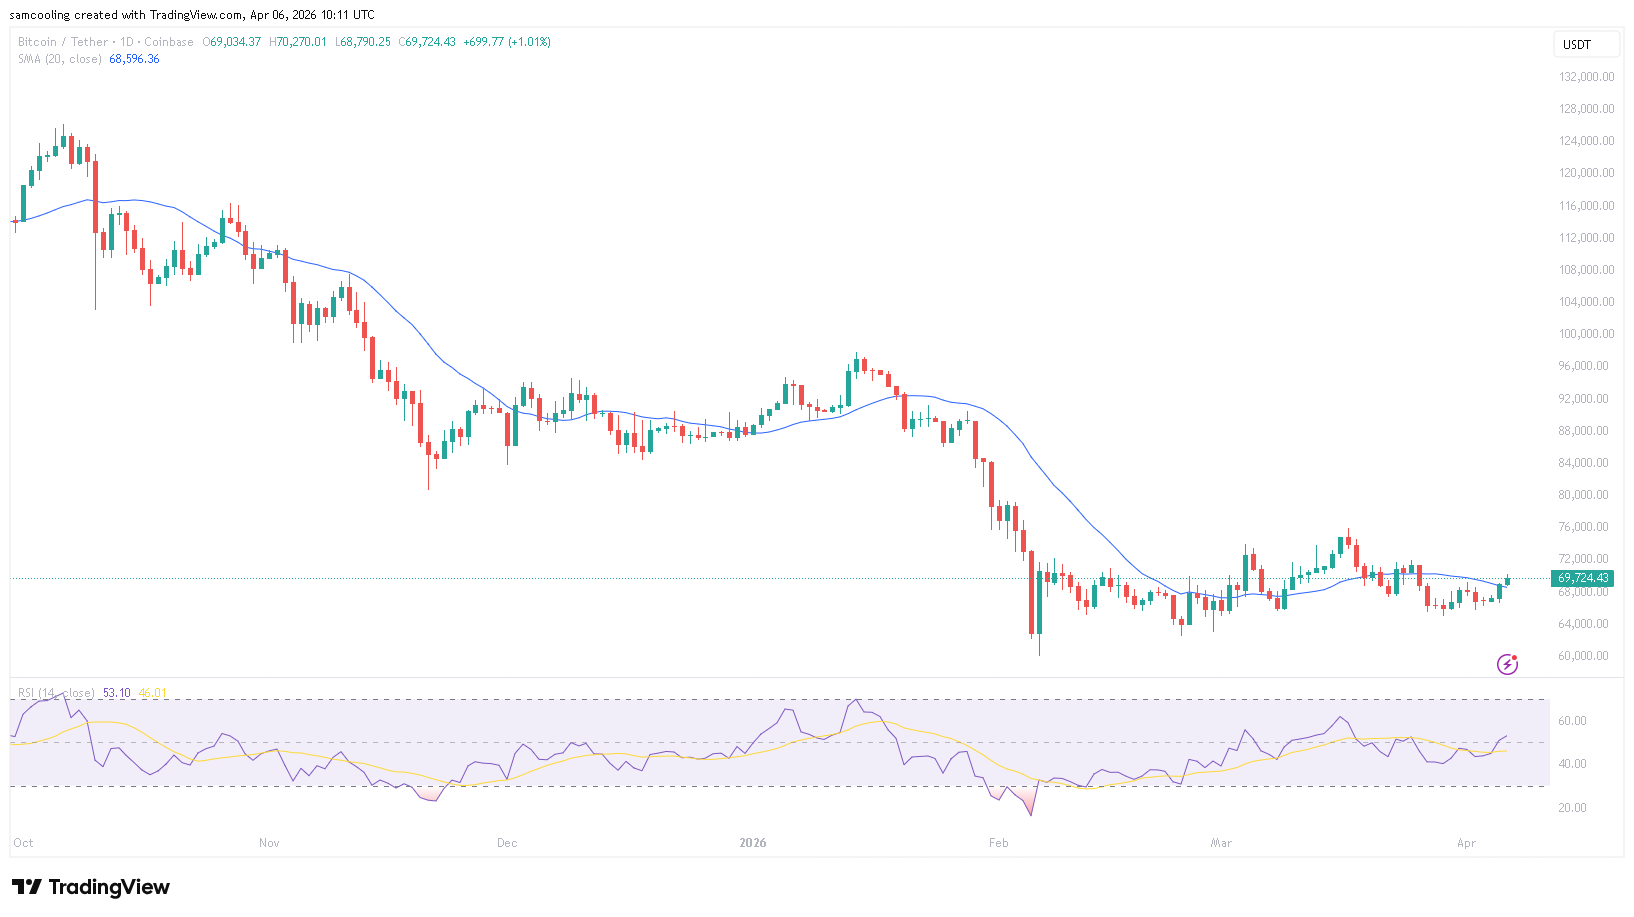
(Source – BTC USD, TradingView)
Bitcoin is presently trading within a range of $65,000 to $71,000, a compression zone that has persisted for several weeks and is coiling into what chart patterns indicate is a pivotal moment. The immediate overhead resistance is at the $73,700 level; above that lies the $75,000 psychological barrier, which has served as a critical support level since BTC’s last unsuccessful breakout attempt.
A weekly close above $75,000 on CPI-influenced volume would provide the first structural confirmation that the bullish scenario remains intact.
The daily RSI is currently around 53 – neutral, not oversold, indicating that no technical floor is being established solely from momentum exhaustion. The 200-day EMA is converging with the $67,500 support area, making this level crucial in the short term. A daily close below $67,500 would open the pathway to $62,000, where there is considerable order book depth and previous accumulation structure. The MVRV ratio remains below 1.5, indicating that the market has not yet entered the euphoria phase – but this also suggests that on-chain buying pressure is not yet strong enough to create self-sustaining momentum.
Related Posts
The bullish scenario necessitates a CPI-triggered risk-on movement through $71,000, followed by a reclaim of $73,700 on sustained volume, with $75,000 serving as the confirming close. The bearish scenario is activated by a strong CPI print: a rejection at $71,000 that leads to a decline through the 200-day EMA and targets the $60,000–$62,000 whale accumulation zone. For traders already in position, the downside scenario below $66,000 warrants careful risk assessment ahead of Thursday. The most critical level is $71,000. If it holds post-print, the bullish case remains viable. If it fails, $62,000 becomes the next significant support.
Why the April 10 CPI Report Resets the Fed Timeline – and Bitcoin’s Ceiling
The relationship between Bitcoin and CPI is not coincidental – it is systematic. CPI influences Fed rate expectations, which in turn affect the dollar and treasury yields, and a stronger dollar directly dampens institutional interest in risk assets, including BTC. February’s CPI was recorded at 2.4% year-over-year, with core remaining at 2.5% annually for the second month in a row, driven by a 0.2% increase in shelter costs. This persistence has kept the “higher for longer” stance as the prevailing Fed approach leading into April’s data cycle.
The key threshold for signaling a Federal Reserve pivot is a core monthly reading at or below 0.2% – any figure above 0.3% solidifies current policy and postpones the first rate cut. CME FedWatch currently anticipates fewer than two cuts for 2025, a significant adjustment from the four-cut consensus that was projected at the beginning of the year. Energy prices are the variable: the Cleveland Fed’s nowcast is largely influenced by spikes in gasoline and diesel, and historically, the Fed has tended to overlook volatile energy components when evaluating underlying inflation trends. If the headline figure is high but core remains stable, traders may view that as a conditional signal to proceed.
In March, payrolls increased by 178,000 jobs, with unemployment steady at 4.3% – a labor market that does not indicate an imminent recession, thus providing the Fed with justification to maintain its current stance. The U.S. inflation data release on April 10 will not only impact Bitcoin on that day; it will also recalibrate the entire timeline for rate cuts that institutional crypto positioning relies upon.

(Source – CoinGlass)
Spot Bitcoin ETF inflows from BlackRock’s IBIT and Fidelity’s FBTC have demonstrated a direct correlation with CPI results – a strong print would immediately tighten that inflow channel.
The post CPI Data Countdown: Why the April 10 Print Is Make or Break for Bitcoin’s $75K Push appeared first on Cryptonews.