Disclaimer: Information found on CryptoreNews is those of writers quoted. It does not represent the opinions of CryptoreNews on whether to sell, buy or hold any investments. You are advised to conduct your own research before making any investment decisions. Use provided information at your own risk.
CryptoreNews covers fintech, blockchain and Bitcoin bringing you the latest crypto news and analyses on the future of money.


Bitcoin (BTC) recovered its weekly closing losses on Aug. 28 as risk assets rallied following news of tax cuts in China.
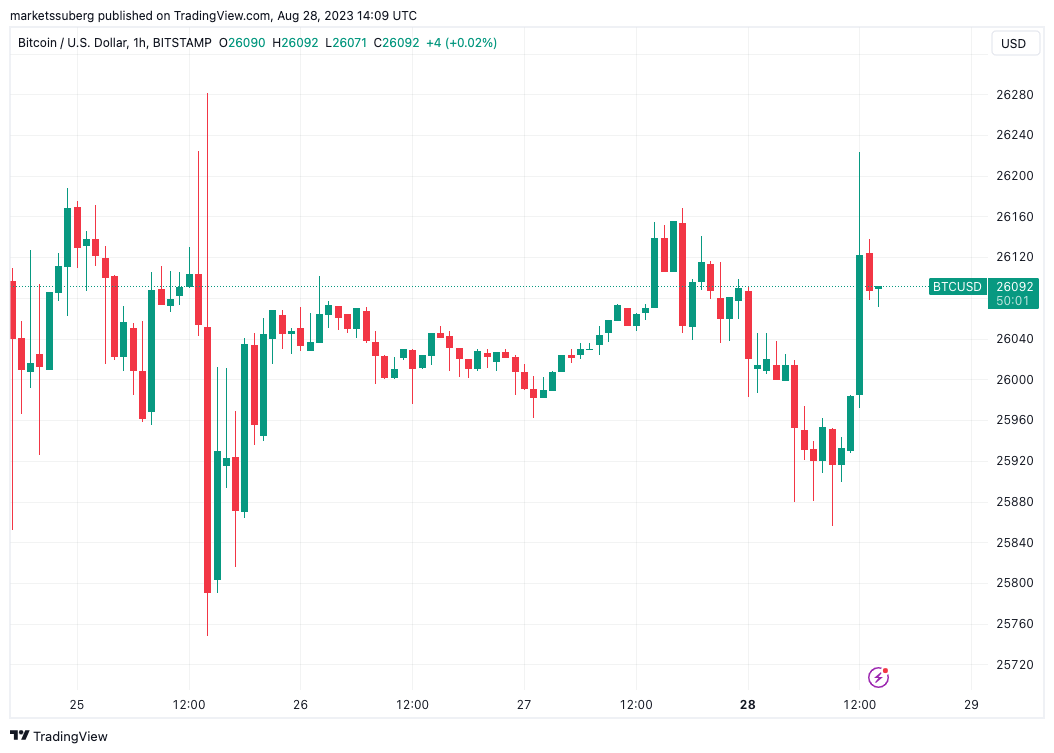
BTC/USD 1-hour chart. Source: TradingView
BTC price finds support at the 200-week EMA
Data from Cointelegraph Markets Pro and TradingView tracked a BTC price uptick leading into the Wall Street open.
BTC/USD reached $26,226, marking its highest level since Aug. 25 and fully offsetting the weakness observed overnight.
News that China had cut the tax on stock trading by 50% appeared to boost U.S. futures at the open. The S&P 500 and Nasdaq Composite Index subsequently opened up 0.6% and 0.7%, respectively.
$BTC is still in a 3-day composite but has shown signs of absorption below. I wish it was liquid enough like the ES or NQ to simply justify saying “Hold 26.1 and those singles at 26275 get cleaned up”
Strong drive off the open for stocks.
It’s Monday, so not looking to do anything… pic.twitter.com/6ObqBLIx5z— HORSE (@TheFlowHorse) August 28, 2023
Looking at the trading landscape for the coming week, Michaël van de Poppe, founder and CEO of trading firm Eight, identified the 200-week exponential moving average (EMA) at approximately $25,700 as a critical support zone to defend.
“First of all, the 200-Week EMA lies beneath us. It’s at $25,650 (Bitstamp) or $24,750 (Binance). The conclusion is, you don’t want to drop beneath that level and you’d preferably want to mimic the 2015-2016 sideways period,” he wrote in part of a post on X (formerly Twitter).
“If the 200-Week EMA sustains, conclusions are that we’re bottoming out here and we are potentially getting a massive entry point. If it’s lost, I’d be looking at a case of $19,500-21,500 as the next big entry point and final capitulation. On the lower timeframes and over the week, it’s still possible to sweep below the 200-Week EMA. As long as we don’t lose the level.”
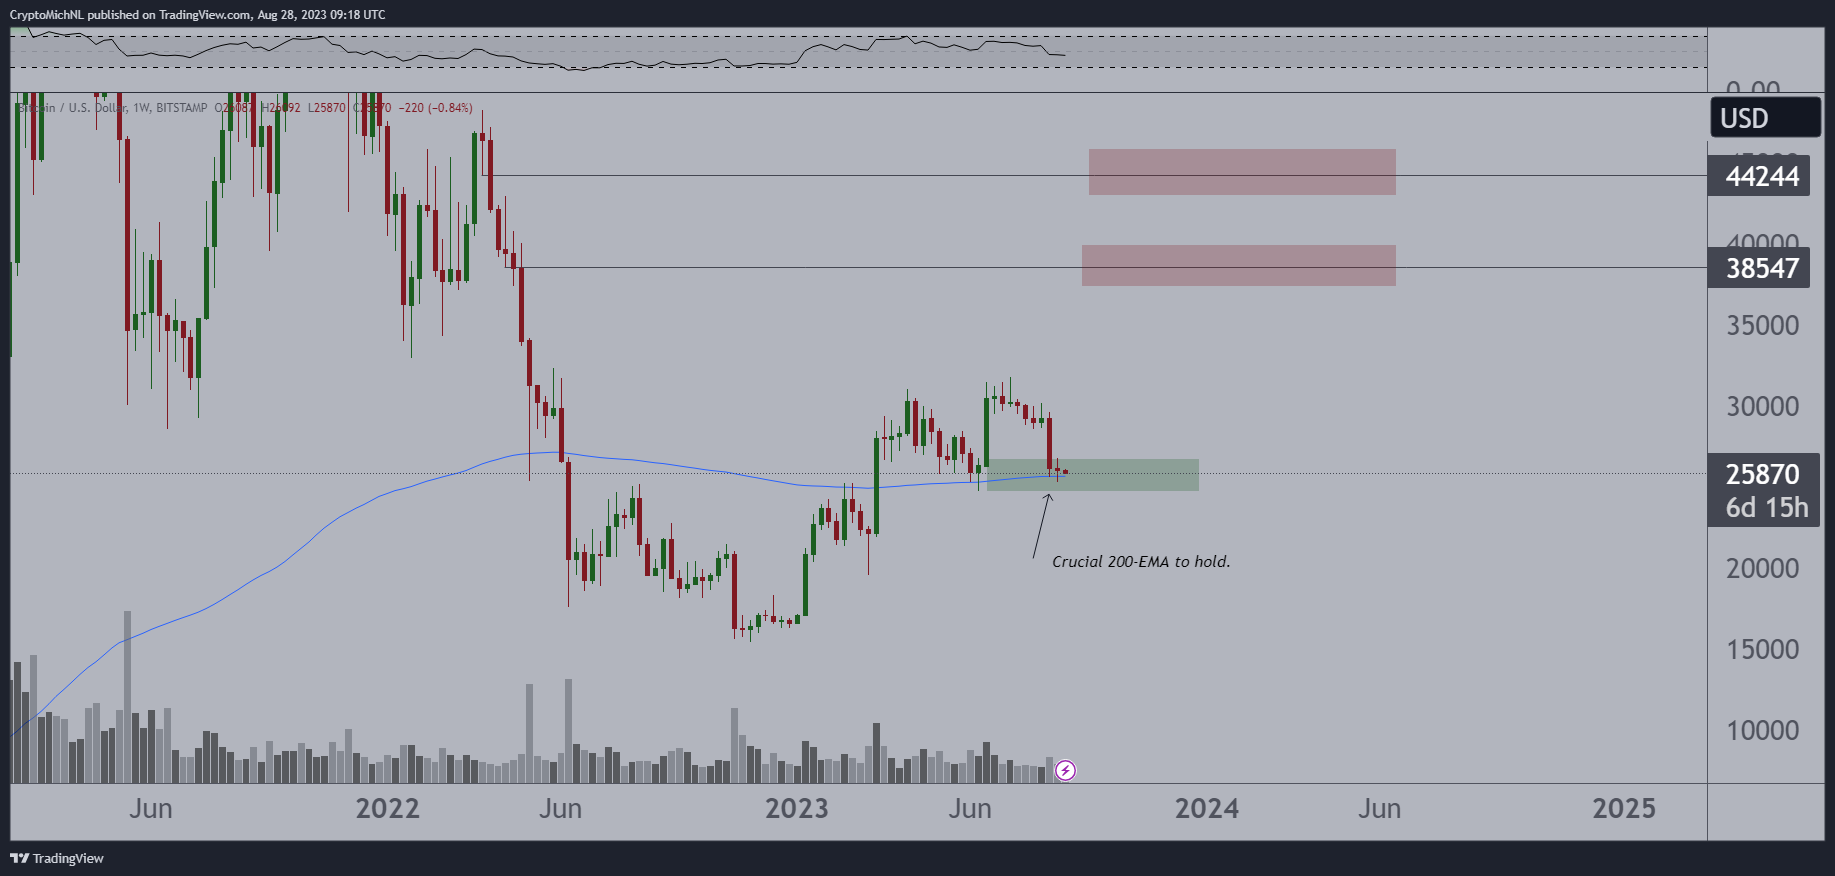
BTC/USD annotated chart. Source: Michaël van de Poppe/X
Van de Poppe further noted that order book liquidity likely resides below the 200 EMA.
“In that regard, a sweep of that area is the most likely outcome,” he wrote.
“Two strategies can be deployed: 1 – Sweep at $25,750 for an aggressive long entry towards the other side of the range (entry can only be taken after the sweep and when $25,750 is reclaimed). 2 – Sweep of $25,200 towards $24,700-25,000 (the 200-Week EMA on Binance) and bullish divergences on higher timeframes. That’s the golden trade and could be the start of a reversal. However, $25,750 should be reclaimed in the bounce, otherwise this trade could be invalid/stopped out.”
Related Posts
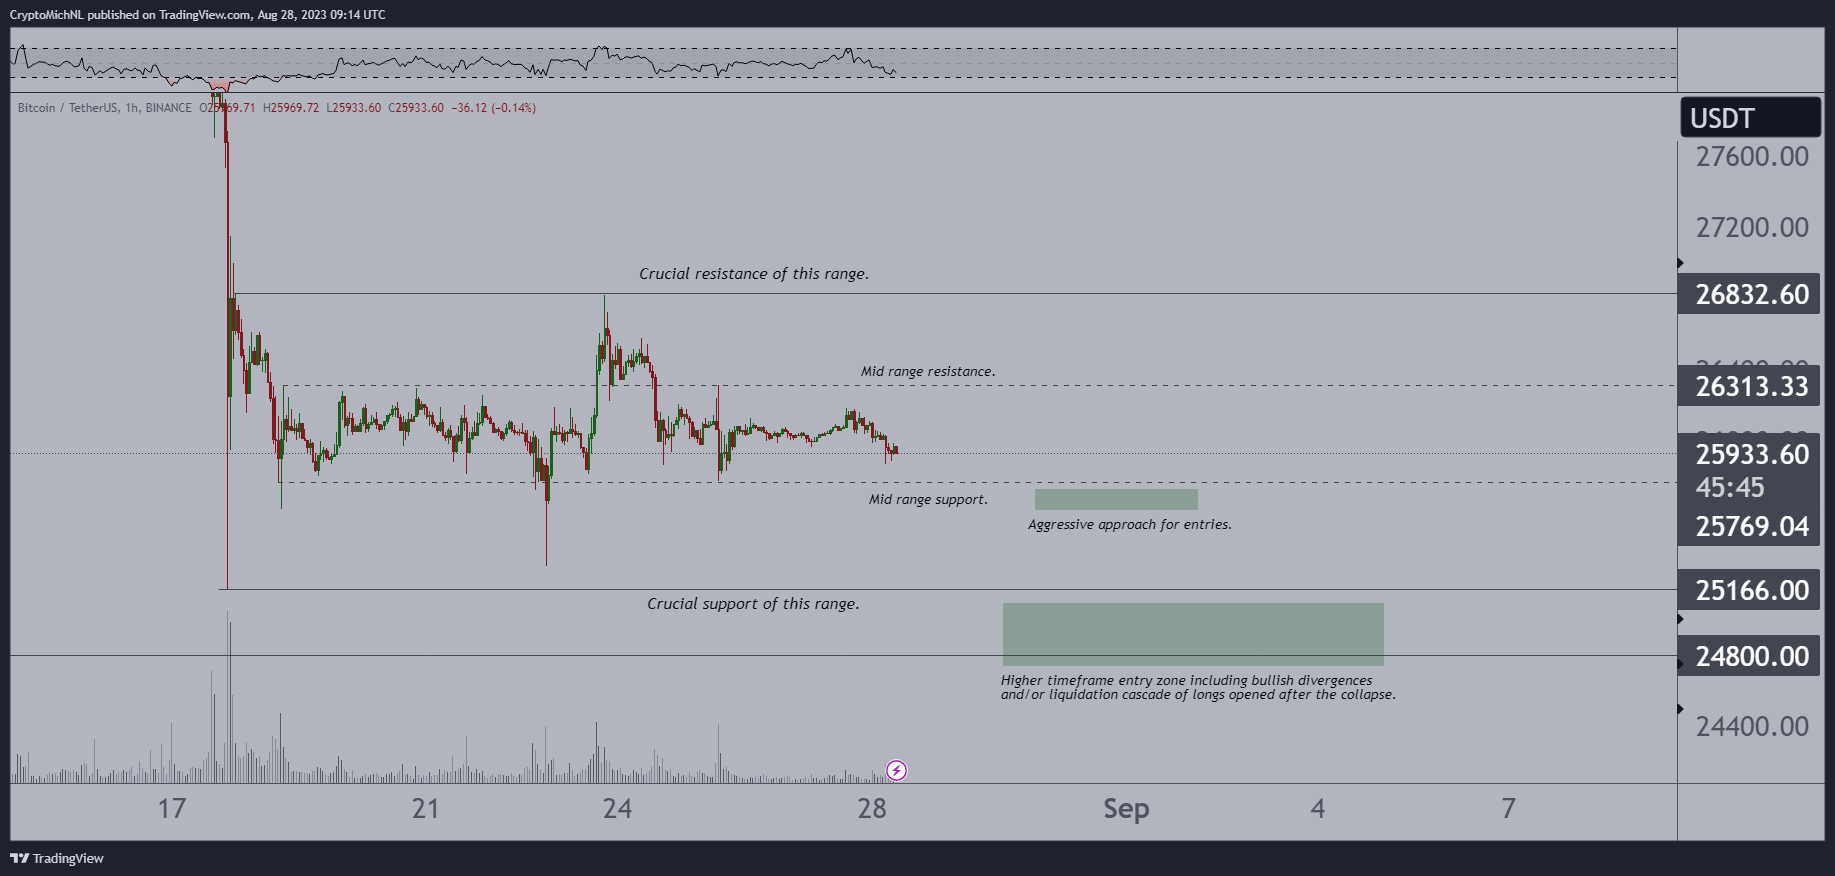
BTC/USD annotated chart. Source: Michaël van de Poppe/X
Popular trader Titan of Crypto simultaneously highlighted $25,900 as a prominent zone of interest.
“$25,900 is the level to watch,” he summarized in part of his X analysis.
#Bitcoin $25,900 is the level to watch
Kijun at $25.9k supported the #BTC price once more on the weekly timeframe. That’s the level to watch.
If it holds, I won’t be surprised to see a pullback to Tenkan at around $28.4k. pic.twitter.com/VDcJQczDwc— Titan of Crypto (@Washigorira) August 28, 2023
Bitcoin RSI remains “very low” for a second week
Elsewhere, fellow trader Pheonix referenced persistently low levels on Bitcoin’s relative strength index (RSI) on lower timeframes.
Related: September ‘crash’ to $22K? — 5 things to know in Bitcoin this week
As Cointelegraph reported, depending on the timeframe in question, these levels reached lows not seen in five years following the 10% BTC price dip ten days ago.
“RSI still very low, for 1.5 weeks already now,” part of their X commentary on Aug. 28 read.
“7/8 times it went below 25 the last years, corresponded to the (local) bottom & a 30% minimum rise followed.
Further analysis showed that the one exception to this rule occurred in September 2019.
#Bitcoin RSI still very low, for 1.5 weeks already now
7/8 times it went below 25 the last years, corresponded to the (local) bottom & a 30% minimum rise followed
Most often $BTC gained more % in value
1 fail: Sep ’19
4 local bottoms: Nov ’19, May ’21, Jan ’22 & June ’22… https://t.co/2yNxDStkD8 pic.twitter.com/PA4nVJkdTB— Phoenix (@Phoenix_Ash3s) August 28, 2023
The RSI attempts to measure when an asset is overbought or oversold at a given price point.
This article does not contain investment advice or recommendations. Every investment and trading move involves risk, and readers should conduct their own research when making a decision.
