Disclaimer: Information found on CryptoreNews is those of writers quoted. It does not represent the opinions of CryptoreNews on whether to sell, buy or hold any investments. You are advised to conduct your own research before making any investment decisions. Use provided information at your own risk.
CryptoreNews covers fintech, blockchain and Bitcoin bringing you the latest crypto news and analyses on the future of money.


Bitcoin traded at $63,030 on June 18, down approximately 2% for the day, after whipsawing from an intraday high of $64,731 to a low of $62,263 while oil prices fell and ships resumed movement through the Strait of Hormuz for the first time in weeks.
On June 19, Bitcoin continued its weak performance, approaching $62,450 as of press time.
The US-Iran Islamabad Memorandum of Understanding, signed by President Donald Trump and submitted to Congress on June 18, commits Iran to ensuring safe commercial passage through the Strait of Hormuz for 60 days, while the US agrees to fully end its naval blockade on Iranian ports within 30 days.
Three Saudi-flagged supertankers carrying 6 million barrels of crude sailed through the Strait hours after Trump signed the agreement, with vessels broadcasting their positions again after weeks of concealing their voyages.
Brent crude touched its lowest level since before the war began on February 28, settling near $79.85, while WTI settled at $76.60. The Strait handles roughly 20% of the global oil supply, and for the first time since the conflict began, that critical supply lane was open.
Lower oil prices reduce the risk of another energy-driven inflation impulse. In a standard macroeconomic sequence, this eases inflation expectations, puts downward pressure on yields, and makes long-duration risk assets more attractive to rate-sensitive positioning.
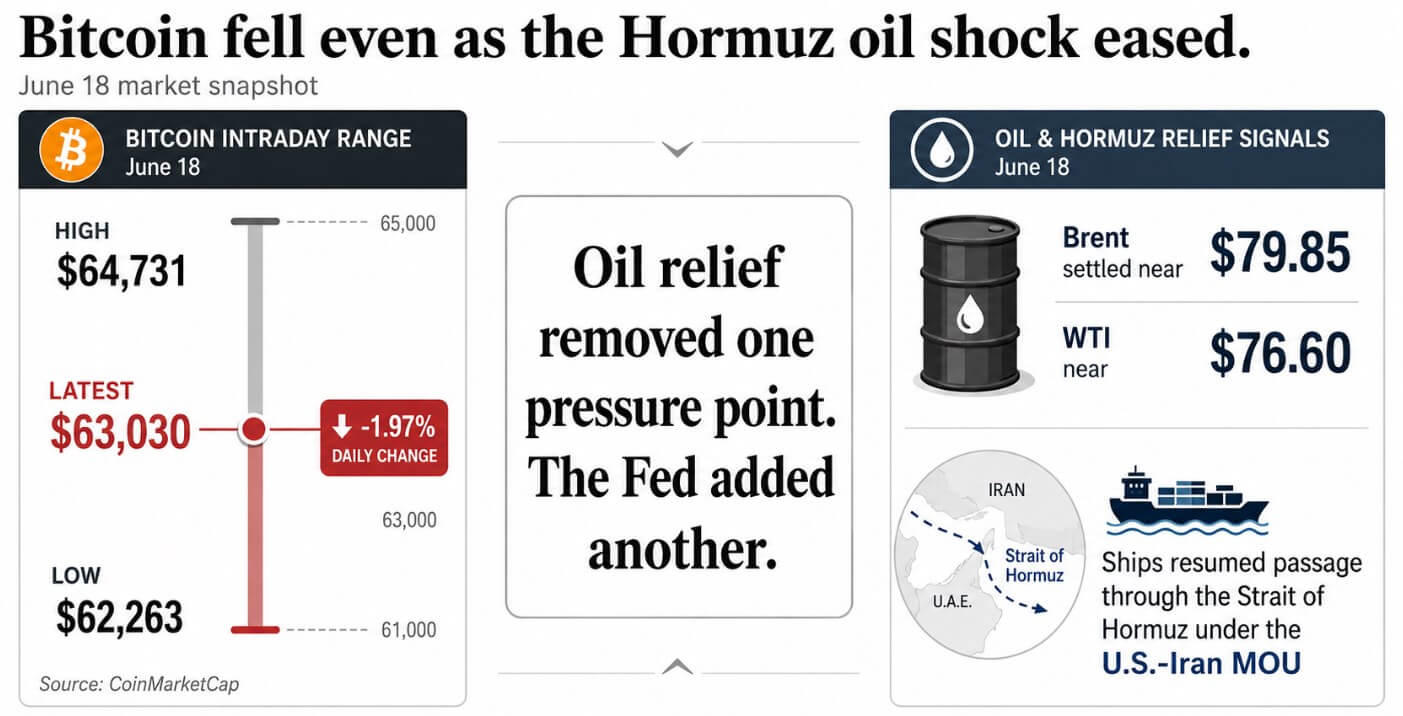
A June 18 snapshot showing Bitcoin’s $62,263–$64,731 intraday range alongside Brent and WTI settlements and ships resuming Hormuz passage under the US-Iran MOU.
The Fed repriced what oil cannot fix
The Federal Open Market Committee (FOMC) held its target range at 3.50%-3.75% on June 18, but the dot plot was hawkish enough to overwhelm the positive oil signal.
Reports indicated that 9 of 18 Fed policymakers now expect at least one rate hike this year, up from zero in March, with 6 of those 9 projecting more than one 25-basis-point increase.
The Fed’s median year-end PCE inflation forecast rose to 3.6% from 2.7% in March, and the statement noted that inflation remains elevated relative to its 2% goal, stating that the Committee “will deliver price stability.”
The FOMC cited supply shocks, including energy, indicating that the Fed is not yet treating the drop in oil prices as a solved problem.
The US dollar index hit a one-year high of 100.80 following the Fed’s statement, with Fed funds futures pricing in a 68% chance of a rate hike by September.
Bitcoin’s price action on June 18 saw the Hormuz deal remove one pressure point, while the Fed reintroduced a larger one, pushing BTC lower.
| Macro channel | What happened | Usual BTC effect | June 18 read |
|---|---|---|---|
| Hormuz / oil | Safe-passage MOU, ships moving, oil lower | Bullish: reduces inflation shock risk | Helped sentiment, but not enough |
| Fed rates | Target held at 3.50%-3.75% | Neutral on headline | Hawkish because dots shifted |
| Dot plot | 9 of 18 officials see at least one hike | Bearish for liquidity assets | Repriced rate path tighter |
| Inflation forecast | Year-end PCE forecast rose to 3.6% from 2.7% | Bearish if it delays easing or implies hikes | Fed still sees inflation problem |
| Dollar | DXY hit 100.80 one-year high | Bearish for BTC | Tightened global liquidity |
| Fed funds futures | 68% chance of hike by September | Bearish for risk duration | Overwhelmed oil relief |
Lower oil prices today do not erase the inflation and rate-risk damage already embedded in the Fed’s policy path. Policymarkers marked inflation higher, nearly half see a hike coming, and the dollar is at a one-year high.
Related Posts
Cheaper energy helps at the margin, but the Fed’s own forecasts keep the rate-hike threat alive, with policymakers signaling hikes if inflation stays above target.
What the shipping data actually shows
Shipping and insurance officials remained cautious after the deal, and the Lloyd’s Market Association warned that conditions approaching normal could take months.
Mine-clearance operations in the Strait are incomplete, and the 60-day MOU timeline means the reopening is conditional.
This feeds directly into how Bitcoin trades the Hormuz channel going forward. If the MOU holds and Brent keeps falling toward the mid-$70s, the disinflationary impulse becomes harder for the Fed to ignore.
Fed funds futures would reprice, the dollar would lose the rate-differential support that had pushed it to 100.80, and Bitcoin would have a more direct path toward recovery.
The war-risk premium that has weighed on risk assets since late February would genuinely deflate.
Where the rate path takes Bitcoin
If oil continues to fall and shipping normalization accelerates faster than Lloyd’s and industry officials expect, the disinflationary signal will eventually feed into the Fed’s inflation forecasts.
Hike odds will recede, the dollar will soften from its one-year high, and Bitcoin can reclaim the $65,000-$68,000 range as traders reprice the rate path rather than the war risk.
The Hormuz deal would have done what relief trades are supposed to do; it would just have taken longer than one session to show up in the macro variables the Fed watches.
If Fed hike odds keep climbing and the dollar extends its breakout above 100.80, Bitcoin faces pressure that oil relief cannot offset.
| Scenario | Trigger | Bitcoin implication | Key level / signal to watch |
|---|---|---|---|
| Bull case: oil relief becomes liquidity relief | Brent keeps falling toward mid-$70s, shipping normalization accelerates, inflation expectations cool | BTC can reclaim the $65K-$68K range | Softer dollar, lower hike odds, Brent sliding further |
| Base case: Fed wall caps recovery | Oil stays lower but Fed hike odds remain elevated | BTC chops around the low-to-mid $60Ks | DXY near 100.80, BTC struggling to hold $63K-$65K |
| Bear case: Fed pressure dominates | Hike odds climb, dollar breaks higher, BTC loses $62K cleanly | $60K area comes back into view | DXY breakout, September hike odds rising |
| Risk case: Hormuz relief reverses | MOU frays, shipping slows, insurance risk rises again | BTC faces both oil shock and Fed shock | Brent spike, tanker delays, renewed Strait risk |
A clean break below $62,000 on persistent dollar strength and rising rate expectations would put the $60,000 area back in view, because the macro traders driving that move would be responding to the Fed’s rate path.
June 18 confirmed that geopolitical news improved, oil fell, ships moved, and BTC still broke lower. The asset is pricing in dollar strength, rate expectations, and whether cheaper oil shows up fast enough in inflation data to stop the Fed from validating the new hike dots.
Until that sequence completes, Bitcoin can receive good geopolitical news and still close the day lower.
The post Why Bitcoin fell below $63K after the oil shock finally eased appeared first on CryptoSlate.
