Disclaimer: Information found on CryptoreNews is those of writers quoted. It does not represent the opinions of CryptoreNews on whether to sell, buy or hold any investments. You are advised to conduct your own research before making any investment decisions. Use provided information at your own risk.
CryptoreNews covers fintech, blockchain and Bitcoin bringing you the latest crypto news and analyses on the future of money.
Bitcoin’s value rises to a four-week peak, surpassing several resistance thresholds in a matter of hours, with attention on the $77,000 mark.
Bitcoin reclaims $71.5k and pushes through the old ATH band, now the market has to prove it can hold there
Over the past 24 to 48 hours, Bitcoin accomplished what the market had consistently struggled to achieve in the early part of the year. It surpassed the $71,500 barrier, regained $72,000, and subsequently began trading within a previous resistance range of $73,500 to $73,800.
According to the latest 30-minute data, Bitcoin was trading around $74,485 after reaching an intraday peak close to $74,947. This positions the market approximately 5.2% higher over the last 24 hours and about 4.1% higher over the past 48 hours, with the short-term range fluctuating between roughly $70,685 and $74,947 during the previous day.
![]() #1 Bitcoin BTC $74,409.00 +4.92% Market Cap $1.49T 24h Volume $55.34B All-Time High $126,198.07 Sectors Coin Layer 1 PoW
#1 Bitcoin BTC $74,409.00 +4.92% Market Cap $1.49T 24h Volume $55.34B All-Time High $126,198.07 Sectors Coin Layer 1 PoW
This progression aligns with my channel analysis that has outlined Bitcoin’s structure since 2024.
 Related Reading
Bitcoin channel predictions align with market movements over 6 months
Examining Bitcoin’s support at $49k and resistance at $61k through basic trading channels.
Aug 20, 2024 · Liam 'Akiba' Wright
In my initial article, Bitcoin channel predictions align with market movements over 6 months, the premise was clear. Bitcoin often adheres to recurring horizontal zones as negotiation areas rather than mere price points.
Above the all-time high of $73.7k, these could represent new resistance levels to monitor, with the next steps outlined in advance, as the market is anticipated to encounter resistance around $77,056 and subsequently $78,959 once it enters price discovery above the previous high.
My subsequent analysis revisited the same ladder from the opposite perspective. Bitcoin’s failure to break $71,500 on seven occasions is significantly more concerning than the unremarkable sideways movement that treated $71,500 as a pressure point, while Bitcoin price next move: $92k or $79k? Let’s break it down presented the same upward ladder, starting with $71,500, followed by $72,000, and then the $73,500 to $73,800 range.
The latest movement has now propelled the price through that entire stack.
The change in short-term structure is evident. The market still needs to demonstrate acceptance above the previous all-time-high area, yet the focus has shifted. The critical question now is whether Bitcoin can utilize $73,518 and $73,764 as support, as this pair delineates the lower and upper bounds of the immediate channel that the price is attempting to occupy.
If that area holds, the next significant test lies at $77,056, with $78,959 above it. Should the market slip back through that range, then $72,017 and $71,523 will re-emerge as the initial lower levels that must absorb the pullback. Beneath them, the older support channels at $67,995 and $66,894 will come back into focus.
This is the framework provided by the market. Bitcoin has ascended the precise resistance ladder that shaped the previous analysis.
The immediate task is no longer about reclaiming $71.5k. Whether the market can sustain itself above the former ceiling long enough to convert a breakout into a base could determine if the market has reached a bottom or if further declines are imminent.
Repeated resistance has turned into a support test
The short-term chart illustrates the clearest aspect of the movement. Bitcoin spent the earlier phase pushing against resistance, failing, retreating, and then attempting again. This is what made the $71,500 ceiling so crucial in February and March.
The level had become the upper limit of a market that could bounce but could not secure follow-through. Each failure increased the pressure on lower support, particularly as momentum appeared to weaken with each retest.
The market had sufficient buying interest to hold together, while conviction remained too shallow to generate sustained expansion.
This behavior is why the current surge should be regarded as a structural shift rather than just a typical positive day.
The price moved from the low $70,000s, surpassed $71,523, reclaimed $72,017, and then began trading above the $73,518 to $73,764 zone that had previously served as the upper resistance pocket.
This sequence is significant because the market frequently reveals its intentions through the order in which it clears levels.
Bitcoin did not jump directly into open space. Instead, it navigated through the same ladder that had constrained previous rallies. Each successful reclaim alleviated the burden on the next level and increased the likelihood that the market would at least probe the next channel higher.
The current structure can be organized into layers. The first layer is the reclaimed support band at $73,518 to $73,764. This is the zone that must hold during any near-term retracement. The second layer is at $72,017 and then $71,523.
These are the initial supports that would define a healthy reset versus a failed breakout. If Bitcoin loses the upper band, dips into $72,000, and then rebuilds, the move remains constructive. If it slices back through $71,500 and begins trading below it again, the breakout phase would appear increasingly fragile.
The upside is similarly clear. Above the current range, the next channel top is at $77,056, followed by $78,959. These are the next historical resistance levels identified through the same framework that mapped the previous all-time-high region. This is why the movement into the mid-$74,000s carries significance beyond a mere percentage increase.
Bitcoin is now negotiating within a zone that previously rejected price. If buyers can maintain the market above the old ceiling, the path toward $77,000 and then the upper $78,000s becomes the next logical step.
This is also where the broader cycle analysis aligns with the shorter-term chart. In It’s foolish to pretend Bitcoin’s story doesn’t include $79k this year, the argument was that $79,000 remained part of the plausible operating range once Bitcoin secured its position above the prior high. This perspective was based on the notion that once one channel breaks, the market typically seeks the next one. The current setup reintroduces that logic.
Related Posts
Bitcoin has not yet reached $77,056, nor has it tested $78,959, but it has finally laid the groundwork that makes those levels relevant once more.
Oil, inflation, and equities are still shaping Bitcoin’s short-term range
Bitcoin’s breakout attempt is occurring within a broader macro environment that remains highly responsive to energy prices and risk appetite.
This context helps clarify why the composite view of Bitcoin, the S&P 500, and oil has been valuable over the last several sessions. Bitcoin’s rally has unfolded alongside stronger equity pricing and a pullback in crude following the latest oil spike. The three charts are moving through the same macro sequence, even if each expresses it differently.
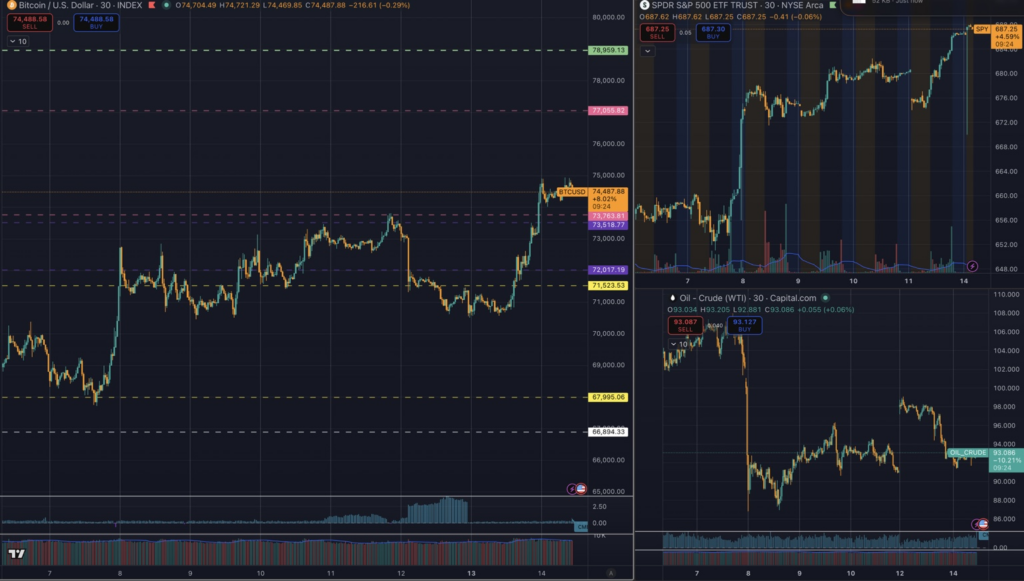 Bitcoin price rising sharply from a lower range into the low $70,000s, with several horizontal dashed support and resistance levels, colored price labels on the right axis. The top-right panel shows the SPDR S&P 500 ETF trending higher in a stair-step move with intraday swings. The bottom-right panel shows crude oil futures falling steeply before stabilizing sideways near the lows.
The macro progression has been quite straightforward. Oil prices surged after the U.S. announced it would block Iranian ports, with traders also reacting to renewed tensions around the Strait of Hormuz. This move pushed Brent above $100 before prices eased as diplomatic efforts resumed, according to The Guardian.
Simultaneously, March inflation data illustrated how quickly energy can influence the broader economy. U.S. CPI increased by 3.3% year over year, while core CPI rose by 0.2% month-over-month and 2.6% year-over-year, a softer core outcome than many anticipated.
 Related Reading
US inflation soars to 3.3% in largest jump since 2021 – so why did Bitcoin barely move?
A hotter-than-expected CPI report typically impacts risk assets. Bitcoin barely budged, raising new questions about what the market had already priced in.
Apr 10, 2026 · Liam 'Akiba' Wright
This combination created a mixed but tradable environment for risk assets. Headline inflation remained high due to energy, while core inflation provided markets with room to argue that the shock had not yet evenly permeated the underlying data.
Equities reacted accordingly. Risk sentiment improved as oil prices retreated from their highs, allowing Bitcoin to rise alongside the broader market rather than behaving as an isolated crypto event.
Recent CryptoSlate analysis on April’s historic gains had already framed the environment as a relief rally linked to easing geopolitical pressures, while that improvement was still tentative at the beginning of the month.
This is why the latest Bitcoin movement should be viewed as both technical and macro. The technical aspect is evident in the manner in which the price navigated through the channel ladder. The macro aspect is apparent in the timing. Oil prices softened, equities regained strength, and Bitcoin responded as a high-beta risk asset with robust internal structure.
This creates a balanced setup rather than a one-sided conclusion. If oil prices rise again and overall risk appetite diminishes, Bitcoin could decline even with a constructive chart. Conversely, if oil remains contained and equities stay strong, Bitcoin has the potential to continue testing the upper part of the current channel map.
There is another reason this backdrop is significant for Bitcoin specifically. The asset has spent much of 2026 behaving like a market eager to rally whenever macro pressures ease, though it has also demonstrated that it can be pushed back into lower channels when the external environment tightens.
In my November 2025 piece, Bitcoin price next move: $92k or $79k? Let’s break it down, the central idea was that Bitcoin tends to oscillate between scenario ladders rather than following a smooth trend.
The same reasoning applies now. Macro factors are influencing which ladder the market can access, while the channels delineate where the price is likely to negotiate once it arrives.
Acceptance above $73.5k to $73.8k would keep $77k and $79k in view
Bitcoin has already completed the first part of the task by moving past the old ceiling and entering the previous all-time-high pocket. The next part is less dramatic but far more crucial for traders trying to ascertain whether this move has depth.
The price needs to continue operating above $73,518 and $73,764, as this range is where previous resistance should start to function as support. Markets that break out and maintain levels above the former ceiling typically attract the next wave of buyers. Conversely, markets that break out and then quickly fall back through the ceiling often revert to a more defensive stance.
This positions $77,056 as the next clear upside target. It represents the next major channel on the chart and is situated just below the broader upper band leading toward $78,959. These levels are where the next supply test is likely to emerge.
If Bitcoin reaches them swiftly, the market will have covered a significant amount of ground in a short time. If it approaches them more gradually while consistently holding the newly reclaimed support, that would arguably indicate a healthier pattern.
A market that builds a base beneath resistance generally has more capacity to continue than one that rushes from one ceiling to the next without pausing.
The downside thresholds are equally clear. A retreat to $72,017 would still align with a constructive reset, especially if buyers appear there. A deeper move toward $71,523 would bring the previous battleground back into focus and compel the market to demonstrate that the breakout was more than a fleeting overshoot.
Below that, the framework becomes less accommodating, with $67,995 and $66,894 re-emerging as the stronger lower supports that characterized earlier phases of the range.
Bitcoin has transitioned from reclaim mode into acceptance mode. The breakout has structure, the channel framework remains intact, and the broader macro environment has shifted sufficiently to provide the move with momentum.
The next threshold is near $77,056, followed by $78,959. Between here and there, the essential task is straightforward: maintain the old resistance pocket and continue to demonstrate that $73.5k to $73.8k has become the new floor. If Bitcoin can achieve this, the path toward $77k and subsequently $79k remains open.
If it cannot, the market will swiftly revert to the earlier ladder and compel traders to reevaluate whether this was a genuine expansion or merely another brief surge through resistance.
The post Bitcoin price soars to 4 week high passing multiple resistance levels within hours with eyes on $77k appeared first on CryptoSlate.