Disclaimer: Information found on CryptoreNews is those of writers quoted. It does not represent the opinions of CryptoreNews on whether to sell, buy or hold any investments. You are advised to conduct your own research before making any investment decisions. Use provided information at your own risk.
CryptoreNews covers fintech, blockchain and Bitcoin bringing you the latest crypto news and analyses on the future of money.
Bitcoin approaches the $78,000 ‘True Market Mean’ as Federal Reserve and retail data are poised to influence the next direction.
Bitcoin is encountering a resistance area as the broader economic landscape becomes more complex. The price is nearing $75,000, with significant on-chain sellers entering the market and two major US data releases approaching. These factors will influence whether Bitcoin can surpass $78,100 or face another setback.
As reported by Glassnode on April 15, the current situation reflects a notable level of tension. The Short-Term Holder Supply in Profit stands at 43.2%, still below the approximately 54.2% threshold where bear market rallies have historically faltered, indicating potential for further ascent.
Nonetheless, the 30-day EMA of the Realized Profit/Loss Ratio has reached 1.16, suggesting that investors are more inclined to sell during price increases rather than buy during dips. BTC achieved an intraday peak of $75,218, leaving 5.2% to reach the upper limit.
Why this matters
Bitcoin is not merely rising on momentum; it is approaching a price range where previous bear market rallies have faltered as investors secure profits. With the upcoming retail sales report and Federal Reserve decision imminent, this phase presents a clear test of whether new demand can outweigh selling pressure or if the rally will again stall below $78,100.
Glassnode characterizes the current movement as a relief rally within an ongoing bear market framework, stating that any sustained breakthrough above $78,100 necessitates new demand capable of absorbing the selling pressure that investors have been releasing during the rebound.
This demand catalyst has yet to emerge, which is why the macroeconomic calendar in the next two weeks is particularly significant.
 Related Reading
Bitcoin price soars to 4 week high passing multiple resistance levels within hours with eyes on $77k
Bitcoin has surpassed a multi-month resistance ladder, shifting attention to whether the previous ATH zone can serve as support and facilitate further upward movement.
Apr 14, 2026 · Liam 'Akiba' Wright
The levels that decide the move
Glassnode outlines the price landscape around three key zones.
The initial significant test lies between $74,000 and $76,000, where clusters of short liquidations accumulate and where recent rallies have consistently stalled. Bitcoin is currently trading within this first decision zone.
The primary resistance level is $78,100, which Glassnode identifies as the True Market Mean, representing the average acquisition cost of actively traded coins, excluding lost or inactive supply.
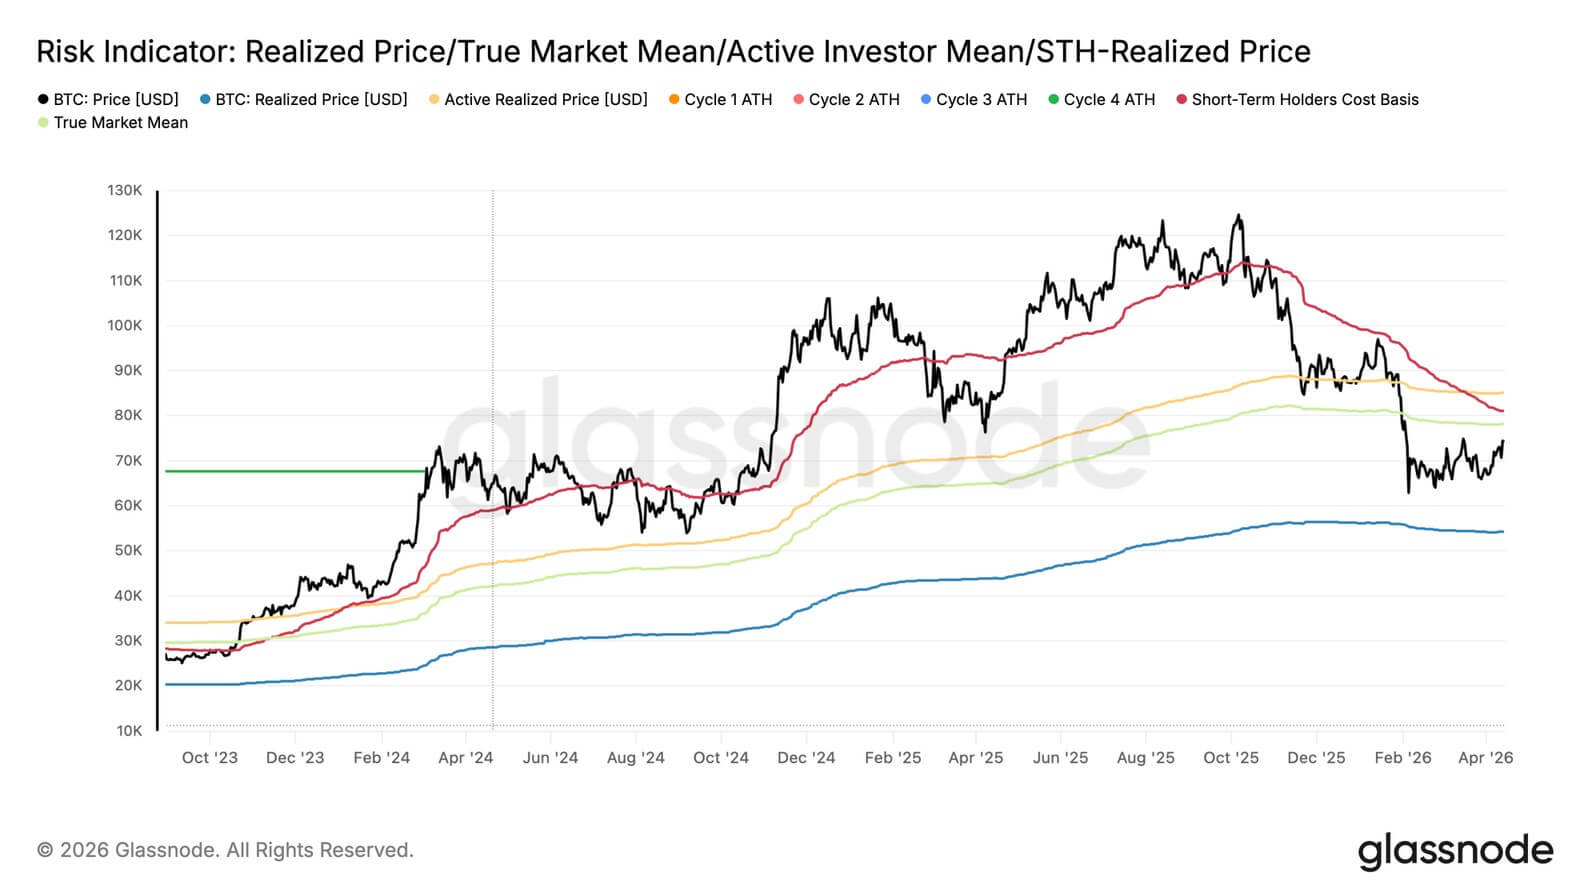 Bitcoin spot price trades below the True Market Mean and Short-Term Holder Cost Basis in April 2026, placing it within Glassnode's bear-market value zone. Source: Glassnode
Trading beneath this level positions Bitcoin in what the report refers to as the bear market value zone, historically associated with a market still navigating its recovery phase.
A successful reclaim and maintenance above $78,100 would shift the rally’s dynamics, while another rejection at this level would preserve the bear structure.
On the downside, Glassnode identifies the densest liquidation cluster between $63,000 and $65,000, where long liquidation exposure is highest, and the market has repeatedly absorbed price tests.
A failure to break through the $74,000-$76,000 zone would reignite discussions around the upper $60,000s as a structural reference point, but $63,000-$65,000 is the more directly sourced support area in the report.
The macro backdrop is no longer easy
The official data from March reinforces the Fed’s rationale for maintaining its current stance.
CPI increased by 3.3% year-over-year, with core CPI at 2.6% and the energy index rising by 10.9% month-over-month. PPI climbed by 0.5% month-over-month and 4.0% year-over-year, while payrolls added 178,000 jobs, keeping unemployment at 4.3%.
The Fed’s March statement explicitly noted that uncertainty regarding the economic outlook remains high and that the effects of geopolitical events in the Middle East on the US economy are unclear.
In April, overall activity expanded at a slight-to-modest pace. However, the conflict in the Middle East has introduced significant uncertainty, complicating hiring, pricing, and capital investment decisions, leading many firms to adopt a wait-and-see approach.
Energy and fuel prices surged across all Districts, and the broadening of input costs extended beyond energy.
This combination of persistent core inflation, heightened geopolitical uncertainty, and firms scaling back on investments diminishes the favorable macro conditions Bitcoin would require to break through the $74,000-$76,000 cluster and maintain a position above $78,100 with conviction.
Related Posts
The macro backdrop raises the threshold for a Bitcoin breakout. Strong inflation data, a cautious Fed, and rising energy costs all tighten the conditions necessary for a conviction-led upward movement.
The IMF's April 2026 World Economic Outlook provides a global perspective.
Under a limited-conflict scenario, global growth is projected to slow to 3.1% in 2026 and 3.2% in 2027, while global inflation is expected to rise.
The IMF's Global Financial Stability Report highlights that since late February, stock prices have declined while bond yields have increased, as rising energy costs and expectations of higher interest rates have tightened overall financial conditions.
Bitcoin’s journey through on-chain resistance is smoother in a more accommodating environment than in one where risk assets are already contending with tighter macro pricing.
| Indicator | Latest reading | Why it matters for BTC |
|---|---|---|
| CPI (YoY) | 3.3% | Keeps inflation pressure alive |
| Core CPI (YoY) | 2.6% | Limits easy dovish repricing |
| Energy index (MoM) | +10.9% | Reinforces inflation and geopolitical risk |
| PPI (MoM) | +0.5% | Signals pipeline price pressure |
| PPI (YoY) | 4.0% | Keeps inflation backdrop firm |
| Payrolls | +178,000 | Labor market still holding up |
| Unemployment | 4.3% | Supports Fed caution rather than urgency to ease |
| IMF global growth 2026 | 3.1% | Slower global growth backdrop |
| IMF global growth 2027 | 3.2% | Recovery still restrained |
| Financial conditions | Tighter since late February | Harder backdrop for risk assets |
What the derivative readings add
Spot cumulative volume delta (CVD) has shown improvement, but buying activity led by Binance is outpacing that of Coinbase, indicating stronger offshore and retail participation compared to institutional engagement.
CME open interest and US ETF AUM have started to recover, but both remain below previous highs, reflecting cautious re-engagement.
Options data reveals one-month implied volatility around 42.6%, with the 25-delta skew leaning towards puts, and a one-week volatility risk premium near -2 vol points, with realized volatility exceeding implied volatility. These factors illustrate a market structure that is pricing in a defensive stance.
Glassnode also points out that a significant amount of negative gamma exists near the $75,000 strike, with market makers appearing structurally short calls at that level.
As the spot price approaches, hedging flows could increase, potentially amplifying upward movements. However, this dynamic reflects the mechanical aspect of short-covering.
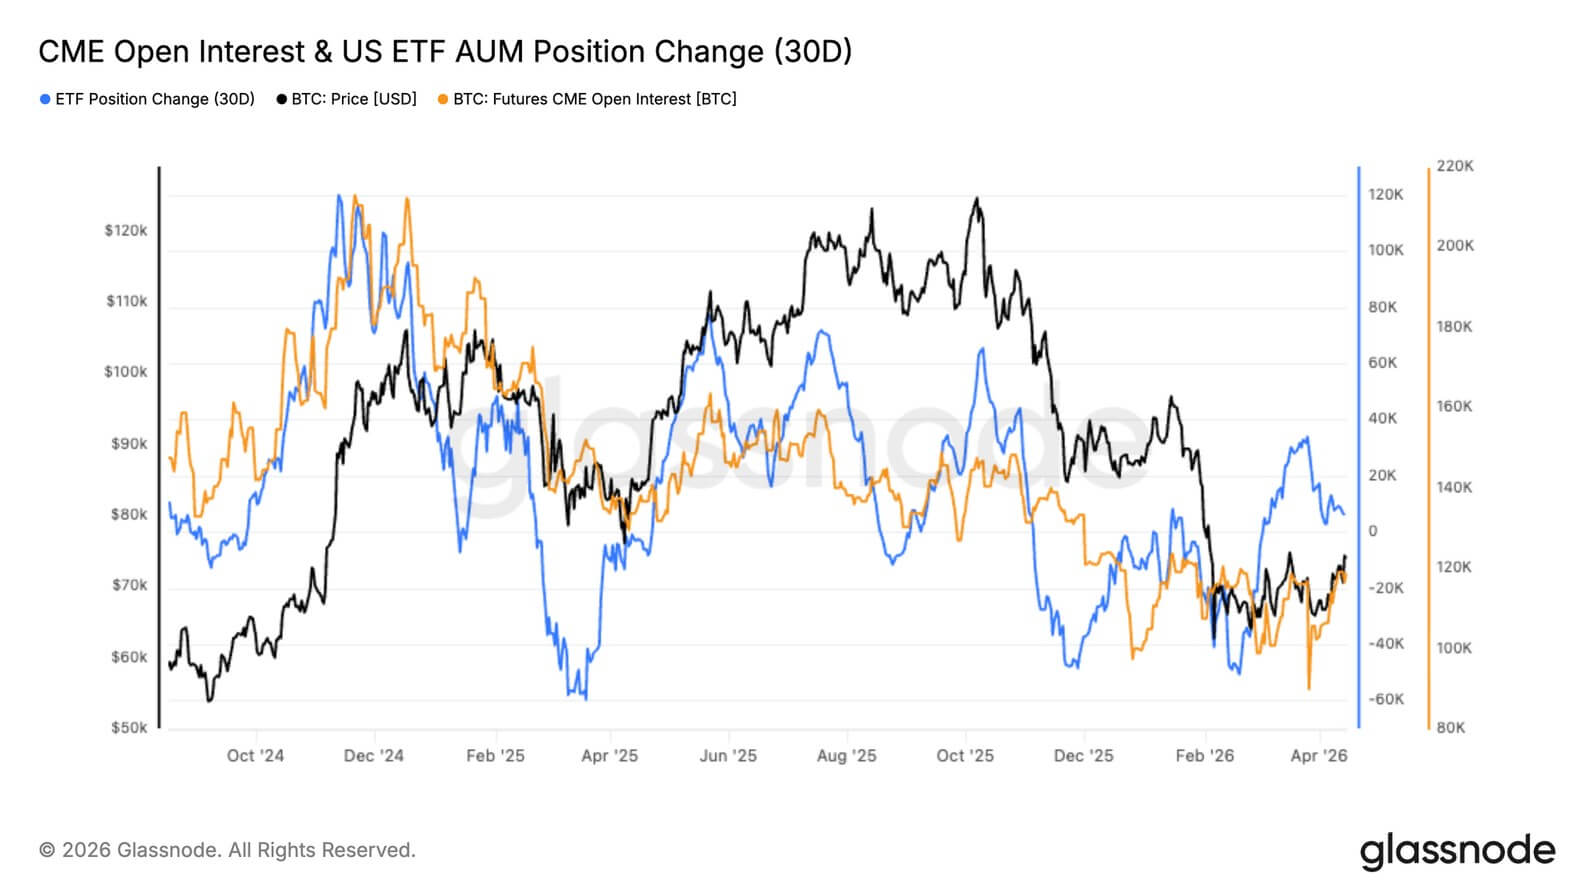 US ETF AUM and CME futures open interest both show negative 30-day position changes through early 2026, with a tentative recovery in April. Source: Glassnode
Two futures for this setup
Bitcoin is testing resistance just as two critical near-term macro checkpoints approach.
The Census Bureau's March Advance Monthly Retail report is scheduled for release on April 21. The next FOMC decision will occur on April 28-29. Retail sales will provide the clearest near-term insight into whether consumer demand is maintaining strength or weakening amid rising energy costs and geopolitical uncertainty.
The FOMC will either affirm or complicate the Fed’s current wait-and-see approach.
A weaker retail figure or a Fed statement that eases yield expectations would provide Bitcoin with the macro support needed to attempt a clean break of the $74,000-$76,000 cluster.
A stronger or more complex reading would exacerbate the distribution activity already evident in the 1.16 realized profit/loss ratio.
The bullish scenario requires both on-chain and macro factors to align positively. Bitcoin must clear the $74,000-$76,000 short-liquidation cluster and generate sufficient spot demand, with ETFs expanding, CME participation accelerating, and Coinbase activity turning decisively positive to absorb the profit-taking currently underway.
A macro reading from retail sales or the FOMC that eases rate expectations would provide the external catalyst that Glassnode’s framework necessitates.
If these conditions align, then $78,100 becomes a level that the rally actively challenges, and a close above it would redefine the rally’s nature.
Glassnode indicates that the likelihood of a spike toward, and potentially above, the True Market Mean remains significant in the mid-term.
| Scenario | What happens on-chain | What macro needs to do | Price implication |
|---|---|---|---|
| Bull case | BTC clears $74K–$76K, spot demand broadens, ETFs/CME/Coinbase participation improves | Softer retail sales or a Fed outcome that eases yield expectations | $78.1K gets challenged and potentially reclaimed |
| Bear case | BTC fails in $74K–$76K, profit-taking continues, rally stays a squeeze | Firm retail sales or a hawkish Fed read keeps financial conditions tight | Focus returns to upper $60Ks, then $63K–$65K |
| Key tell | Demand absorbs overhead supply | Macro gives risk assets breathing room | Rally changes character only above resistance |
The bear case unfolds through macro challenges arriving before demand materializes. If retail sales are robust or the FOMC delivers a more hawkish-than-anticipated assessment, risk assets may face renewed selling pressure.
Bitcoin could again falter in the $74,000-$76,000 range, the realized profit/loss ratio may rise, and the focus on the downside could shift back toward the upper $60,000s as an initial reference point, with $63,000-$65,000 serving as the deeper liquidation-supported zone.
This outcome aligns with Glassnode’s perspective that the current structure represents a bear-market bounce, and until Bitcoin reclaims the Short-Term Holder Cost Basis at $81,600, the medium-to-long-term outlook remains skewed toward the downside.
The post Bitcoin is squeezing into the $78k ‘True Market Mean’ with Fed and retail data set to decide next move appeared first on CryptoSlate.