Disclaimer: Information found on CryptoreNews is those of writers quoted. It does not represent the opinions of CryptoreNews on whether to sell, buy or hold any investments. You are advised to conduct your own research before making any investment decisions. Use provided information at your own risk.
CryptoreNews covers fintech, blockchain and Bitcoin bringing you the latest crypto news and analyses on the future of money.


XRP is poised for potential headline attention as its 50-day moving average sits approximately 2% below its 200-day average, marking the closest gap since the token’s last golden cross in August 2024. This setup emerges as Bitcoin dominance, representing Bitcoin‘s share of the total cryptocurrency market capitalization, has fallen to a one-month low below 59%.
A golden cross is confirmed when an asset’s 50-day moving average crosses above its 200-day moving average. Chart analysts widely view this pattern as a bullish long-term signal. While Bitcoin recently confirmed its own golden cross, historical data suggests XRP has a different track record.
An analysis of the 16 previous XRP golden crosses revealed that all were terminated by a death cross within 12 months. Six of these crosses did not survive three months. Of the 10 crosses that reached the three-month mark, five produced gains ranging from 85% to more than 1,000%. These included a 1,009.6% gain following the April 2017 cross and a 135% gain after the February 2021 cross. The other five crosses resulted in losses of up to 32%.
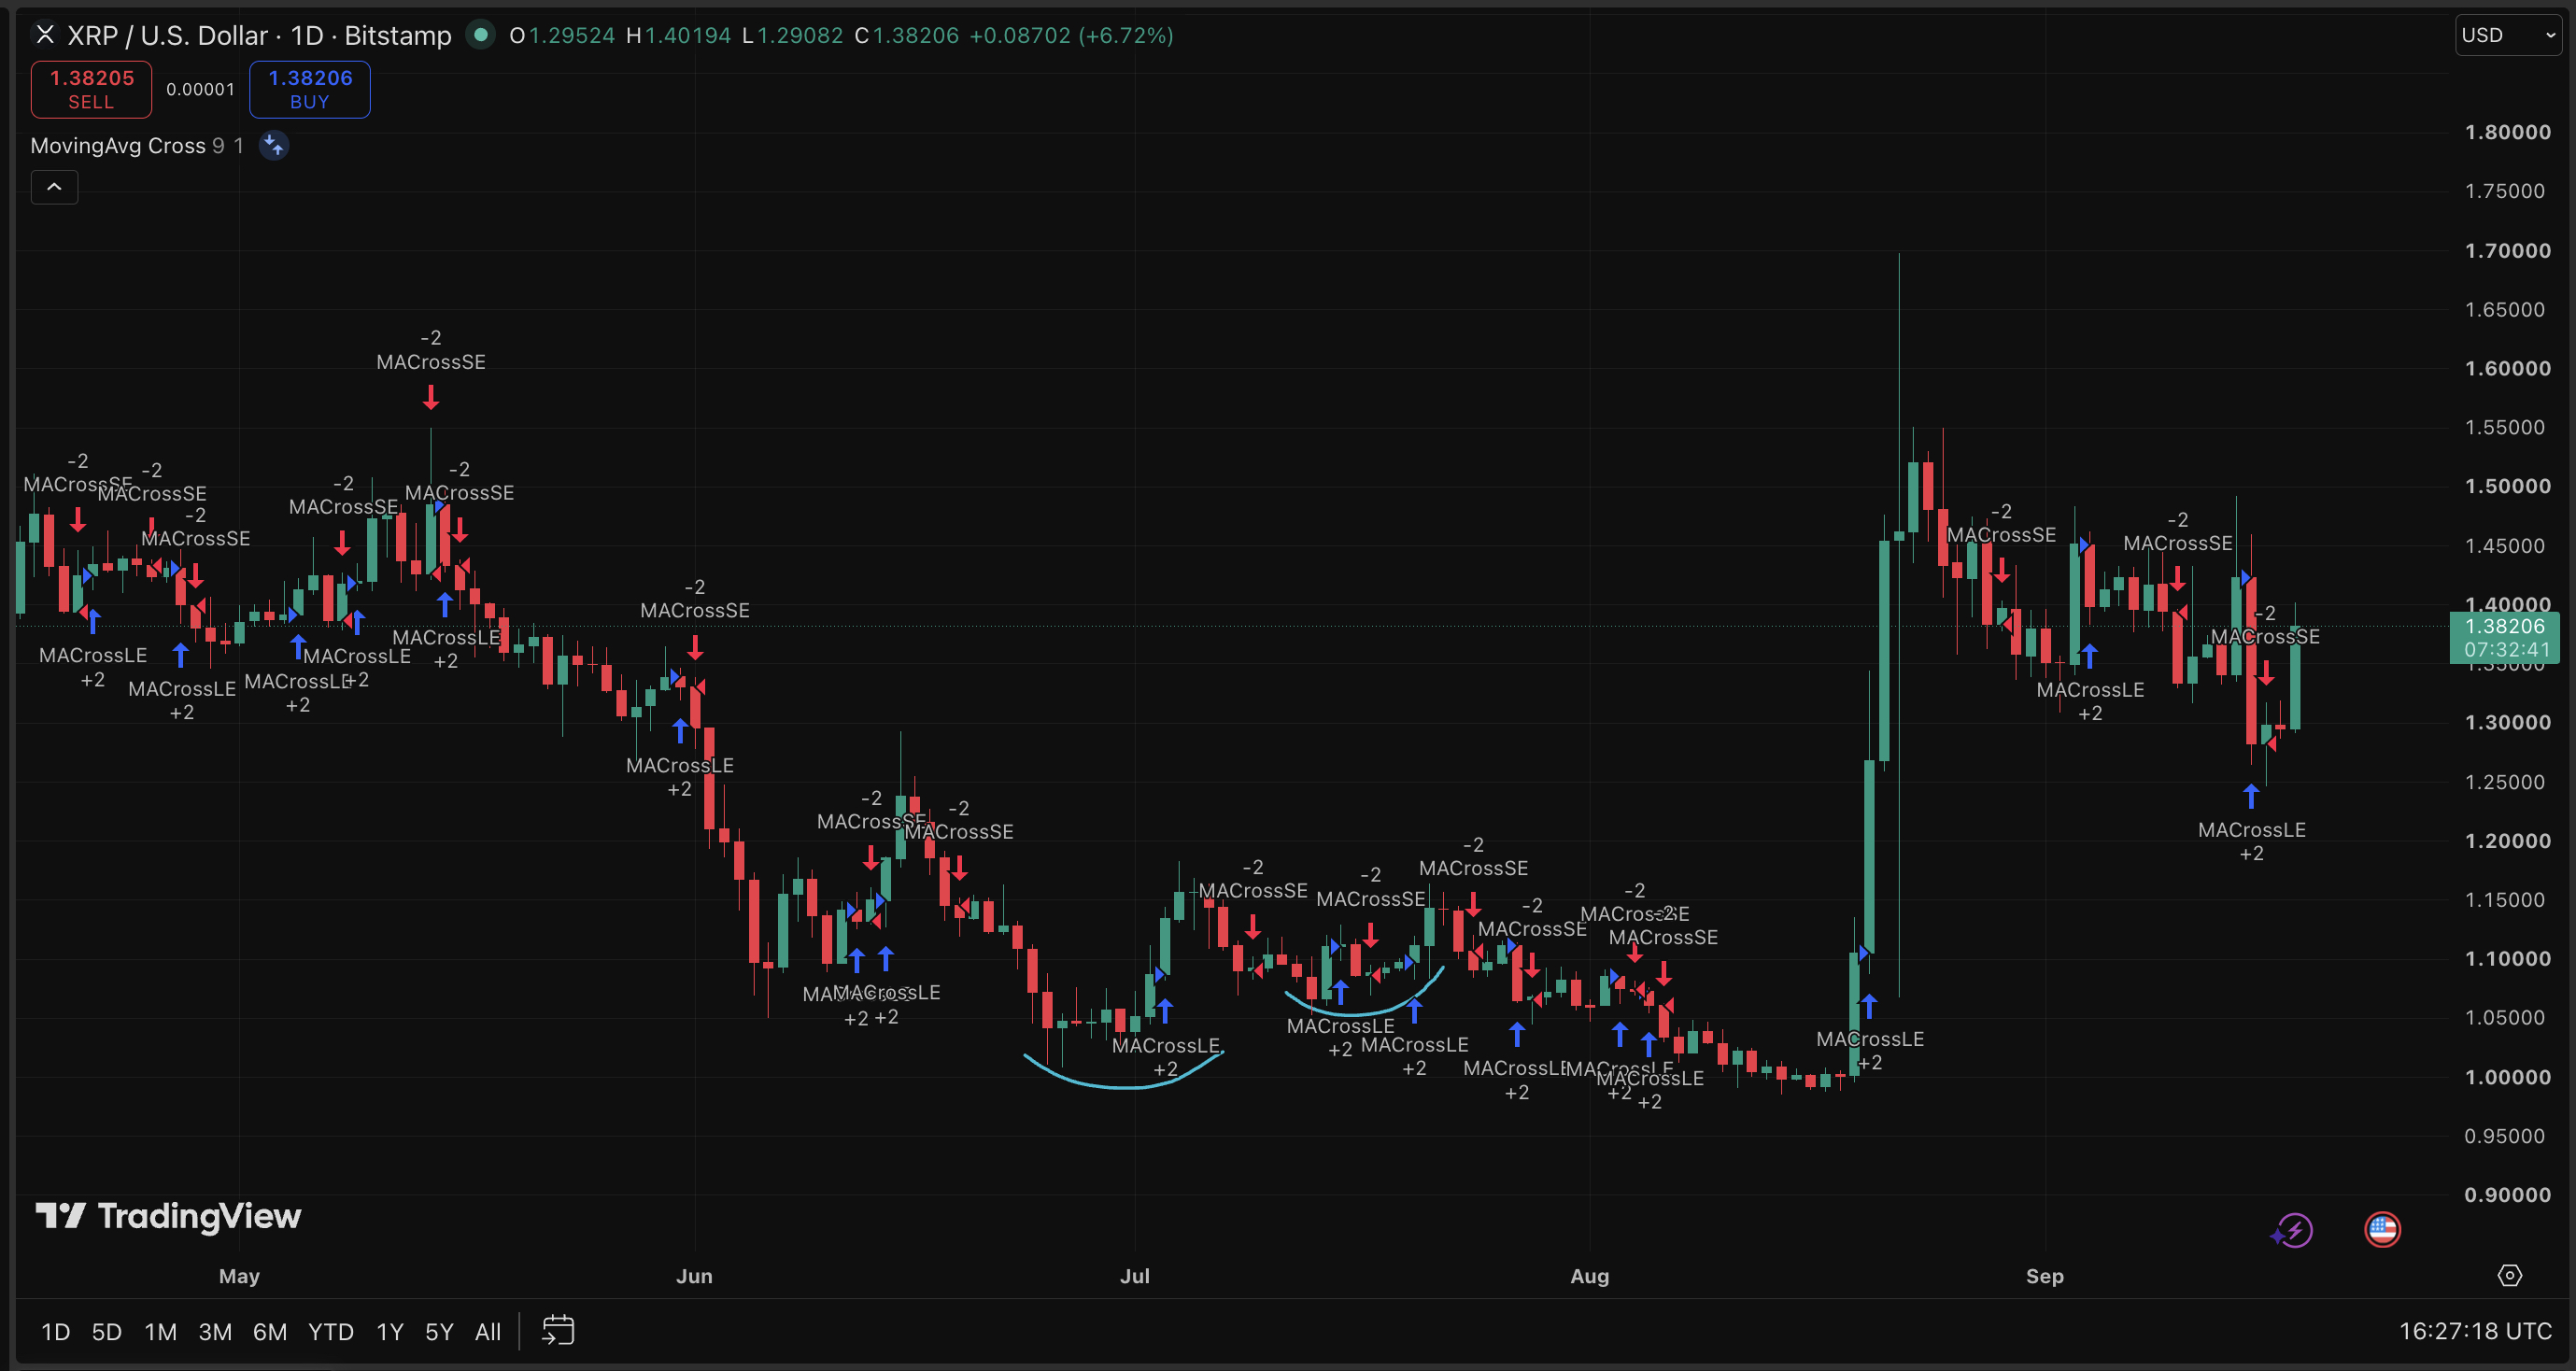
Half of the crosses that lasted at least three months generated substantial gains, while the other half produced losses. These historical figures indicate that the golden cross, like other technical indicators, is not fully reliable when used in isolation.
Bitcoin is currently trading near $80,000, and its dominance rate has dropped below 59%, implying a rotation into altcoins. The data points to attention shifting within the crypto market, even as Bitcoin’s price remained near its level from a week earlier.
How to Read the Moving Averages?
Confirmation requires the 50-day average to cross above the 200-day average. With XRP’s 50-day average sitting about 2% below the longer-term average since the August 2024 golden cross, the difference between the two averages serves as the immediate technical measure for traders monitoring the setup.

Related Posts
AI price analysis identified the $1.26-$1.27 area as a support zone that aligns with the 200-day moving average and former range support. XRP’s technical structure remains neutral, and the near-term direction hinges on whether the asset can hold above that support area despite some bearish news from the Clarity Act.
Moving averages provide one way to assess trend conditions, but historical XRP results show why the crossover itself does not settle the question of what follows. A cross can confirm the technical pattern while leaving the duration and price performance of that pattern uncertain.
What’s Next for XRP Beyond the News?
If XRP’s 50-day average crosses above its 200-day average, it will confirm the pattern being tracked. This would be a technical event, not a guarantee of a lasting advance. A later death cross would be consistent with the outcome recorded for all 16 prior XRP golden crosses within a year.
The three-month historical split remains central to interpreting the signal. Five of the 10 crosses that reached that point posted gains of 85% to more than 1,000%, while five recorded losses of up to 32%. The outcomes show both the potential for large gains and the limits of relying on the indicator alone.
The broader move into altcoins has been characterized as cautious rather than complete. Alex Kuptsikevich, chief market analyst at FxPro, noted that traders appeared to be cautiously shifting their focus toward altcoins, while the altcoin season index and overall market sentiment had not reached high levels.
Bitcoin dominance below 59% is consistent with the assessment that attention is rotating toward altcoins, while available indicators do not yet establish a broad altcoin cycle.
Discover: The Best Token Presales
The post XRP News: 16 Previous Golden Crosses Complicate Current Signal appeared first on Cryptonews.
