Disclaimer: Information found on CryptoreNews is those of writers quoted. It does not represent the opinions of CryptoreNews on whether to sell, buy or hold any investments. You are advised to conduct your own research before making any investment decisions. Use provided information at your own risk.
CryptoreNews covers fintech, blockchain and Bitcoin bringing you the latest crypto news and analyses on the future of money.

Which Entities Is Trump Sending into the Stone Age? The Cryptocurrency Market Is Experiencing Turmoil


Opinion
Related Posts
The first three months of this year have been the worst for Bitcoin in eight years. The US-Iran military conflict continues to weigh on cryptocurrency market sentiment. US President Donald Trump’s statements have only intensified investor fear.
Bitcoin
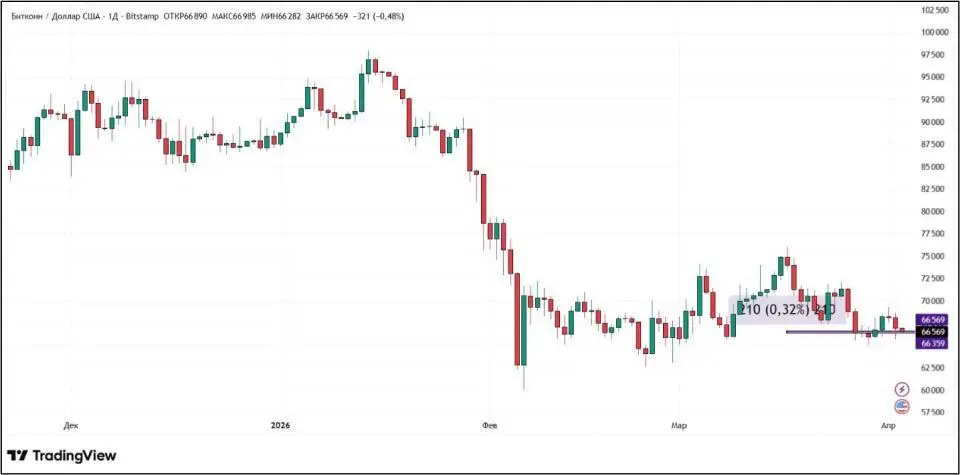
Bitcoin remained virtually unchanged in price from March 27 to April 3, 2026, increasing by just 0.32%. Trading of the asset last week occurred within a fairly narrow range between $65,000 and $69,000. The largest cryptocurrency by market capitalization failed to break through the psychologically significant $70,000 mark during the week.
Source: tradingview.com
Until April 1, Bitcoin attempted to rise, even managing to surpass the $69,000 mark. However, on April Fool’s Day, the US President addressed the nation. Trump’s speech was unlikely to bring smiles. Instead of offering reassurance, Trump once again hinted at an escalation of the conflict with Iran, even promising to send the Islamic Republic “back to the Stone Age.” The risk of exacerbating the already tense situation prompted investors to sell off Bitcoin, which logically led to a decline in the asset’s price.
Another factor hindering BTC’s growth is the actions of large players. According to data from the analytics platform CryptoQuant, holders of 1,000 to 10,000 Bitcoin are actively divesting from this cryptocurrency. Over the past year, they have sold approximately 188,000 BTC, marking one of the largest volumes for such a period in history. However, those holding between 100 and 1,000 Bitcoin continue to accumulate the asset. Nevertheless, the pace of BTC acquisition has slowed significantly. While this category of Bitcoin holders added 1 million coins to their reserves in October, by the end of March 2026, this figure had dropped to 429,000.
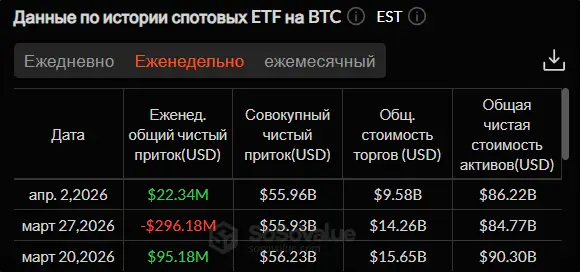
Spot Bitcoin ETFs, after a pause last week, have once again recorded inflows of funds. However, the volume was relatively modest at $22.34 million. The fund most popular among investors during the week was the Ark Invest and 21Shares fund, ARK 21Shares Bitcoin ETF (ARKB), which investors topped up by $34.16 million.
Source: sosovalue.com
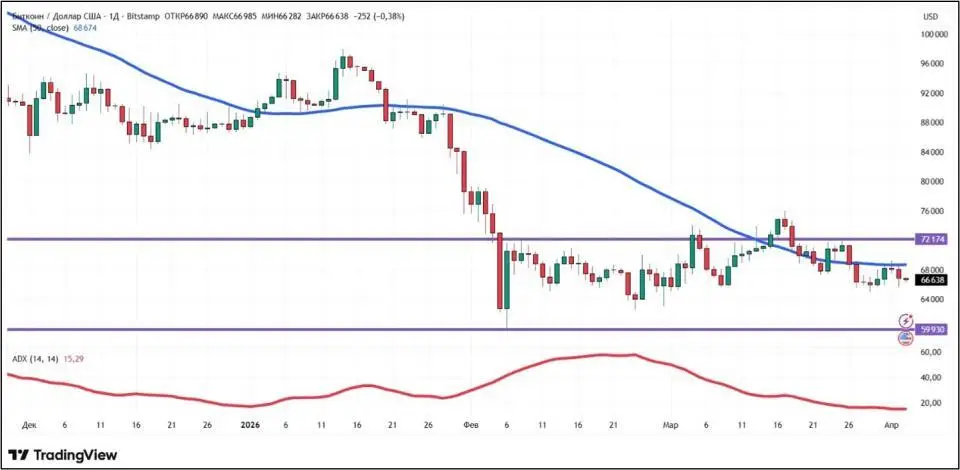
From a technical analysis perspective, Bitcoin remains in a sideways trend. The absence of a trend is confirmed by the ADX indicator dropping to a value of 15.29. Bitcoin’s price is located slightly below the 50-day moving average (marked in blue), indicating a slight advantage for sellers (bears) over buyers (bulls). Changes may occur if BTC manages to hold above the resistance zone in the $72,000–$76,000 range. The support level remains around $60,000.
Source: tradingview.com
The Fear and Greed Index decreased by four points compared to last week, down to 9. This still indicates a predominance of extreme fear in cryptocurrency investor sentiment.
Ethereum
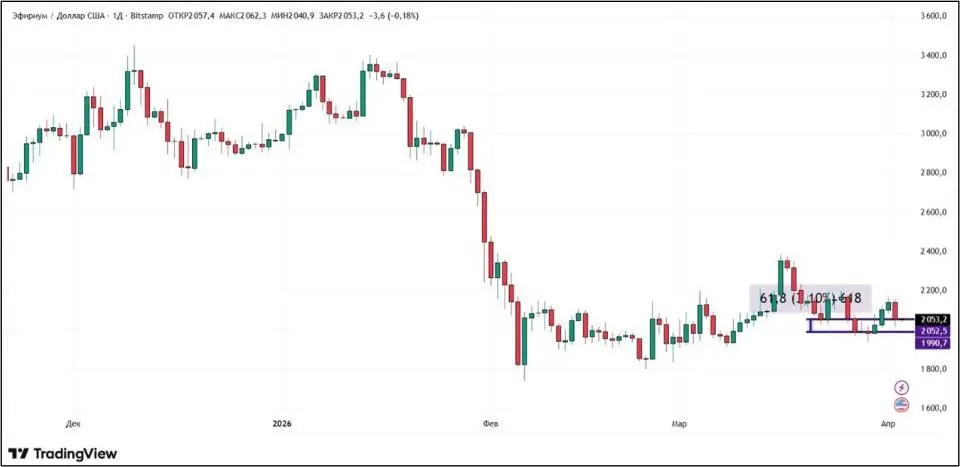
Ethereum increased by 3.1% over seven days from March 27 to April 3. This was made possible by three trading sessions of growth in the middle of the week. From March 30 to April 1, the second-largest cryptocurrency by market capitalization rose by more than 9%. However, negative dynamics were observed on the remaining days.
Source: tradingview.com
As with Bitcoin, Ethereum showed growth before Trump’s speech. This is not surprising given that network metrics are near historical highs. According to the analytics platform Santiment, the number of daily active addresses reached 788,000. Additionally, 255,000 new addresses are created daily.
The research and educational platform Coin Bureau notes an increase in Ethereum user activity on decentralized exchanges (DEX). The share of ETH increased from 33% in January to 42% in March. The main driver of this dynamic has been Layer 2 (L2) solutions.
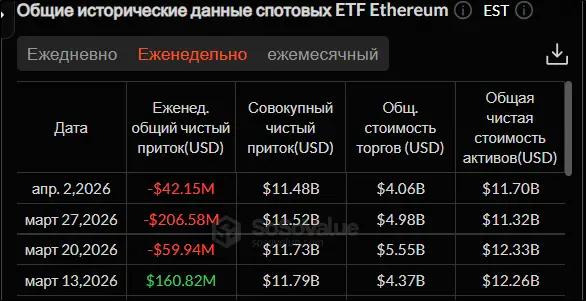
Spot Ethereum ETFs continue to record outflows of funds for the third consecutive week. This time, the volume was minimal at $42.15 million. The negative result is explained by the mass withdrawal of funds from the BlackRock fund, iShares Ethereum Trust (ETHA). Investors withdrew $63.98 million.
Source: sosovalue.com
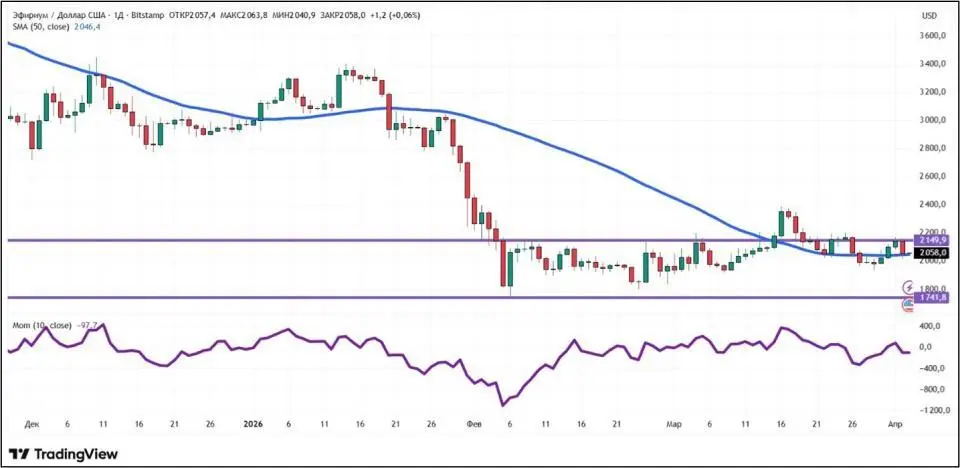
From a technical analysis perspective, Ethereum has been in a sideways trend for almost two months. The absence of a clear trend is confirmed by indicators. The ETH price is located close to the 50-day moving average (marked in blue). Momentum has a negative value, which favors bears. However, just two days ago, the indicator was positive. Overall, the indicator has been consistently changing sign from positive to negative since mid-February. This reflects the absence of a clear trend. The nearest support and resistance levels on the daily chart are $1,741.8 and $2,149.9, respectively.
Source: tradingview.com
Solana
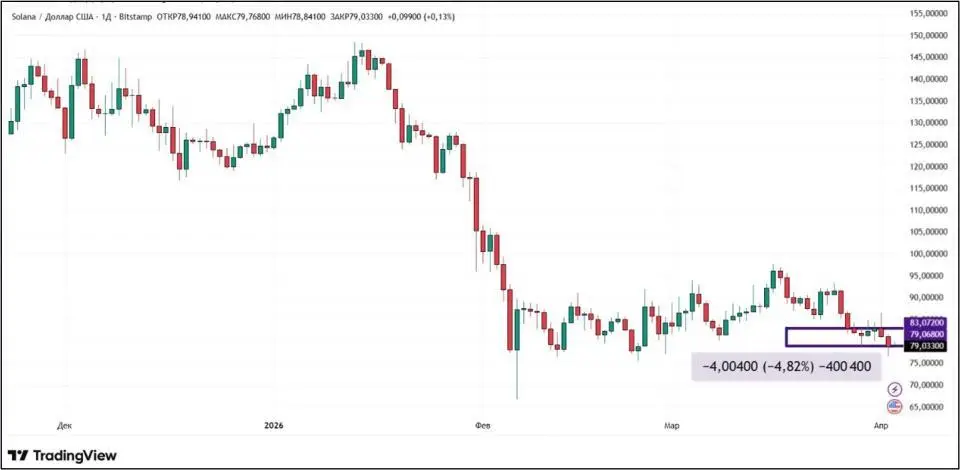
Solana lost 4.82% of its value from March 27 to April 3. Throughout the week, the cryptocurrency dropped below $77, a level it had not touched in over a month. Despite the negative price dynamics, the gap between negative and positive trading sessions over the seven days was minimal: four against three.
Source: tradingview.com
Despite the lack of price growth, Solana’s fundamentals are not in poor shape. During the week, it became known that the digital financial company SoFi is creating a Big Business Banking platform on the cryptocurrency blockchain. The platform invites large organizations to become clients. Access is promised to be available 24/7. SoFi’s choice of Solana is explained by the network’s ability to “provide fast and economical transactions.”
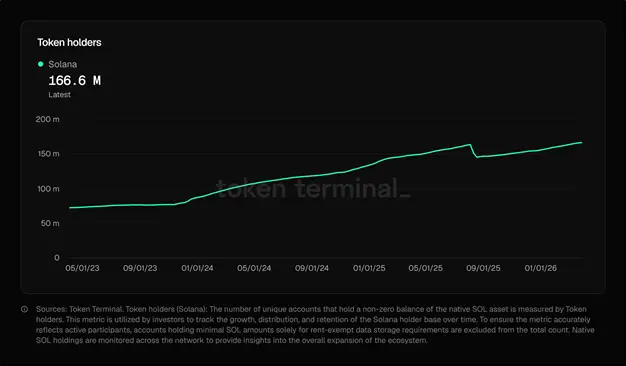
The total number of SOL holders continues to grow. According to the TokenTerminal service, at the beginning of April, it exceeded 166 million for the first time. Since the end of March 2025, the number of SOL holders has increased by more than 18 million.
Source: tokenterminal.com
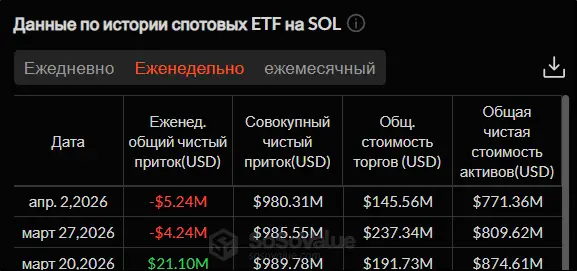
Spot Solana ETFs have recorded outflows of funds for the second consecutive week. This time, the outflow amounted to $5.24 million. The most funds, $6.17 million, were withdrawn by investors from the Bitwise fund, Bitwise Solana Staking ETF (BSOL), over the past seven days.
Source: sosovalue.com
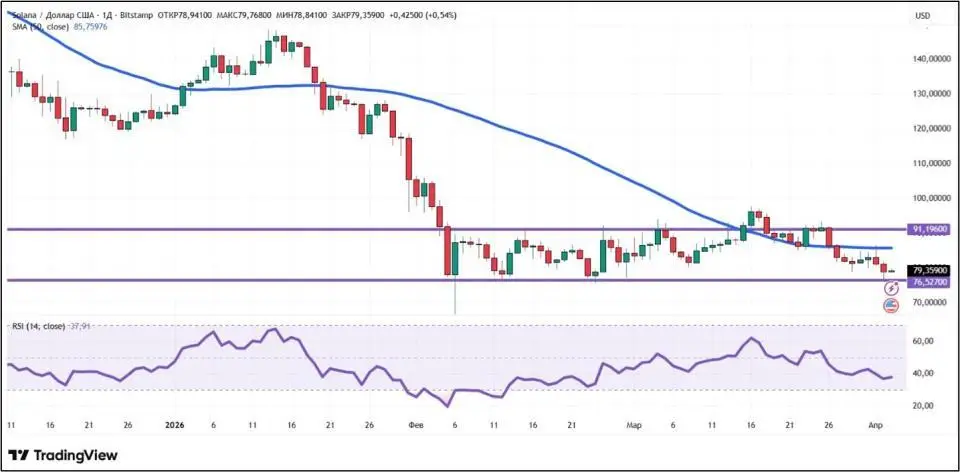
From a technical analysis perspective, Solana, like Bitcoin and Ethereum, has been trading in a range between a support level of approximately $76.5 and a resistance level of approximately $91 for almost two months, rarely breaking out of these bounds. At the same time, indicators point to a bearish advantage. The 50-day moving average (marked in blue) is located above the SOL price, and the RSI has dropped below the value of 50.
Source: tradingview.com
Conclusion
In other words, the growth attempt made by the largest cryptocurrencies in the middle of the week was thwarted by Trump’s new threats to Iran. Investors are reluctant to take active action amid high uncertainty and the lack of de-escalation of the conflict in the Middle East.
This material and the information contained herein do not constitute individual or other investment advice. The editorial opinion may not coincide with the opinions of analytical portals and experts.
