Disclaimer: Information found on CryptoreNews is those of writers quoted. It does not represent the opinions of CryptoreNews on whether to sell, buy or hold any investments. You are advised to conduct your own research before making any investment decisions. Use provided information at your own risk.
CryptoreNews covers fintech, blockchain and Bitcoin bringing you the latest crypto news and analyses on the future of money.
ChatGPT’s o3 Pro AI model has evaluated 38 live indicators, encompassing TradingView technicals, Binance order book flows, on-chain usage metrics, and social sentiment, resulting in a concentrated SUI price prediction as the token remains around $2.78 in anticipation of potential catalysts.
The RSI at approximately 42.5 and a slight bearish MACD crossover suggest that SUI is positioned between support levels of $2.70–$2.85 and resistance levels around $3.15–$3.20, even as daily trading volume surpasses $1.14 billion.
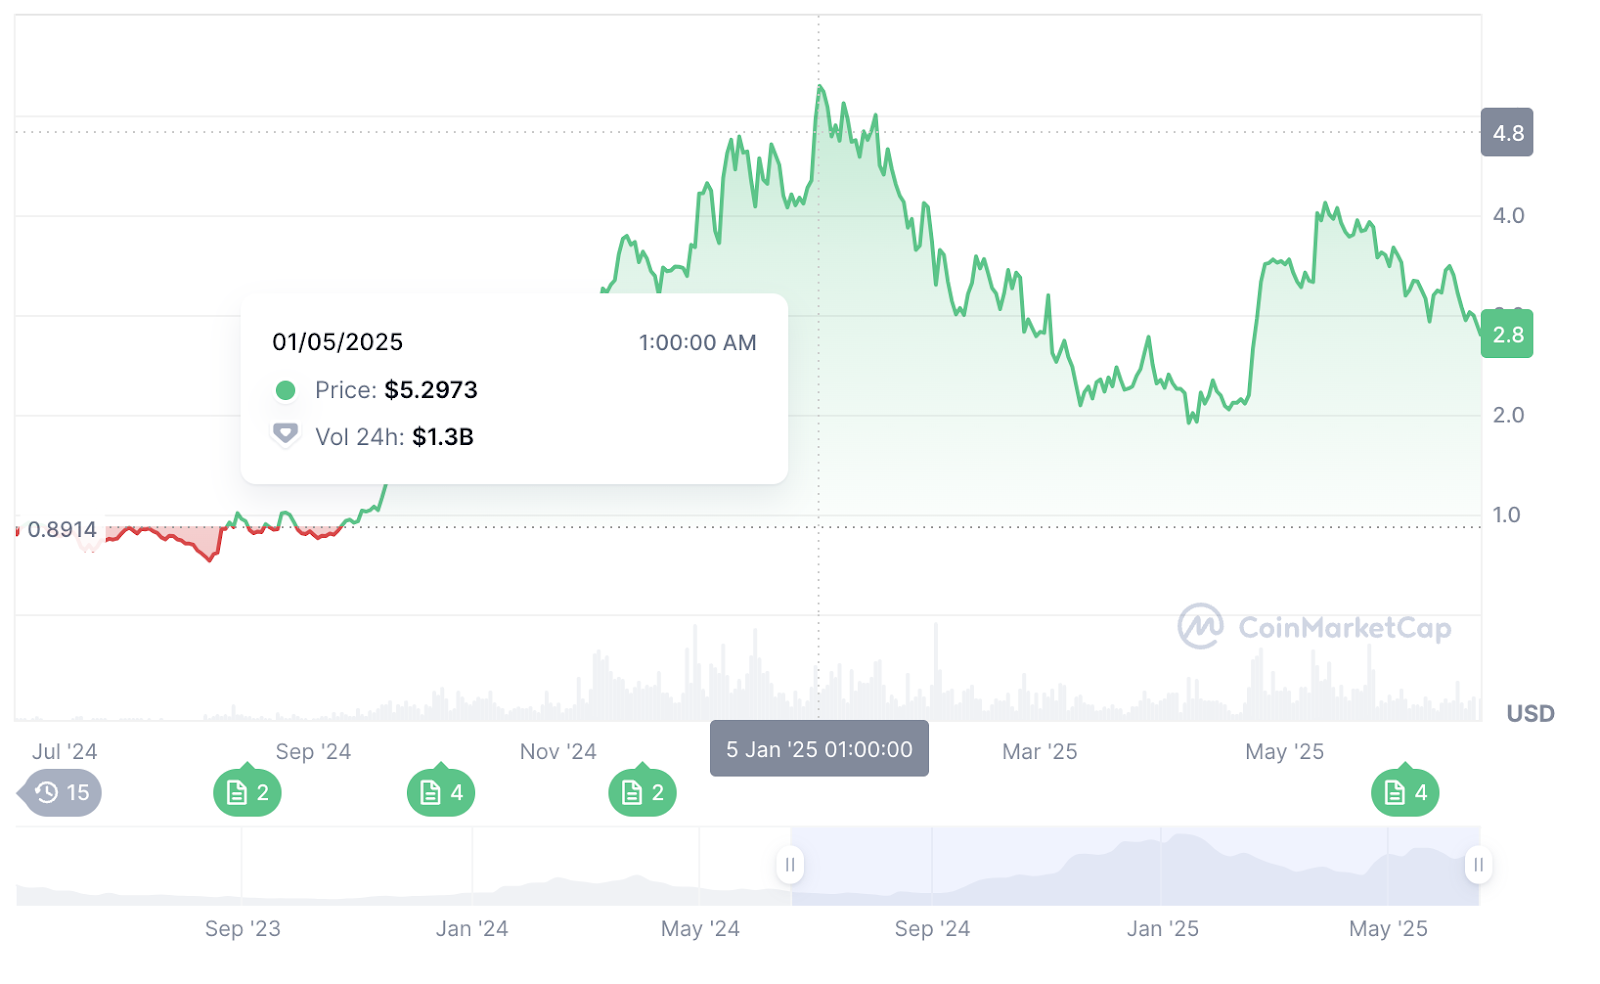 Source: CoinMarketCap
Since reaching a peak of $5.35 in January, the price has retraced into a range of $2.81–$3.37 by mid-June. Nevertheless, growth in active addresses, ecosystem advancements, and social dynamics imply that a more significant movement may occur once volatility (ATR ~0.12 USDT) increases.
This analysis utilized one of ChatGPT’s AI models, the new o3 pro. The forecasts were subsequently reexamined and refined for improved clarity while preserving analytical accuracy.
Technical Pulse: SUI Price Coiled in a Tight Range
On the daily SUI/USDT chart at Binance, the market is evidently consolidating. Following the January peak of $5.35, Sui has retreated, settling into a range of approximately $2.70 to $3.15.
 Source: TradingView
Momentum indicators reflect caution, with an RSI around 42.5 positioned below neutral, indicating no extreme oversold conditions, while the MACD line at roughly –0.0123 crossing below its signal at around –0.0087 results in a slight negative histogram (~–0.0036), suggesting modest downward pressure rather than a definitive breakdown.
Volatility remains low, with an ATR of approximately 0.22 USDT indicating daily fluctuations of about 4% or less until an external catalyst broadens the range.
Exponential moving averages further clarify the market bias. The 20-day EMA at about $2.81 is slightly above the current price (~$2.78), while the 50-day EMA near $2.95 and the 100-day EMA around $3.10 are positioned overhead as a descending cluster that resists upward movements.
Attempts to reclaim these averages have faltered, suggesting that sellers are defending rallies within this compression.
Bollinger Bands, calculated on a 20-day SMA near $2.85 with upper and lower bands around $3.15 and $2.55, respectively, are tightening in a classic squeeze; trading below the middle band indicates a downward bias but allows for a potential bounce if support levels hold.
Classic pivot calculations from the previous session’s high, low, and close yield a pivot near $2.85, first support around $2.70, first resistance near $3.00, second support near $2.55, and second resistance close to $3.15.
These pivot points correspond with horizontal zones observed in recent swings: support around $2.60–$2.70 and resistance near $3.20–$3.30.
Historically, once ATR and volume increase, such squeezes resolve sharply toward the next supply or demand zone. Until then, Sui is likely to fluctuate within $2.55–$3.15, favoring investors who adhere to intraday pivots and maintain tight risk management.
Support & Resistance Guide: Mapping the Crucial Zones
SUI’s immediate support is located near $2.70–$2.75, aligning with pivot S1 and recent swing lows observed in mid-June. If this support fails, the broader demand area extends down to approximately $2.55, below which April’s low near $2.11 becomes susceptible only if sellers decisively breach the $2.55 level.
On the upside, initial resistance around $2.85–$2.90 (pivot and 20-day EMA) must be overcome before the price can test the 50-day EMA near $2.95. Surpassing $3.15 (upper Bollinger Band and pivot R2) would create room toward swing highs around $3.30–$3.40, last tested in early June before renewed downward pressure.
Clearing the 100-day EMA near $3.10–$3.15 on strong volume would indicate a potential shift back toward $3.50–$4.00, although navigating through residual supply from April–May recovery attempts (approximately $3.50–$4.13) may necessitate a significant catalyst.
The critical trigger lies in daily closes, as maintaining above $2.85–$2.90 suggests a short-term bullish inclination, while falling below $2.70 risks probing $2.55–$2.50.
With an ATR-based expected daily range near $0.24, a breakout or breakdown beyond these pivot zones could occur within a single trading day once volatility increases.
Therefore, investors should monitor for ATR upticks alongside volume surges to confirm genuine directional movements rather than false breaks in a still-constricted market.
Liquidity & Market Depth: Is There Fuel for a Conviction Move?
With a market capitalization of approximately $9.5 billion and a fully diluted valuation of around $28 billion, SUI possesses considerable liquidity across major exchanges.
Binance’s SUI/USDT order books typically accommodate multimillion-dollar orders without significant slippage, a prerequisite for volatility expansions when triggered. The recent 24-hour turnover of $1.14 billion, about 12.5% of the market cap, reflects ongoing trading activity despite sideways price movement.
Based on on-chain and anecdotal indicators, the volume composition appears skewed toward spot accumulation rather than leveraged positions. This diminishes the likelihood of forced liquidations and mitigates explosive price fluctuations until a clear catalyst arises.
Order book clusters near $2.70–$2.80 on bids provide a buffer against moderate selloffs, while resting offers around $2.90–$3.00 absorb minor rallies unless buying pressure escalates.
Monitoring the volume-weighted moving average (e.g., VWMA20) can uncover subtle accumulation. If VWMA rises while the price remains below EMAs, it suggests selective buying beneath an overall bearish chart.
Overall, deep liquidity and sustained volume supply the potential for a breakout once volatility increases. However, the price may stay confined within the established range without a clear catalyst, ecosystem news, macro shifts, or changes in broader crypto sentiment.
The next significant move will likely require an external trigger to penetrate these liquidity zones.
OnChain Insights: Gauging Real Usage vs. Speculation
Despite SUI’s decline from January highs, on-chain metrics indicate ongoing ecosystem engagement. Daily active addresses and transaction counts remain elevated, reflecting usage-driven demand beyond mere speculation.
Thousands of daily users interacting with dApps, NFTs, DeFi, or emerging meme projects suggest a foundational utility that can sustain price floors during volatility spikes.
Lockups of SUI tokens by projects or the foundation for staking or governance purposes could tighten the exchange float, exerting upward pressure when buying resumes.
Conversely, reports of significant token dumps by early investors have intensified selling pressure, contributing to April’s decline.
Launches of large-scale dApps often lead to spikes in transaction volume, as users require SUI to pay fees and engage in tokenomics; such on-chain activity surges have historically preceded price recoveries.
Stablecoin or bridge flows are also significant, as data indicating that SUI surpasses other chains in stablecoin transfers suggests infrastructural adoption that supports long-term demand, even if price lags initially.
$SUI surpasses @Solana for the first time in weekly stablecoin transfers pic.twitter.com/vkPB1A59Hg
— ToreroRomero (@Torero_Romero) June 18, 2025
Network upgrades and partnerships, such as cross-chain bridges, major wallet integrations, or rumored listings like Robinhood, can prompt anticipatory positioning, reducing float ahead of confirmation.
Related Posts
Monitoring these indicators reveals whether on-chain demand growth outpaces sell-side pressure from profit-taking or broader market weakness.
$SUI SURPASSES 210 MILLION TOTAL ACCOUNTS pic.twitter.com/mdQAaRI0zq
— ToreroRomero (@Torero_Romero) June 16, 2025
Sustained increases in active addresses or locked tokens during a volatility squeeze often foreshadow bullish breakouts once sentiment shifts.
Social Sentiment Indicators: Reading the Community Pulse
LunarCrush data illustrates an engaged yet cautious SUI community. The Galaxy Score near 42 is below neutral 50, indicating a modest bullish inclination rather than exuberance.
AltRank places SUI around 530 in a mid-tier engagement category. However, engagement metrics reveal nearly 1.83 million interactions over 24 hours and increasing mentions of about 17.5 K.
Sentiment hovers around 89% positive or neutral, although slight downward shifts suggest growing caution amid price declines.
A high volume of mentions and an expanding creator base (approximately 3.2K contributors) indicate diverse narratives: some highlight SUI’s layer1 potential and utility gains (“surpassing Solana in stablecoin transfers”).
$SUI surpassing solana in stablecoins transfer is making it clear as the daylight
That the next retail onboarding chain is @SuiNetwork
Price action may not reflect it rn but when fundamentals start aligning, prices catch up sooner & at rapid pace!
Don’t fade…. pic.twitter.com/Y2OYwBLudU— Momin (@mominsaqib) June 18, 2025
Conversely, others caution against token dumps or question near-term catalysts. Social dominance, accounting for nearly 1.7% of crypto discussions, can spike around significant headlines, quickly amplifying volatility.
Trending articles, comparisons with other L1s, forecast warnings, and listing speculation shape collective expectations. Positive headlines may trigger short-term rallies, while contradictory reports can fuel whipsaws.
$SUI SURPASSES $490 BILLION TOTAL TOKEN VOLUME pic.twitter.com/K4OtxsCgTf
— ToreroRomero (@Torero_Romero) June 17, 2025
Overall, mixed yet attentive sentiment suggests that a clear catalyst, such as a successful dApp launch, major listing, or macro relief, could swiftly shift conviction and trigger a significant move.
Until then, social-driven volatility is likely to remain within the existing trading range, as bullish and bearish narratives balance each other.
Macro & Ecosystem Catalysts: Potential Sparks
Several developments could propel SUI out of its current compression:
- Confirmation of a high-profile listing or integration, such as on Robinhood or major wallet/payment platforms, would broaden access and likely reignite buying pressure. Collaborations with notable DeFi protocols or cross-chain bridges, enhancing utility, can reshape market perception.
- Launches of ecosystem milestones, high-profile dApps, NFT marketplaces, gaming projects, or DeFi protocols that generate substantial transaction volume and token lockups can tighten float and provide price support.
- Network upgrades that enhance throughput and interoperability (e.g., seamless bridges) or introduce innovative features (e.g., zkrollup integration) can boost developer interest and signal maturation, encouraging longer-term investment.
- A broader crypto rally, driven by macro liquidity, ETF approvals, or risk-on shifts, often elevates altcoins alongside Bitcoin and Ethereum; Sui could attract spillover capital if technical conditions allow.
- Tokenomics events, including vesting or unlock schedules, may pressure price when large holders sell; however, coordinated lockups or buyback programs could create bullish supply shocks. Clear communication regarding token release schedules is crucial to manage expectations.
- Regulatory clarity favoring layer-1 blockchains and DeFi can indirectly benefit Sui by enhancing sector confidence.
- Broader market shocks, geopolitical tensions, or macro risk-off episodes can trigger capital rotations; Sui’s on-chain usage resilience might provide relative shelter, although initial dips often precede recoveries if fundamentals remain intact.
The interplay and timing of these catalysts against SUI’s technical squeeze will dictate the breakout direction. Investors should keep an eye on news flow, on-chain and social metrics, and volume/volatility shifts as potential catalysts emerge.
Three-Month SUI Price Forecast Scenarios
In the next 90 days, SUI’s trajectory will likely fall into one of three broad scenarios.
Range-Bound Consolidation (Base Case)
SUI may fluctuate between approximately $2.55 and $3.15 without a clear catalyst or favorable macro shift. Technical indicators, such as the RSI hovering near 40–50, MACD near neutral, and EMAs overhead, suggest a balanced tug of war.
On-chain usage remains steady but not surging, and social sentiment stays mixed, keeping the price within the established range. Volatility (ATR ~0.12 USDT) and volume remain near current levels, punctuated by occasional spikes insufficient to breach pivot zones.
In this environment, short-term investors can capitalize on intraday fluctuations with tight risk controls, while longer-term participants await directional clarity before significantly altering positions.
Bull Breakout Toward $4+ (Bull Case)
A convergence of positive catalysts, such as a major listing announcement, a surge in dApp adoption metrics, or a broad crypto upswing, could drive volume and volatility above normal, pushing the price above $3.15 (upper Bollinger Band/pivot R2) and clearing the 100-day EMA near $3.10.
An RSI rising above 50, coupled with a bullish MACD crossover, would confirm a momentum shift. On-chain metrics (active addresses, transaction volume, token lockups) would need to spike to validate demand, and social indicators (Galaxy Score above 60, increasing engagement) would heighten interest.
The initial upside could target $3.50–$4.00, with the potential to retest at $5.00 if momentum continues in a constructive, broader market.
However, risk management remains critical. Traders should secure profits near resistance and rely on volume to sustain movements, employing trailing stops or staged exits to guard against sudden reversals if sentiment overheats.
Downside Breakdown Toward $2 or Lower (Bear Case)
Negative catalysts, such as disappointing ecosystem developments, macro risk-off, or significant insider selloffs, could trigger a high volume breach of $2.70 support.
Confirmation would arise from an RSI drop below ~35, a deepening negative MACD, and a spike in ATR indicating panic-like volatility. On-chain signals would reveal stalled or declining active address growth, token unlock events flooding exchanges, and weakening transaction metrics, indicating diminishing demand.
Social sentiment might decline (Galaxy Score falling below ~30), with engagement skewing negative and accelerating selling pressure.
In this scenario, the price could test April lows near $2.11 and psychological $2.00; breaching these could open paths toward $1.80 or lower if macro conditions remain unfavorable.
Investors should implement stop losses below key supports and consider hedging, while long-term holders evaluate whether fundamental prospects justify adding at lower levels or if risks outweigh potential gains.
SUI Price Forecast: Converging Signals at a Key Juncture
Across technical charts, on-chain metrics, and social feeds, SUI displays significant compression. The price is constrained between $2.70 support and $3.15 resistance, with EMAs overhead suggesting caution.
On-chain engagement remains robust, and social attention is high, yet uncertain. The next directional movement will depend on how catalysts interact with this squeeze.
Market participants should interpret each swing as a data signal: does the price hold near $2.70 with increasing on-chain usage? Does a listing or partnership coincide with higher Galaxy Scores and volume that drive the price above $3.15? Conversely, do token unlocks or negative macro news lead to a drop below $2.55, and if so, can on-chain stickiness or community buy-ins prevent deeper declines?
Active, real-time monitoring, which includes recalculating indicators, analyzing order book depth, and tracking sentiment flows, can refine decisions amid uncertainty.
Geopolitical or