Disclaimer: Information found on CryptoreNews is those of writers quoted. It does not represent the opinions of CryptoreNews on whether to sell, buy or hold any investments. You are advised to conduct your own research before making any investment decisions. Use provided information at your own risk.
CryptoreNews covers fintech, blockchain and Bitcoin bringing you the latest crypto news and analyses on the future of money.


After the explosive surge in Bitcoin and major altcoin prices last week, a repeat was not expected this week. The new seven days showed a positive investor sentiment, although the growth in cryptocurrency values proved more restrained.
Bitcoin
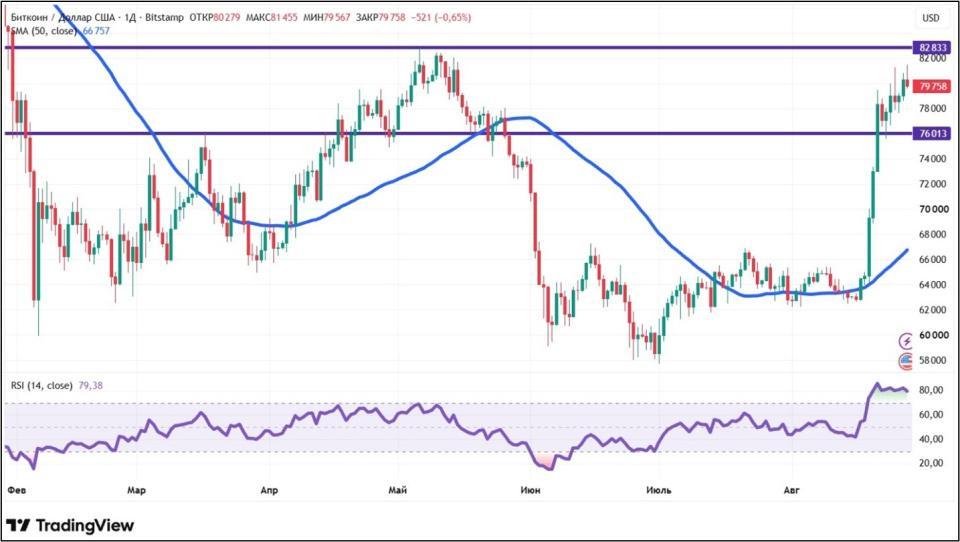
Bitcoin increased in price by 2% from August 21 to August 28, 2026. At its peak during the seven-day period, the value of the largest cryptocurrency by market capitalization exceeded $81,000. This was the highest level in more than three months. Bitcoin was last priced higher on May 15.
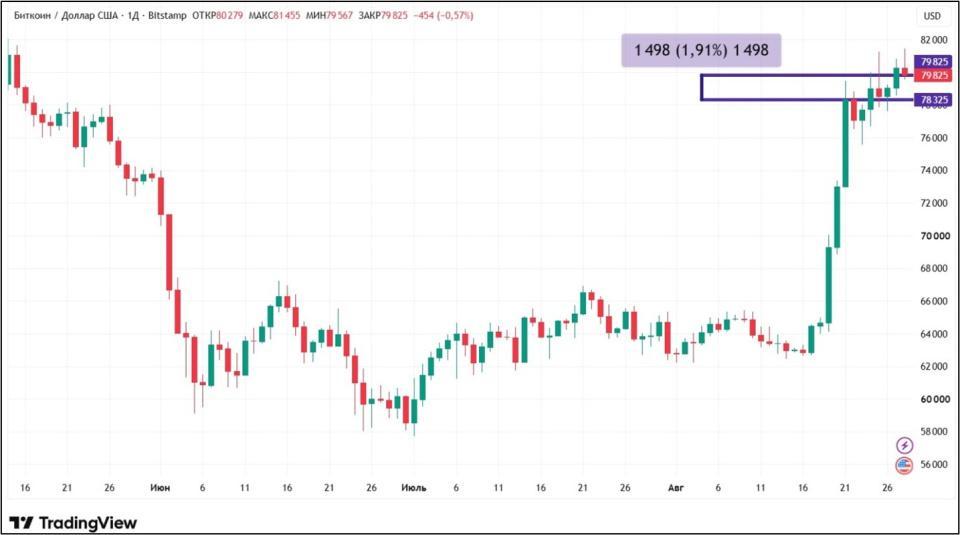
Source: tradingview.com
One of the reasons for the continued growth of BTC was increased demand from American investors. The Coinbase Premium Index, which shows the price difference for Bitcoin on Coinbase and Binance exchanges, turned positive for the first time since May. This indicates that BTC is trading at a higher price on the main American platform compared to competitors. A natural explanation is the heightened interest from the public in the United States.
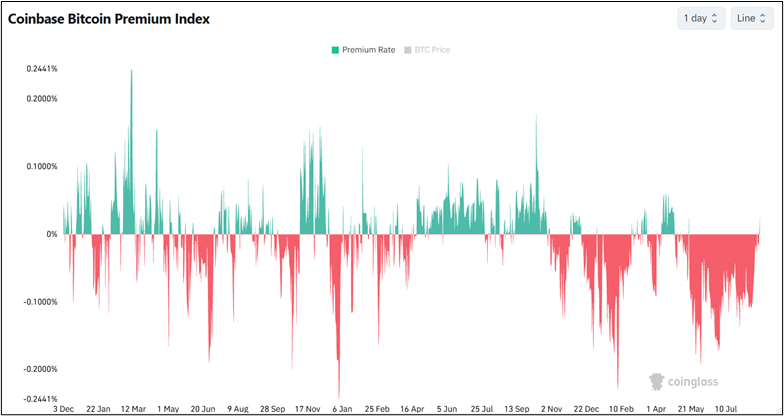
Source: coinglass.com
Another positive development for the leading cryptocurrency was the successful quarterly report from the tech giant Nvidia. The microchip manufacturer’s earnings for the three-month period amounted to $96.2 billion, which was $4 billion higher than the consensus forecast.
Spot Bitcoin ETFs have recorded fund inflows for the second consecutive week, now exceeding $1 billion. The largest amount, $971.71 million, was invested in the BlackRock fund, iShares Bitcoin Trust (IBIT).
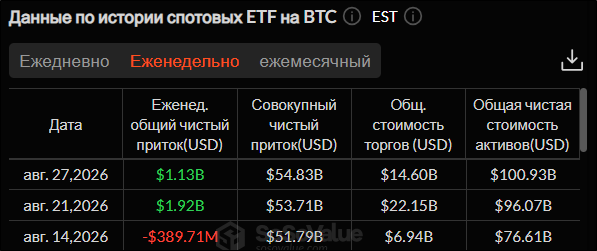
Source: sosovalue.com
From a technical analysis perspective, the Bitcoin trend is upward. This is supported by the price position above the 50-day moving average (marked in blue). The RSI indicator remains in the overbought zone, which usually signals a reversal. However, in a bull market, such as in August, this oscillator can show high values for quite a long time. At the same time, the asset’s price will not fall. The nearest support and resistance levels on the daily chart are $76,013 and $82,833, respectively.
Source: tradingview.com
The Fear and Greed Index increased by one point compared to last week, reaching 73. This value indicates that greed predominates in crypto investor sentiment.
Ethereum
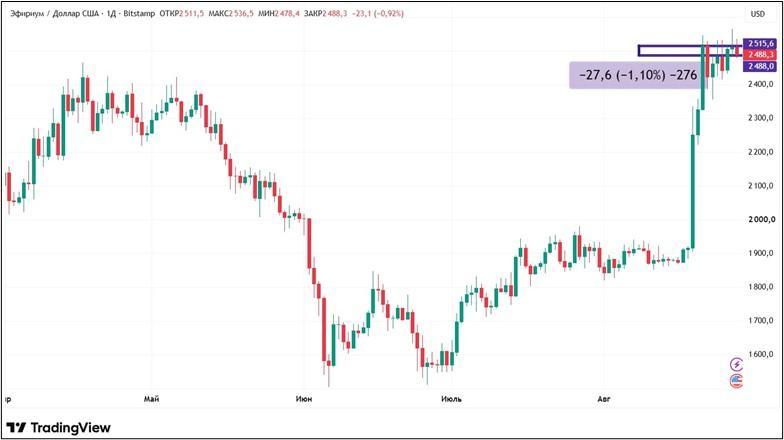
Ether decreased in price by 1.1% over the week from August 21 to August 28. For all seven days, the second-largest cryptocurrency by market capitalization traded around the important psychological mark of $2,500, sometimes exceeding and sometimes dropping below it. Ether’s volatility was significantly lower compared to the previous week.
Source: tradingview.com
Analysts from the Santiment platform noted interesting statistics. According to their data, the amount of Ether on exchanges decreased by 1.41 million coins, or 18%, over the summer. ETH was withdrawn from trading platforms both during price drops and during periods of growth. In contrast, Bitcoin reserves on exchanges increased by 0.25%.
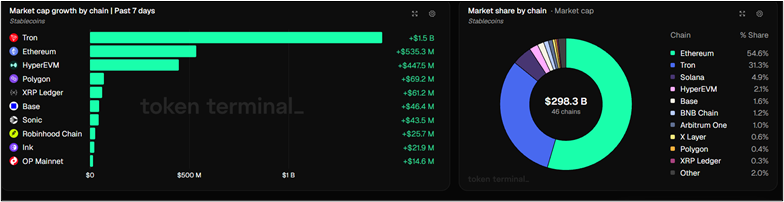
Ether continues to receive support from its dominant position in the stablecoin sector. More than half of tokens pegged to national currencies are on the Ethereum network. Over the past week, the market capitalization of stablecoins on the Ethereum blockchain increased by $535.3 million.
Source: tokenterminal.com
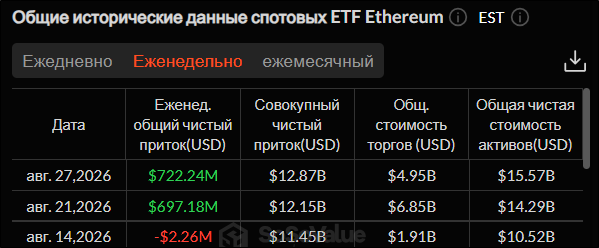
Spot Ethereum ETFs have recorded fund inflows for the second consecutive week. This time, the inflow amounted to $722.24 million. The majority of this sum, $483.24 million, went to the BlackRock fund, iShares Ethereum Trust (ETHA).
Source: sosovalue.com
Related Posts
From a technical analysis perspective, the Ethereum trend is upward. This is supported by the formation of a “golden cross” on the daily chart—a bullish pattern characterized by the faster 50-day weighted moving average (marked in blue) crossing above the slower 200-day moving average (marked in orange) from bottom to top. ETH managed to hold above the resistance level of $2,465.9. This level has now become a support level. The new resistance level is $2,621 (the mark where the decline stopped in autumn 2025).
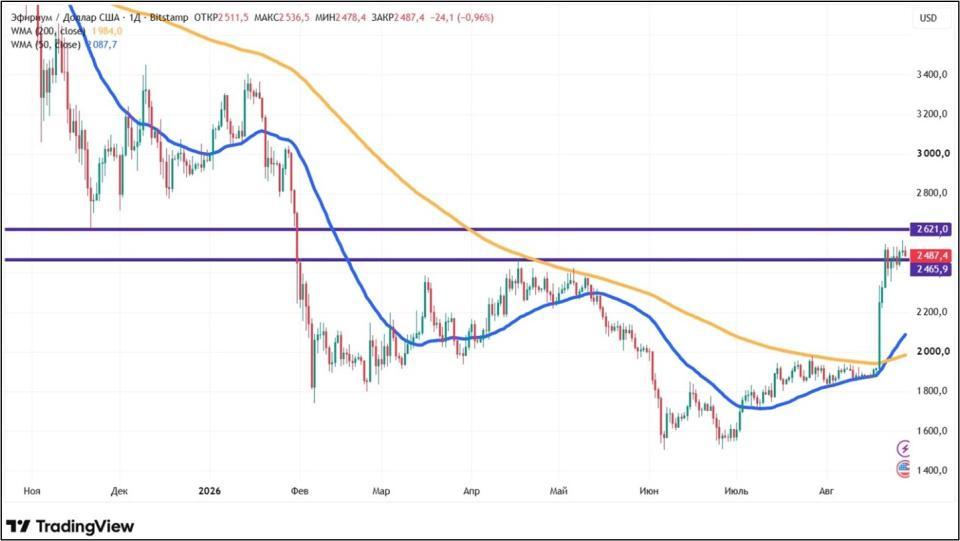
Source: tradingview.com
Solana
Solana gained 14.79% over the past seven days. The catalysts for this dynamics were several updates that are expected to cause significant changes in the tokenomics of this cryptocurrency.
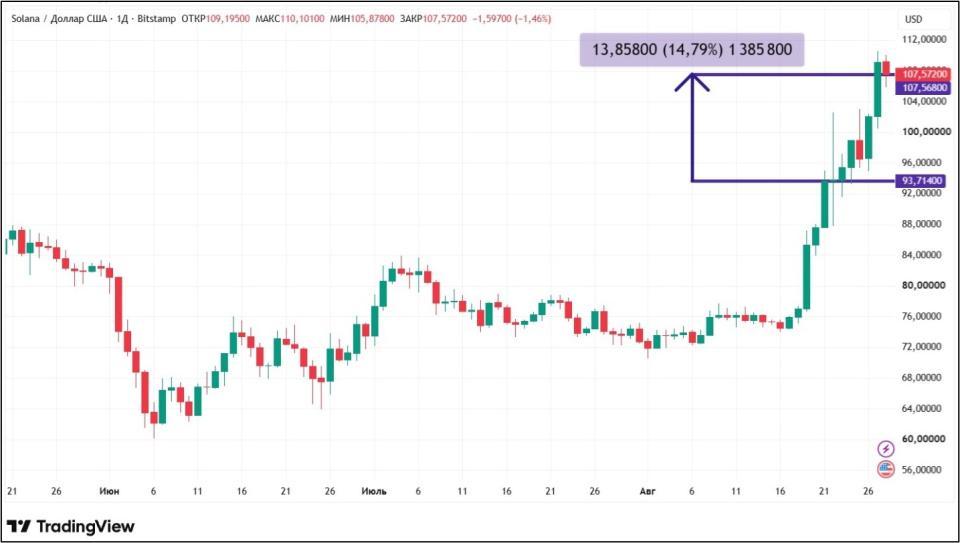
Source: tradingview.com
First, there is the proposal SIMD-550, which aims to increase the disinflation rate from 15% to 30%. In absolute numbers, this will result in a reduction of SOL issuance by 18.9 million coins over the next six years.
Second, there is SIMD-553, which serves to split the fee into two parts: a fixed fee (directed to the block creator) and a resource fee (tied to the volume of capacity used in the transaction—which should be completely burned). If the change is approved, this will allow the level of burned SOL to increase almost fourteenfold, from 650 to 9,000 per day.
Both update proposals must receive at least 2/3 of the stake from a qualified majority of participating voters to be approved. Currently, only SIMD-550 is receiving the necessary minimum for approval. However, this could change as voting continues.
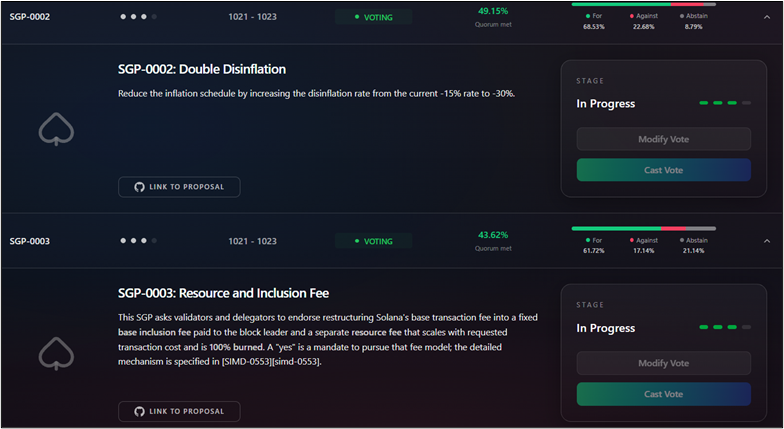
Source: governance.solana.com
Solana was also supported by spot ETFs for this cryptocurrency, which recorded a weekly fund inflow of $135.79 million. The majority of this sum, $88.28 million, went to the Bitwise fund, Bitwise Solana Staking ETF (BSOL).
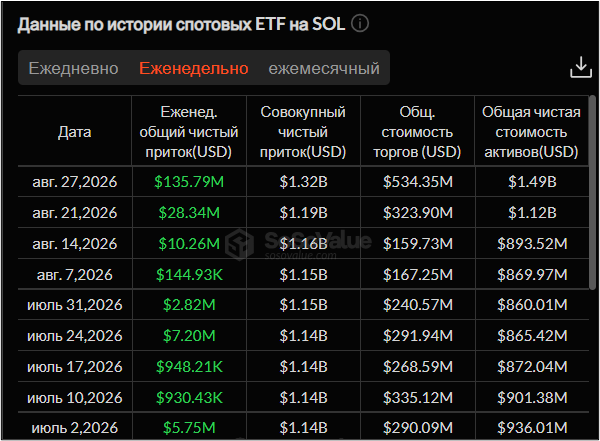
Source: sosovalue.com
Zcash
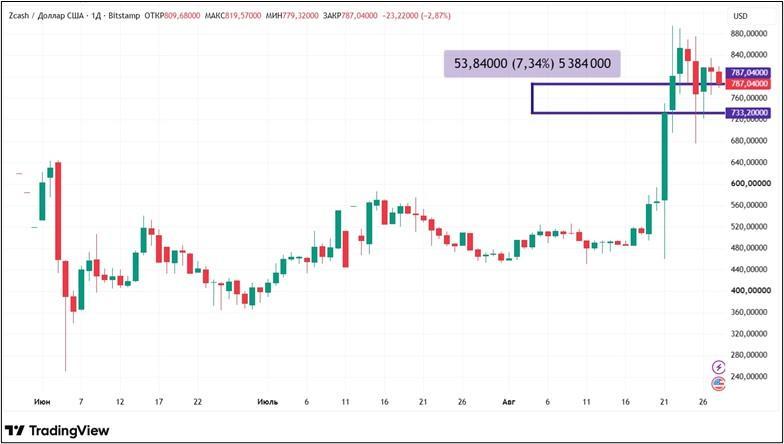
Zcash updated its eight-year high, coming close to $900 at one point. The excitement around the private cryptocurrency is associated with the launch of the first spot ETF for ZEC. The exchange-traded fund became the Grayscale Zcash Trust (ZCHS), converted from a trust by Grayscale. As often happens, investor interest peaked before the direct start of trading, and enthusiasm dropped immediately after. Consequently, by the end of the seven days, Zcash gained a modest 7.34%.
Source: tradingview.com
Uniswap
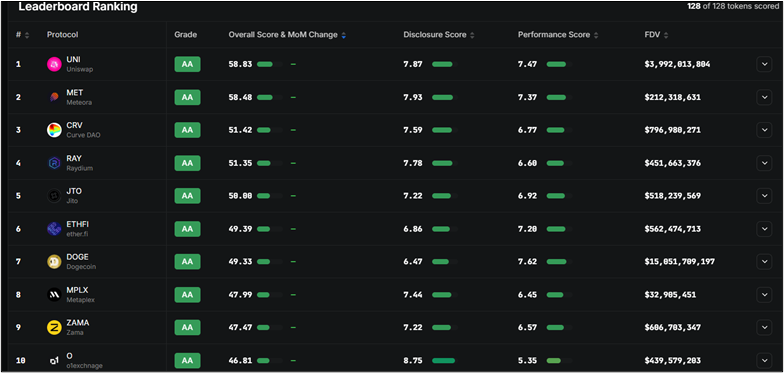
Uniswap took first place in a new rating by the analytical portal DefiLlama and the Web3 bank Forgd. The rating is based on assessments from CCC to AAA. Initially, Uniswap received the maximum possible rating—AAA. However, the rating owners later downgraded it to AA. Uniswap’s overall score is 58.83. Besides UNI, only one project, Meteora, has a score above 55.
Source: defillama.com
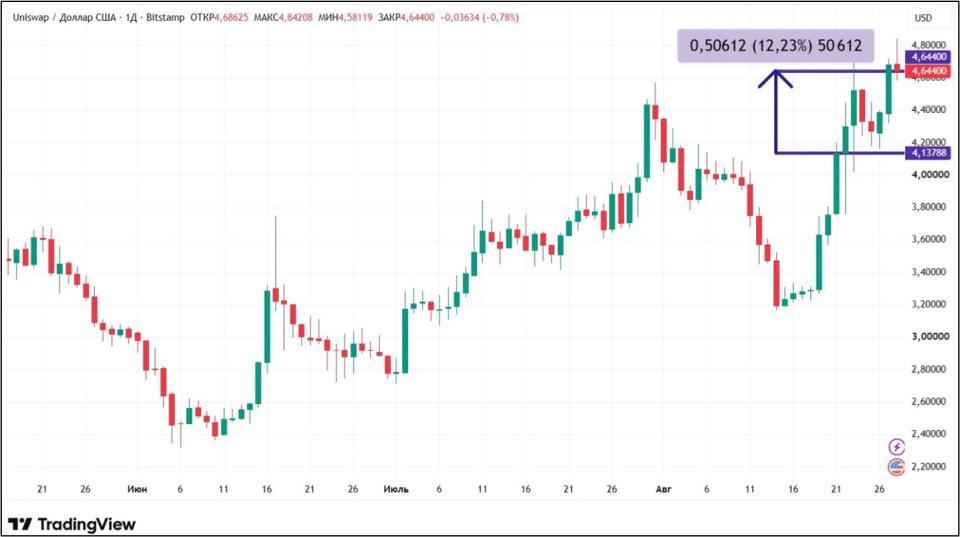
Leadership in the new rating positively affected the price of Uniswap. Over seven days, from August 21 to August 28, the value of UNI increased by 12.23%.
Source: tradingview.com
Conclusion
The last full week of summer passed for cryptocurrencies predominantly on a positive note. The price growth of each individual coin was explained by specific reasons unique to it, without a clear general pattern.
This material and the information contained herein do not constitute individual or other recommendations. The editorial opinion may not coincide with the opinions of analytical portals and experts.
