Disclaimer: Information found on CryptoreNews is those of writers quoted. It does not represent the opinions of CryptoreNews on whether to sell, buy or hold any investments. You are advised to conduct your own research before making any investment decisions. Use provided information at your own risk.
CryptoreNews covers fintech, blockchain and Bitcoin bringing you the latest crypto news and analyses on the future of money.
Bitcoin’s (BTC) recent surge has paused for a few days, yet its robust performance in 2023 has attracted attention. A survey conducted by crypto firm Paxos among financial services companies in the United States revealed that 99% of these firms are focusing on crypto projects this year at least as much as, if not more than, in prior years.
Analysts are becoming increasingly optimistic about Bitcoin and the broader crypto market in 2024. Ryan Rasmussen, a senior research analyst at Bitwise, shared ten forecasts for the crypto sector in 2024 in a post on X (formerly Twitter) on December 13. He anticipates that Bitcoin will reach $80,000 in 2024 and that “more transactions will be settled using stablecoins than through Visa.”
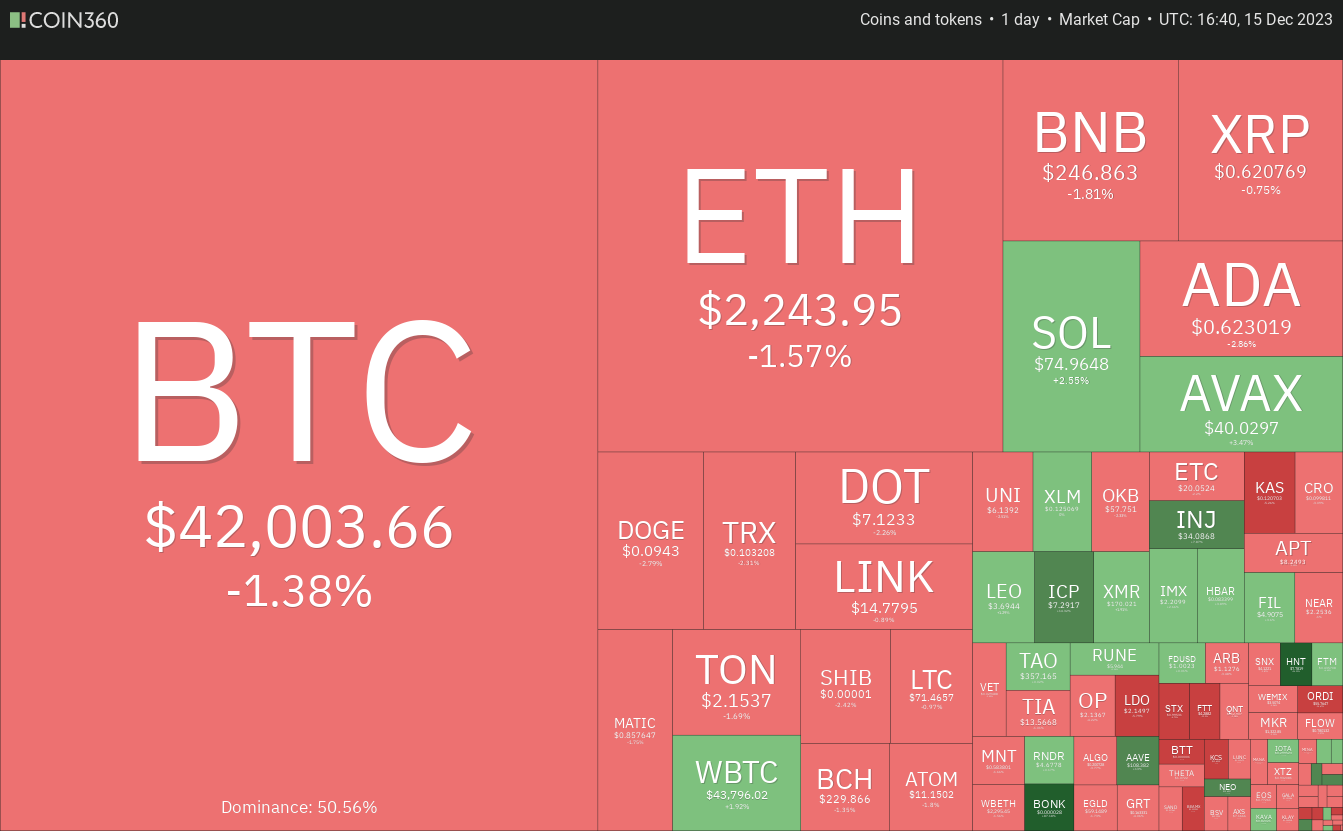 Daily cryptocurrency market performance. Source: Coin360
In addition to crypto-specific factors, the anticipation of interest rate reductions by the Federal Reserve in 2024 is contributing to the positive sentiment. Arthur Hayes, the former CEO of the crypto exchange BitMEX, reaffirmed his bullish stance on crypto in a post on X on December 14, stating that fiat currency was “a filthy piece of trash” and that there was no reason not to be optimistic about crypto.
What are the critical support levels that could halt declines in Bitcoin and altcoins? Let’s examine the charts of the top 10 cryptocurrencies to determine this.
Bitcoin price analysis
Bitcoin has been trading between the downtrend line and the 20-day exponential moving average ($41,221) for the last few days. This constriction in price action indicates that a breakout from this range may occur in the near term.
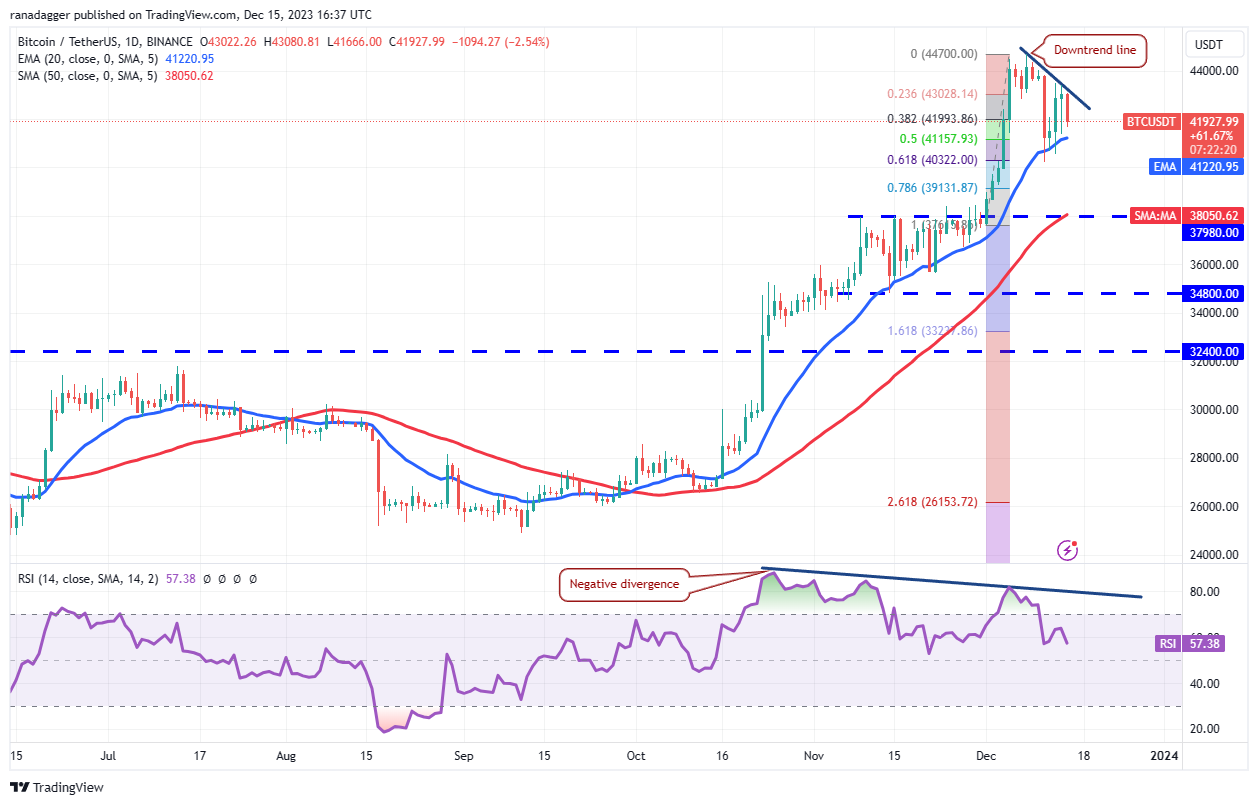 BTC/USDT daily chart. Source: TradingView
If the price declines and falls below the 20-day EMA, it will indicate that bulls are actively taking profits. This could lead the BTC/USDT pair down to the 50-day simple moving average ($38,050), which buyers are expected to defend vigorously.
Ether price analysis
Ether (ETH) bounced off the $2,200 support on December 13, but the subsequent relief rally is encountering selling pressure near $2,332. This indicates that bears are selling during rallies.
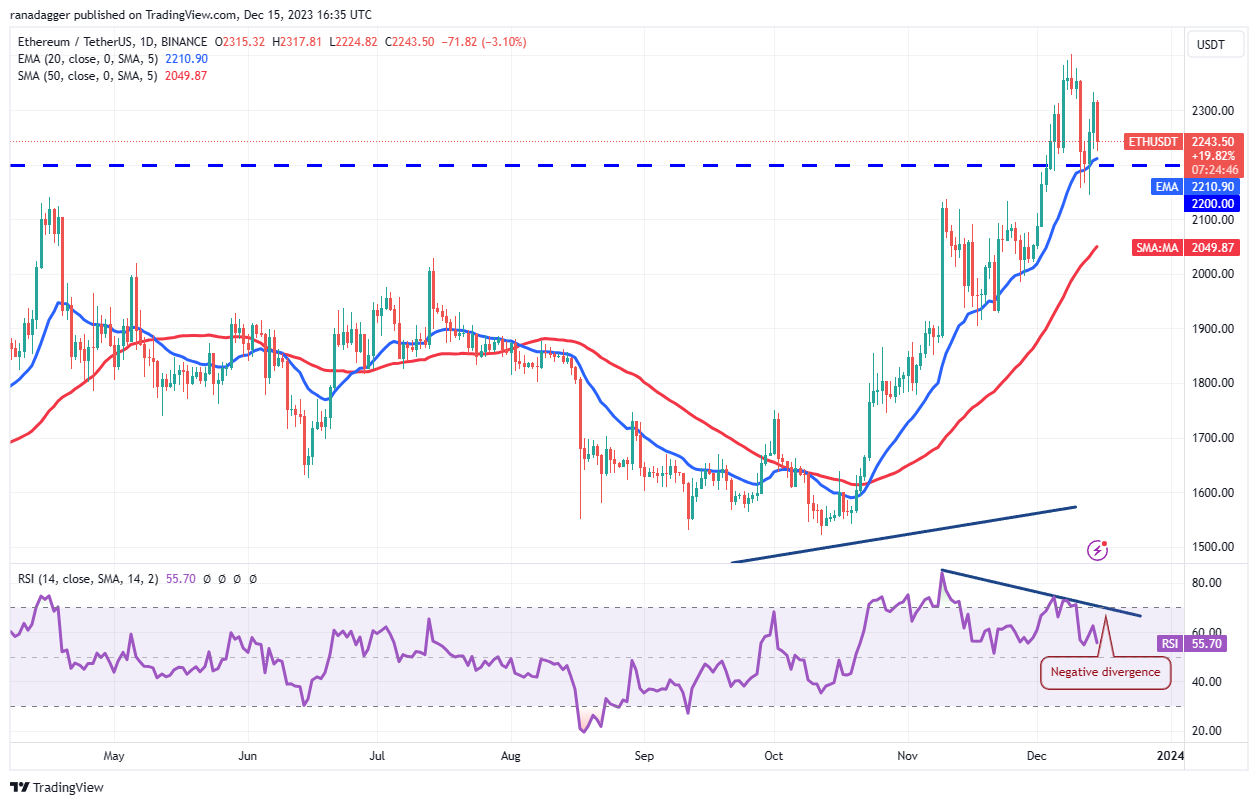 ETH/USDT daily chart. Source: TradingView
The negative divergence on the RSI suggests that bullish momentum is waning. Sellers will attempt to strengthen their position by driving the price below $2,200. If successful, the ETH/USDT pair could drop to the 50-day SMA ($2,049) and subsequently to the strong support at $1,900.
On the other hand, if the price rebounds from $2,200, it will indicate that bulls have converted this level into support, increasing the likelihood of a rally to $3,000.
BNB price analysis
The bulls are facing challenges in pushing BNB (BNB) above the overhead resistance at $260, but a slight positive is that they have not surrendered ground to the bears.
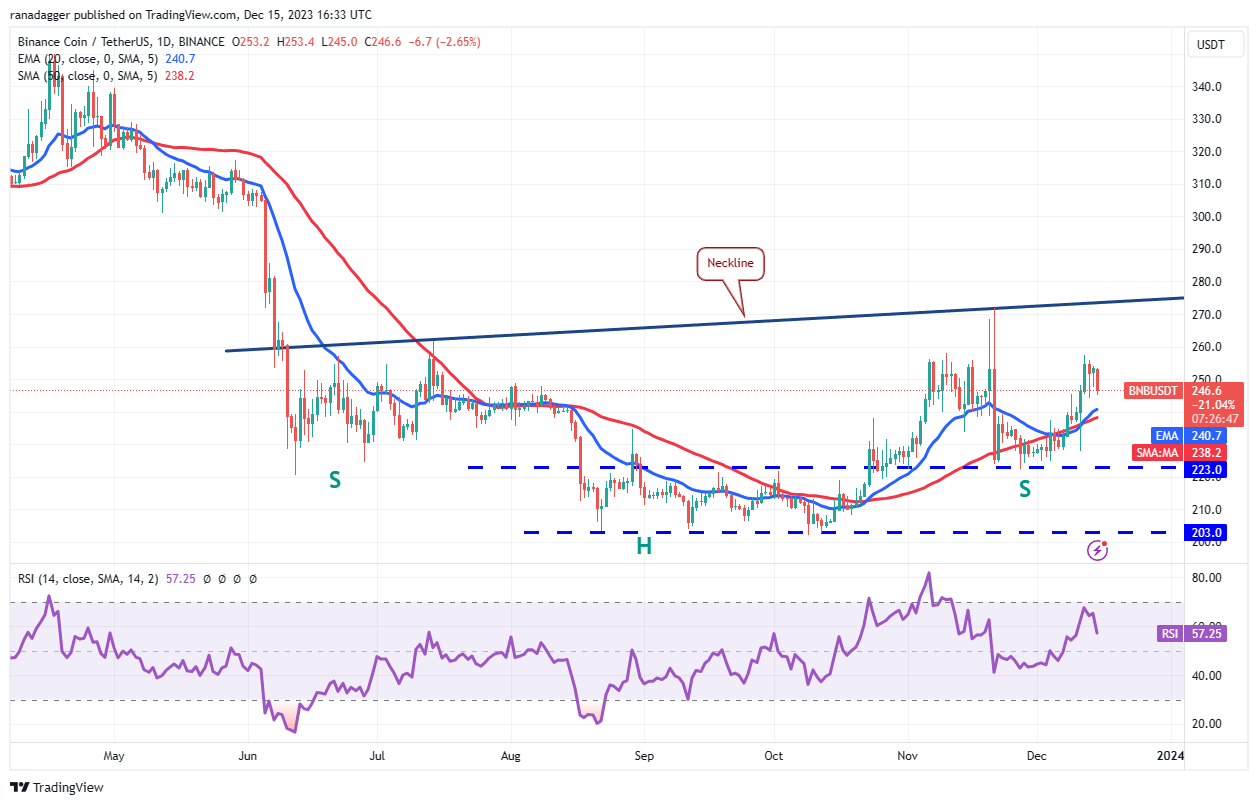 BNB/USDT daily chart. Source: TradingView
The gradually rising 20-day EMA ($240) and the RSI in positive territory indicate an advantage for buyers. If the price rises from the current level or rebounds off the 20-day EMA, the bulls will again attempt to push the price to the neckline of the inverse head-and-shoulders pattern.
However, if the price falls below the moving averages, it will suggest that bulls are losing their grip. The pair may then decline to the strong support at $223, indicating a range-bound movement between $223 and $260.
XRP price analysis
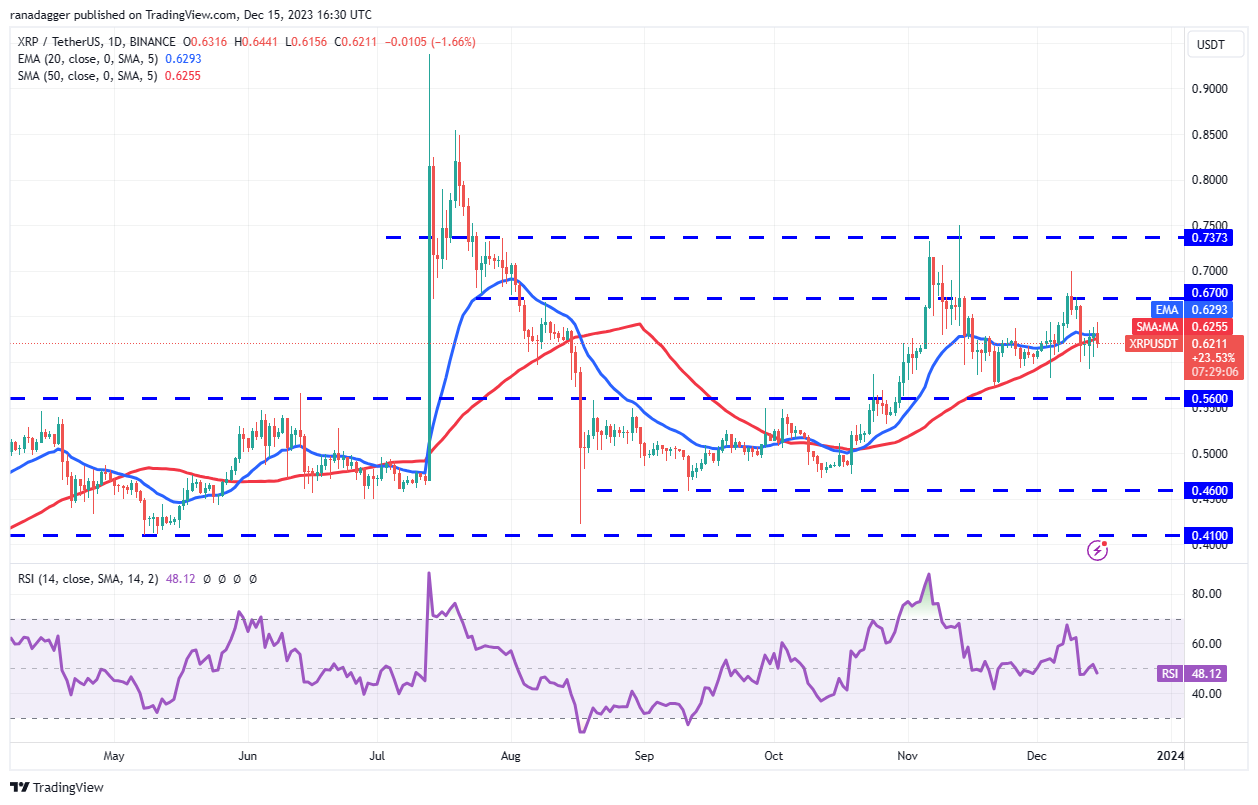
XRP (XRP) is experiencing a tough contest between bulls and bears at the moving averages.
 XRP/USDT daily chart. Source: TradingView
The flat 20-day EMA ($0.63) and the RSI near the midpoint indicate a balance between supply and demand. If the price closes below the moving averages, the XRP/USDT pair could drop to $0.56. This level is crucial for bulls to defend, as a break below it could pull the pair down to $0.46.
If the price rebounds from the moving averages, the pair will again attempt to rally above $0.67. If successful, the pair could surge to $0.74, where bears are expected to mount a strong defense.
Solana price analysis
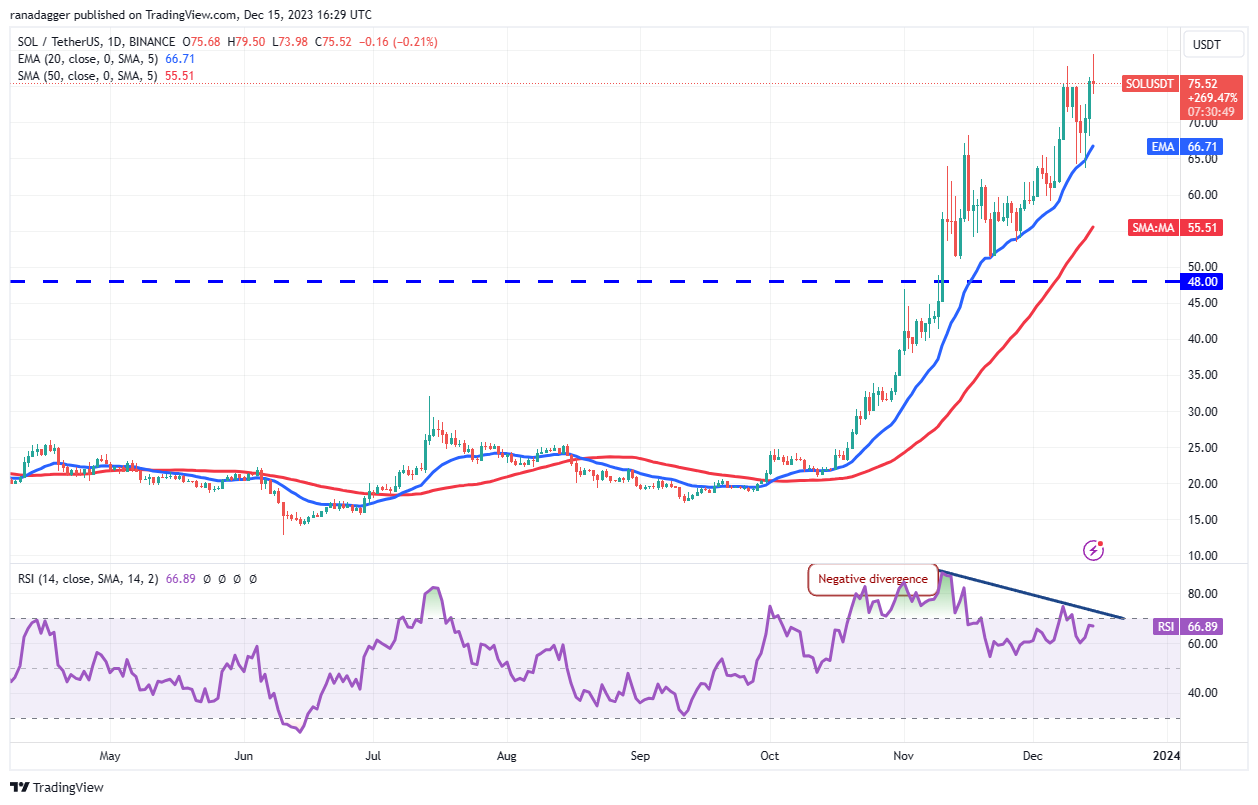
Solana (SOL) bounced off the 20-day EMA ($66) on December 13 and rose above the overhead resistance at $78 on December 15.
 SOL/USDT daily chart. Source: TradingView
If buyers can sustain the breakout, the SOL/USDT pair is likely to rise to the psychological level of $100. The upsloping moving averages indicate an advantage for bulls, but the negative divergence on the RSI warns that bullish momentum may be diminishing.
Related Posts
The key support to monitor on the downside is the 20-day EMA. A break and close below this level could trigger stop-loss orders for several short-term traders, potentially leading to a pullback to the 50-day SMA ($55).
Cardano price analysis
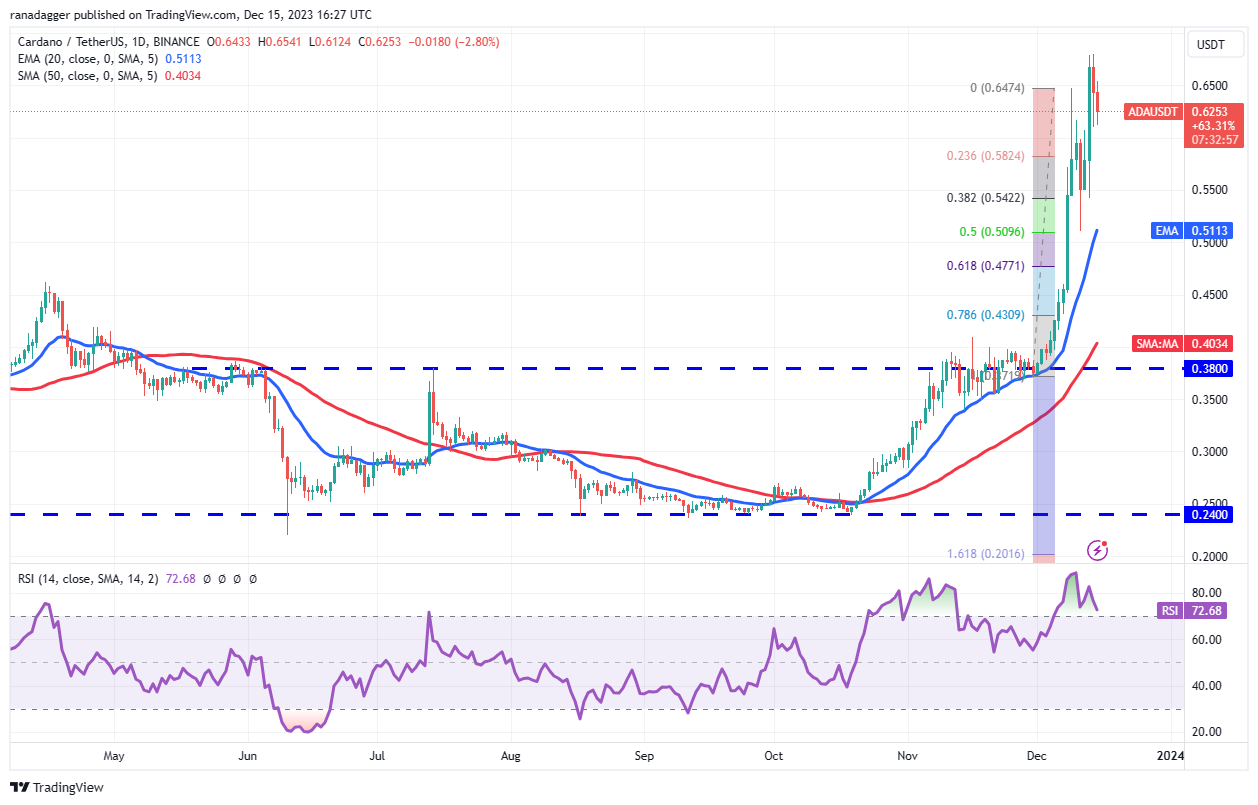
Cardano (ADA) rebounded from the 50% Fibonacci retracement level of $0.51 on December 11 and surged above $0.65 on December 13.
 ADA/USDT daily chart. Source: TradingView
If buyers can maintain the price above $0.65, the ADA/USDT pair could reach $0.70 and subsequently $0.78. However, the potential for a correction is significant, as the RSI has been in the overbought zone for several days.
The first indication of weakness will be a decline below $0.61, which may initiate a pullback toward the 20-day EMA ($0.51). This remains a critical level to monitor, as a break below it would signal a trend change in the near term.
Dogecoin price analysis
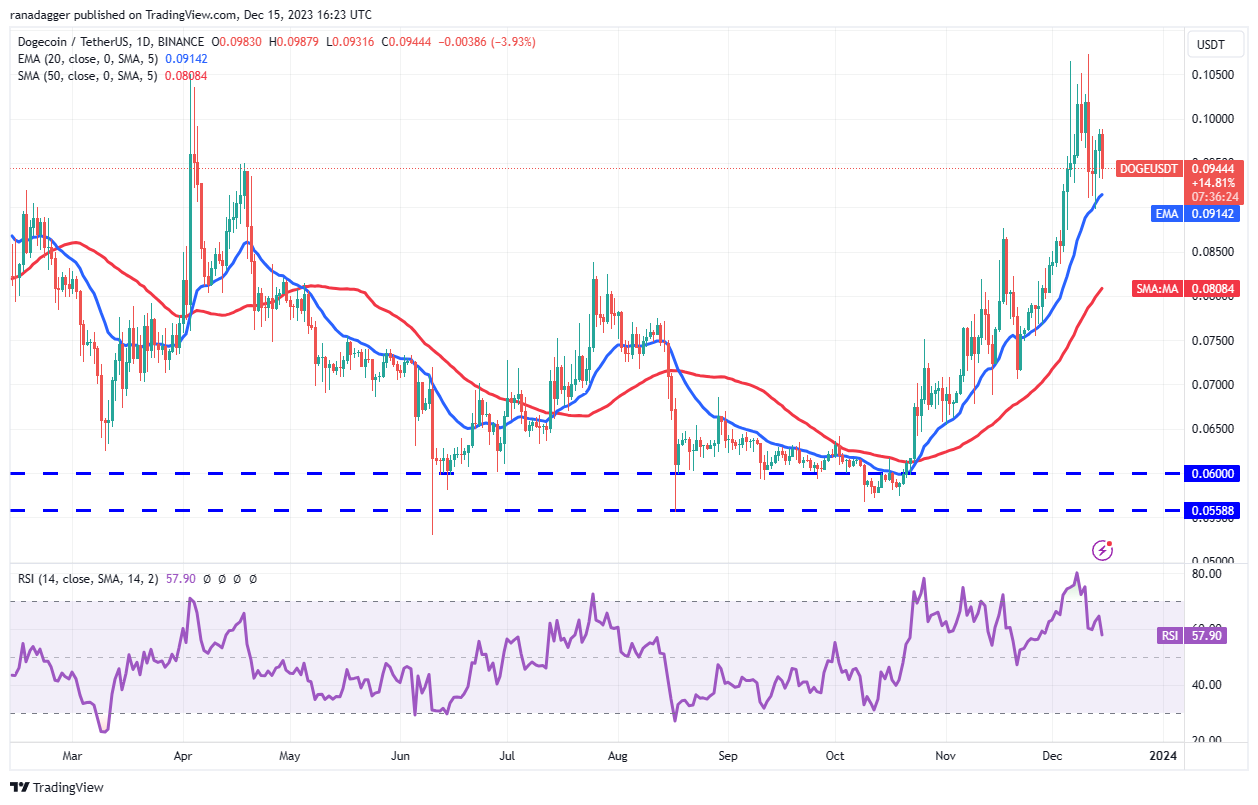
Dogecoin (DOGE) bounced off the 20-day EMA ($0.09) on December 13, but bulls are struggling to push the price above the $0.10 mark.
 DOGE/USDT daily chart. Source: TradingView
Bears will attempt to pull the price below the 20-day EMA. If successful, selling pressure could increase, and the DOGE/USDT pair may decline to the 50-day SMA ($0.08). This level may provide support, but if breached, the pair could fall to $0.07.
Both moving averages are trending upward, and the RSI is in positive territory, indicating that buyers have the advantage. If the price rebounds from the 20-day EMA, it will suggest that bulls continue to buy the dips, increasing the likelihood of a rally to $0.11.
Related: US dollar hits 4-month low as Bitcoin trader predicts 10% drop to come
Avalanche price analysis
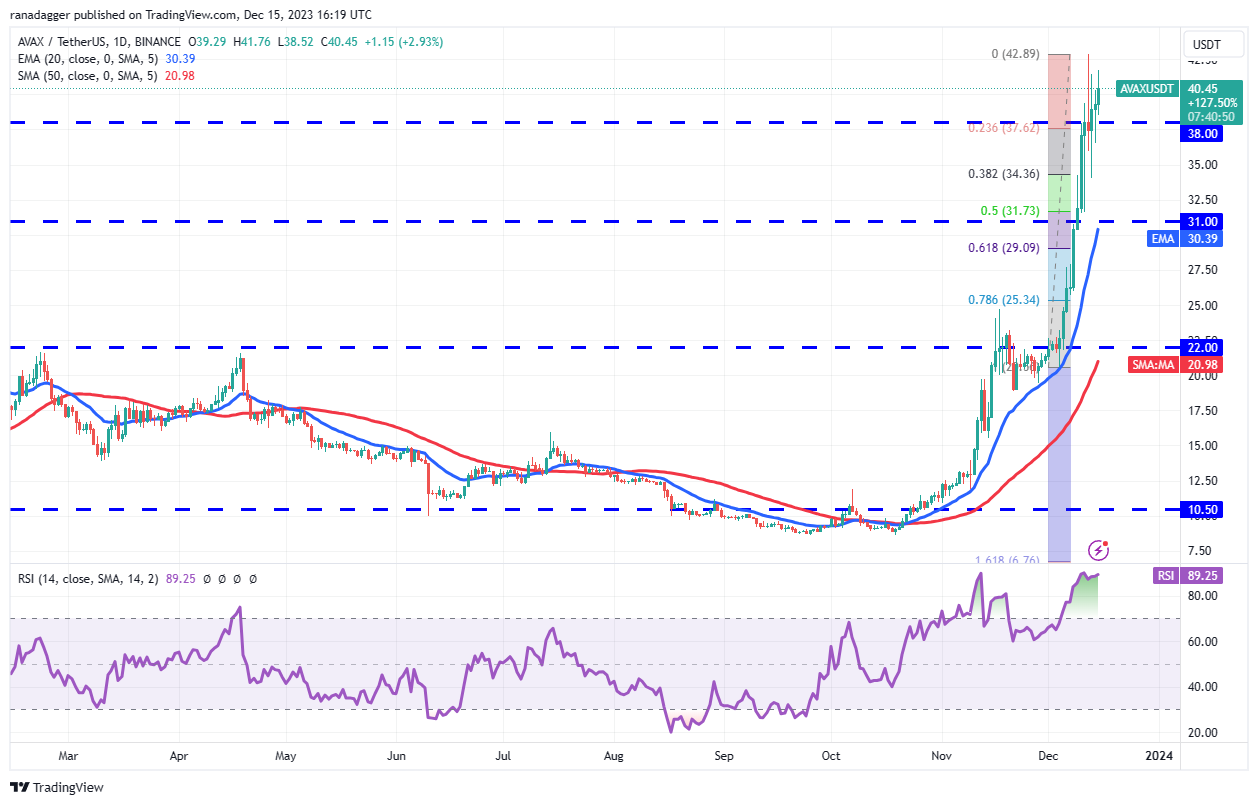
Avalanche (AVAX) rebounded from the 38.2% Fibonacci retracement level of $34.36 on December 13, indicating that buyers are not waiting for a deeper correction to make purchases.
 AVAX/USDT daily chart. Source: TradingView
The bulls are attempting to push the price above the overhead resistance of $42.89. If they succeed, the AVAX/USDT pair could initiate the next phase of the uptrend, with the next targets being $50 and then $70.
The risk to the upside is that the RSI is currently in overbought territory, suggesting that the pair may be susceptible to a correction or consolidation in the short term. If the price declines from $42.89, the pair could fall to the 20-day EMA ($30.40).
Polkadot price analysis
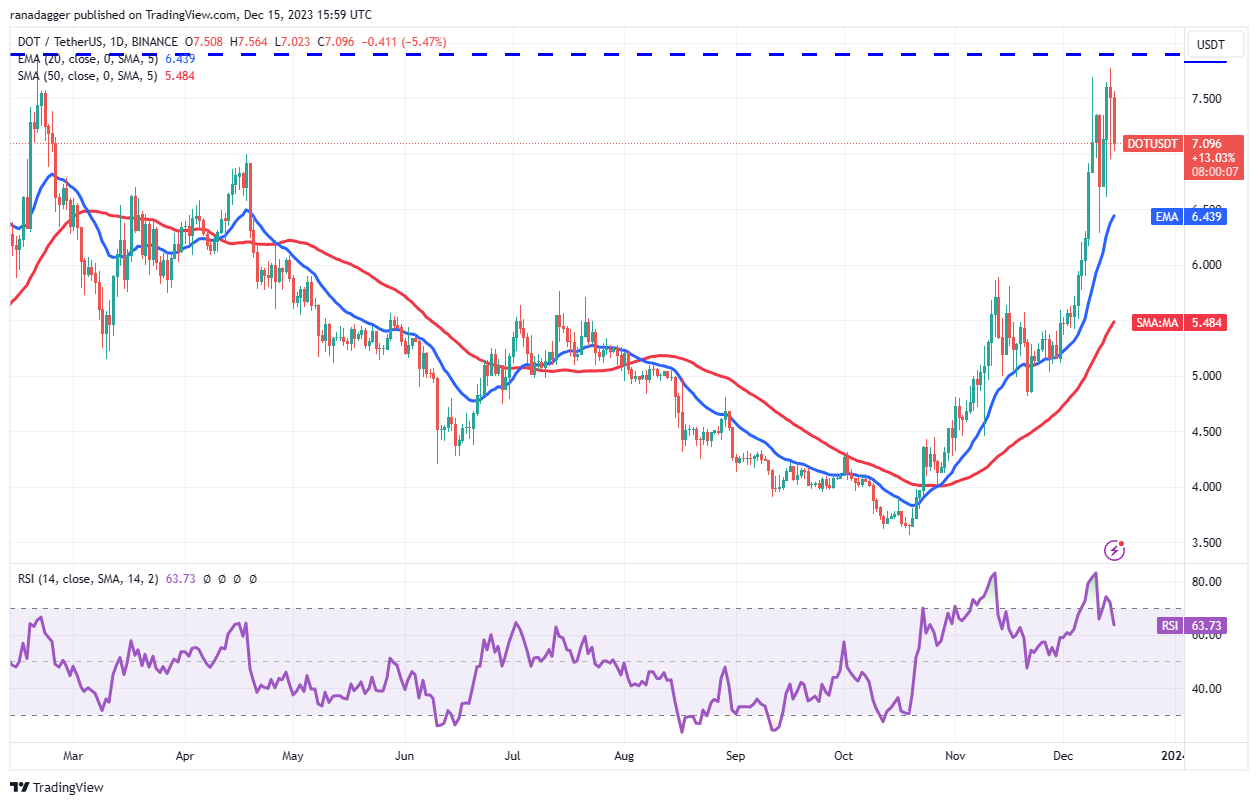
The bulls made another attempt to push Polkadot (DOT) above the overhead resistance of $7.90 on December 14, but bears maintained their position.
 DOT/USDT daily chart. Source: TradingView
The repeated inability of bulls to overcome the overhead resistance may have prompted short-term traders to take profits. Although bulls bought the dip on December 14, they could not sustain higher levels. Renewed selling on December 15 is threatening to push the DOT/USDT pair down to the 20-day EMA ($6.43).
A strong rebound from the 20-day EMA will indicate that sentiment remains positive. The bulls will then attempt to drive the pair back to $7.90. The short-term trend will turn bearish if the price breaks below the 20-day EMA.
Polygon price analysis
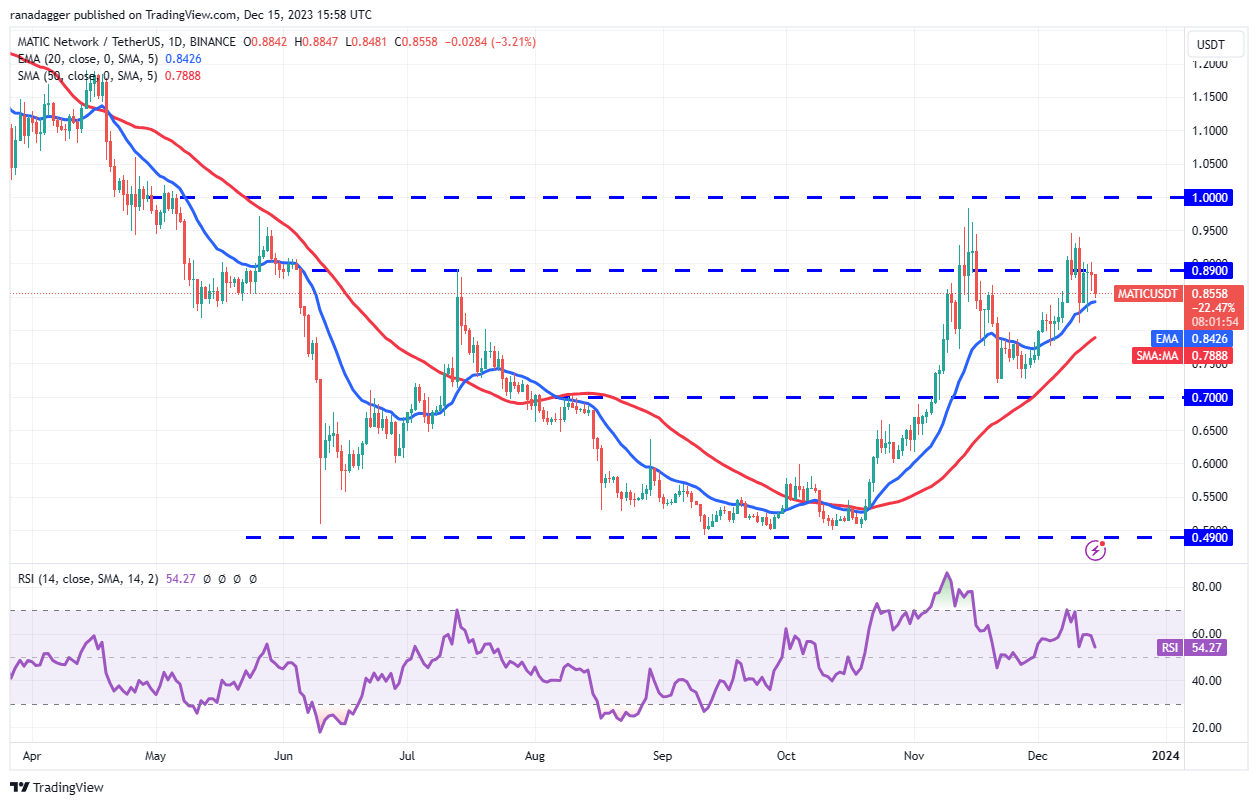
Polygon (MATIC) has been trading around $0.89 since December 12, but bulls have been unable to push the price above this resistance, indicating that bears are actively defending the level.
 MATIC/USDT daily chart. Source: TradingView
The 20-day EMA ($0.84) is a crucial support level to monitor. If the price rebounds from the 20-day EMA, it will suggest that lower levels are being purchased, improving the chances of a rally above $0.89. If this resistance is surpassed, the MATIC/USDT pair could rise to $1.
Conversely, if the price falls below the 20-day EMA, it will indicate that bulls have relinquished control in the short term, potentially leading to a decline to the 50-day SMA ($0.78) and subsequently to the solid support at $0.70.
This article does not contain investment advice or recommendations. Every investment and trading move involves risk, and readers should conduct their own research when making a decision.