Disclaimer: Information found on CryptoreNews is those of writers quoted. It does not represent the opinions of CryptoreNews on whether to sell, buy or hold any investments. You are advised to conduct your own research before making any investment decisions. Use provided information at your own risk.
CryptoreNews covers fintech, blockchain and Bitcoin bringing you the latest crypto news and analyses on the future of money.
After an extended period of inactivity near the critical $30K level, the price has faced considerable rejection, leading to a swift and rapid decline.
Currently, the price appears to be consolidating near the essential support level of $25K, where it may potentially find a bottom and stop further downward movements.
Technical Analysis
By Shayan
The Daily Chart
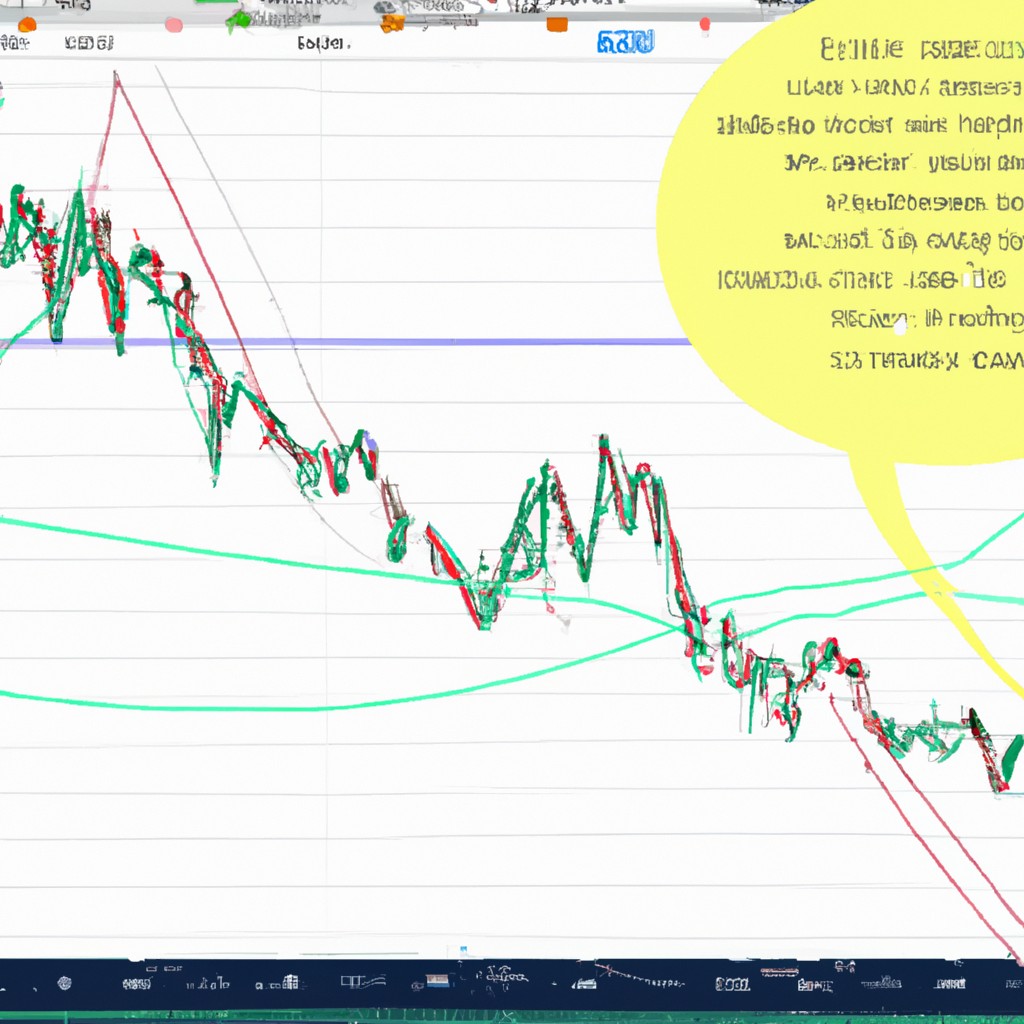
Following a brief corrective phase, during which a bearish divergence was observed between the price and the RSI indicator, Bitcoin faced a strong rejection and experienced a rapid drop. This recent downturn caused the price to breach a significant support zone that includes the 100-day and 200-day moving averages, reflecting an overall bearish sentiment in the market. Consequently, the cryptocurrency fell and reached the critical support area of $25K.
However, the price movement within this vital support zone is of considerable importance, as the $25K level has historically acted as a key psychological support. Thus, if it receives backing and experiences an increase in buying activity, market participants might anticipate a potential reversal.
On the other hand, without such support, the price could break below this support level, possibly triggering a cascading effect that drives it toward the significant support area at $20K.
Source: TradingView
The 4-Hour Chart
Related Posts
Focusing on the 4-hour chart, it is clear that the price is trapped within a defined range, fluctuating between the notable resistance at $30K and the significant support at $25K. After a rapid drop from the $30K resistance zone, BTC has now approached the lower boundary of the range, resting near the $25K support area.
Despite this decline, the $25K support level has the potential to prevent further short-term declines due to the existing demand around this critical range. As a result, a positive reaction within this defined range could pave the way for a new upward movement, driving the price toward the substantial resistance level at $30K.
Conversely, if the price falls below the $25K mark once more, the market may enter an extended bearish phase, leading to a further decline toward lower support areas.
Source: TradingView
On-chain Analysis
By Shayan
The “Exchange Whale Ratio” measures the proportion between the top 10 significant inflows and the total inflow volume on cryptocurrency exchanges. High values of this metric indicate considerable funds from major players, often referred to as “whales,” being moved into exchanges.
Currently, the Exchange Whale Ratio has increased after reaching its lowest level since February 2018, coinciding with the price experiencing a rapid decline. While a low ratio may not have an immediate effect, historical patterns indicate that its recovery often negatively impacts the price of Bitcoin.
For instance, in February 2018, as the ratio rebounded from an all-time low, the price of BTC peaked and subsequently began to decline. This highlights that a sudden increase in the ratio could potentially signal a downward trend for BTC’s price.
Source: CryptoQuant
SPECIAL OFFER (Sponsored) Binance Free $100 (Exclusive): Use this link to register and receive $100 free and 10% off fees on Binance Futures first month (terms).
PrimeXBT Special Offer: Use this link to register & enter CRYPTOPOTATO50 code to receive up to $7,000 on your deposits.
Disclaimer: Information found on CryptoPotato is those of writers quoted. It does not represent the opinions of CryptoPotato on whether to buy, sell, or hold any investments. You are advised to conduct your own research before making any investment decisions. Use provided information at your own risk. See Disclaimer for more information.
Cryptocurrency charts by TradingView.