Disclaimer: Information found on CryptoreNews is those of writers quoted. It does not represent the opinions of CryptoreNews on whether to sell, buy or hold any investments. You are advised to conduct your own research before making any investment decisions. Use provided information at your own risk.
CryptoreNews covers fintech, blockchain and Bitcoin bringing you the latest crypto news and analyses on the future of money.
The Ethereum price encountered the significant $2,160 resistance level yesterday, and after attempting to end a notable six-month losing streak, ETH USD appears to have been rejected and is now trading below $2,100.
Current price movements are highly volatile, with ETH declining by -1.6% in the past 24 hours to hover around $2,080, leaving traders caught between a possible breakout and a typical bull trap.
While bullish momentum is emerging on shorter timeframes, numerous European trading desks are cautioning about a classic bull trap setup, a scenario that entices buyers before driving the price to new lows.
With the asset positioned at a pivotal point, this upcoming weekend could determine the Ethereum trend for the rest of Q1 2026.
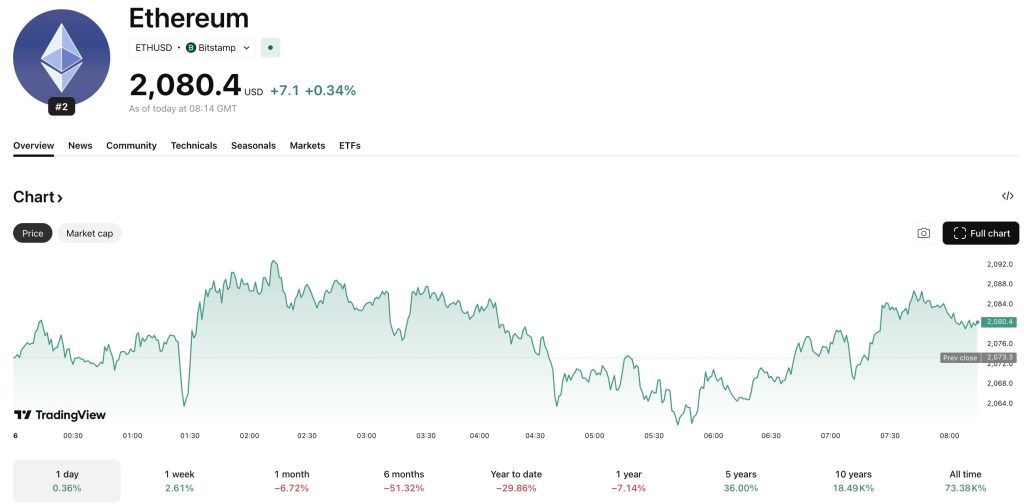 SOURCE: TradingView
Ethereum Price Analysis: What’s Next After $2,160 Rejection?
While the 12-hour timeframe hints at a significant reversal pattern that has bulls eager, Ethereum must maintain its position above $2,000. A daily close above this threshold would validate the inverse Head and Shoulders pattern, with the neckline firmly established at the critical $2,160 level.
Supporting the bullish argument is a distinct divergence in the Relative Strength Index (RSI), which has been recording higher lows while the price has consolidated. This shift in momentum indicates that sellers may finally be losing steam.
If buyers can protect the $2,000 area and surpass the $2,160 resistance level, the immediate path of least resistance would shift upward, aiming for the 200-day moving average.
However, the risk of a fakeout remains considerable. Should ETH USD fail to break through this resistance and fall back below $2,000, the bullish structure would be compromised.
In such a case, the price would likely revisit the $1,900 support zone. Traders monitoring the crypto price prediction today are acutely aware that volume must support this movement, as a breakout on low volume is a strong candidate for a reversal.
Discover: The best crypto to diversify your portfolio with
On-Chain Data Shows Massive Accumulation for ETH USD: Is It Enough?
Vitalik Buterin: Ethereum’s L1 is becoming really strong. The bottleneck now is imagination & boldness at the application & cultural layer.
Stay hardcore on the fundamentals (censorship resistance, resistance to being shut down or controlled, open source, privacy, security) →… pic.twitter.com/1y24LCxq4A— Ethereum Daily (@ETH_Daily) March 6, 2026
Related Posts
On-chain data indicates robust accumulation despite chart resistance. Information from Glassnode reveals that long-term holders added 252,142 Ethereum to their portfolios in February 2026.
This “averaging down” behavior suggests that investors perceive current prices as a buying opportunity, irrespective of short-term fluctuations.
This accumulation trend aligns with updates on Ethereum’s long-term roadmap from Vitalik, enhancing confidence among institutional investors.
The gap between rising holder balances and stagnant prices often indicates a potential supply shock, provided macro conditions do not lead to liquidation.
At present, support levels are intact, with the realized price for short-term holders aligning with market prices, indicating that the capitulation phase may soon conclude.
Analysts Warn: Is This a Bull Trap?
$ETH update
Price nearing a key resistance level. Looking for a possible liquidity sweep before a bearish move. pic.twitter.com/TYkKM0k0oQ— Mona Lisa Trades
(@TradeX636) March 6, 2026
 (@TradeX636) March 6, 2026
Despite some market optimism, analysts are emphasizing significant structural risks on the weekly timeframe.
Benjamin Cowen notes that Ethereum is trading below its weekly “bull market support band,” and the 50-week and 200-week moving averages are approaching a death cross.
This has raised concerns among experienced traders that the current rally might be a “bull trap.” If resistance at $2,160 remains intact, analysts foresee a potential decline to $1,320-$1,345, a level not observed since the early accumulation phases of the last cycle.
Additionally, a new Chinese AI, Kimi, predicts volatile market conditions leading into 2026 before any sustained all-time highs can materialize.
To counter this bearish perspective, bulls require a weekly close above $2,300 on ETH USD to regain structural support; without it, the macro trend continues to appear bearish.
Discover: The hottest meme coins in crypto
The post ETH USD: Is the Ethereum Breakout a Bull Trap? appeared first on Cryptonews.