Disclaimer: Information found on CryptoreNews is those of writers quoted. It does not represent the opinions of CryptoreNews on whether to sell, buy or hold any investments. You are advised to conduct your own research before making any investment decisions. Use provided information at your own risk.
CryptoreNews covers fintech, blockchain and Bitcoin bringing you the latest crypto news and analyses on the future of money.
Bitcoin traders are currently fixated on one specific price: $50,000.
Following a severe drop that briefly saw prices dip below $60,000, many are questioning whether we have finally reached the lowest point.
Indeed, Bitcoin’s price did temporarily recover above $70,000, but the consensus remains that there is still skepticism regarding whether this is truly “the bottom.”
Key Takeaways
- Analysts caution that the recent rise to $71,000 could be a “bull trap” aimed at liquidating short positions before revisiting the $50,000 support level.
- Data from JPMorgan shows that Bitcoin has traded below the estimated miner production cost of $87,000, which historically signals capitulation.
- Technical analysis indicates significant support at $67,350, with a breakdown potentially leading to the $43,000 range.
Weekly Close Indicates Vulnerability Despite $70K Recovery
Bitcoin managed to rise to $71,000 as the week began. However, many view this rally with skepticism.
While there was a 7% rebound from last week’s $60,000 decline, volatility around the weekly close is virtually nonexistent. When the market appears too stable following a crash, traders tend to become wary.
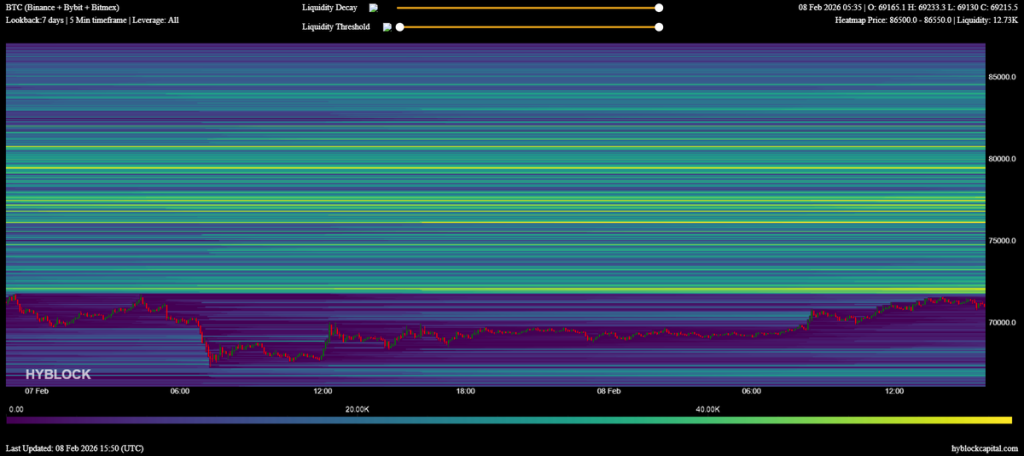 Source: Bitcoin Liquidation Heatmap / HYBLOCK
Trader CrypNuevo remarked on X that this entire upward movement seems like a strategic effort to target short positions clustered between $72,000 and $77,000.
If this “recovery” is indeed misleading, bears have a clear target in sight: $50,000.
Miner Costs and Stablecoin Inflows Indicate Caution
Related Posts
One figure that should raise concerns is $67,000. This is the cost for miners to produce a single Bitcoin.
BTC may soon be trading below that threshold. Historically, the miner production cost serves as a protective barrier, as prices typically do not remain below it for extended periods.
Avg. Bitcoin mining cost was ~$67,704 according to MARA.
Bitcoin is inexpensive here. pic.twitter.com/DvuT8aw13N— CryptoGoos (@cryptogoos) February 8, 2026
If this trend persists, miners may face financial difficulties. When miners capitulate, they often sell their Bitcoin to remain solvent, which adds further selling pressure. This creates a detrimental cycle.
Despite the bleak fundamentals, there is a substantial amount of capital waiting on the sidelines. Stablecoin inflows have recently doubled to $98 billion.
They are poised to invest… just awaiting the opportune moment.
Next Steps: Bitcoin Price Technical Levels to Monitor
 Bitcoin (BTC)24h7d30d1yAll time
Traders are facing a pivotal moment as inflation data is released this week. Currently, all attention is on $67,350, which is the support level that is maintaining stability.
If Bitcoin falls below this level, we could see bearish flag patterns that might pull prices down to $50,000. This could represent a potential decline of over 30%.
There is also a bullish scenario to consider. The key figure is $74,434. If BTC can reclaim and sustain a position above this level, it would negate the bearish setup and potentially pave the way back to $80,000.
The post BTC Traders Eye $50K as Possible Bottom: Key Metrics to Watch This Week appeared first on Cryptonews.