Disclaimer: Information found on CryptoreNews is those of writers quoted. It does not represent the opinions of CryptoreNews on whether to sell, buy or hold any investments. You are advised to conduct your own research before making any investment decisions. Use provided information at your own risk.
CryptoreNews covers fintech, blockchain and Bitcoin bringing you the latest crypto news and analyses on the future of money.

Bitcoin Never Closed Below Realized Price in 2026 Bear Market, Signaling Shallowest Bottom Since 2017

Bitcoin did not record a daily close below its realized price during the current bear market, and the June 2026 low remained above the aggregate cost basis. If the price holds above the True Market Mean near $77,000, the June low will represent the shallowest bear-market bottom in Glassnode’s comparison set dating back to 2017.
While Bitcoin’s current bear-market phase has appeared severe in headline percentage terms at times this year, the realized-price metric measures a narrower condition: whether the average holder, in aggregate, was ever underwater. During the 2018–19 and 2022–23 cycles, Bitcoin traded below the realized price for months at a stretch. This time, it did not happen even once on a closing basis.
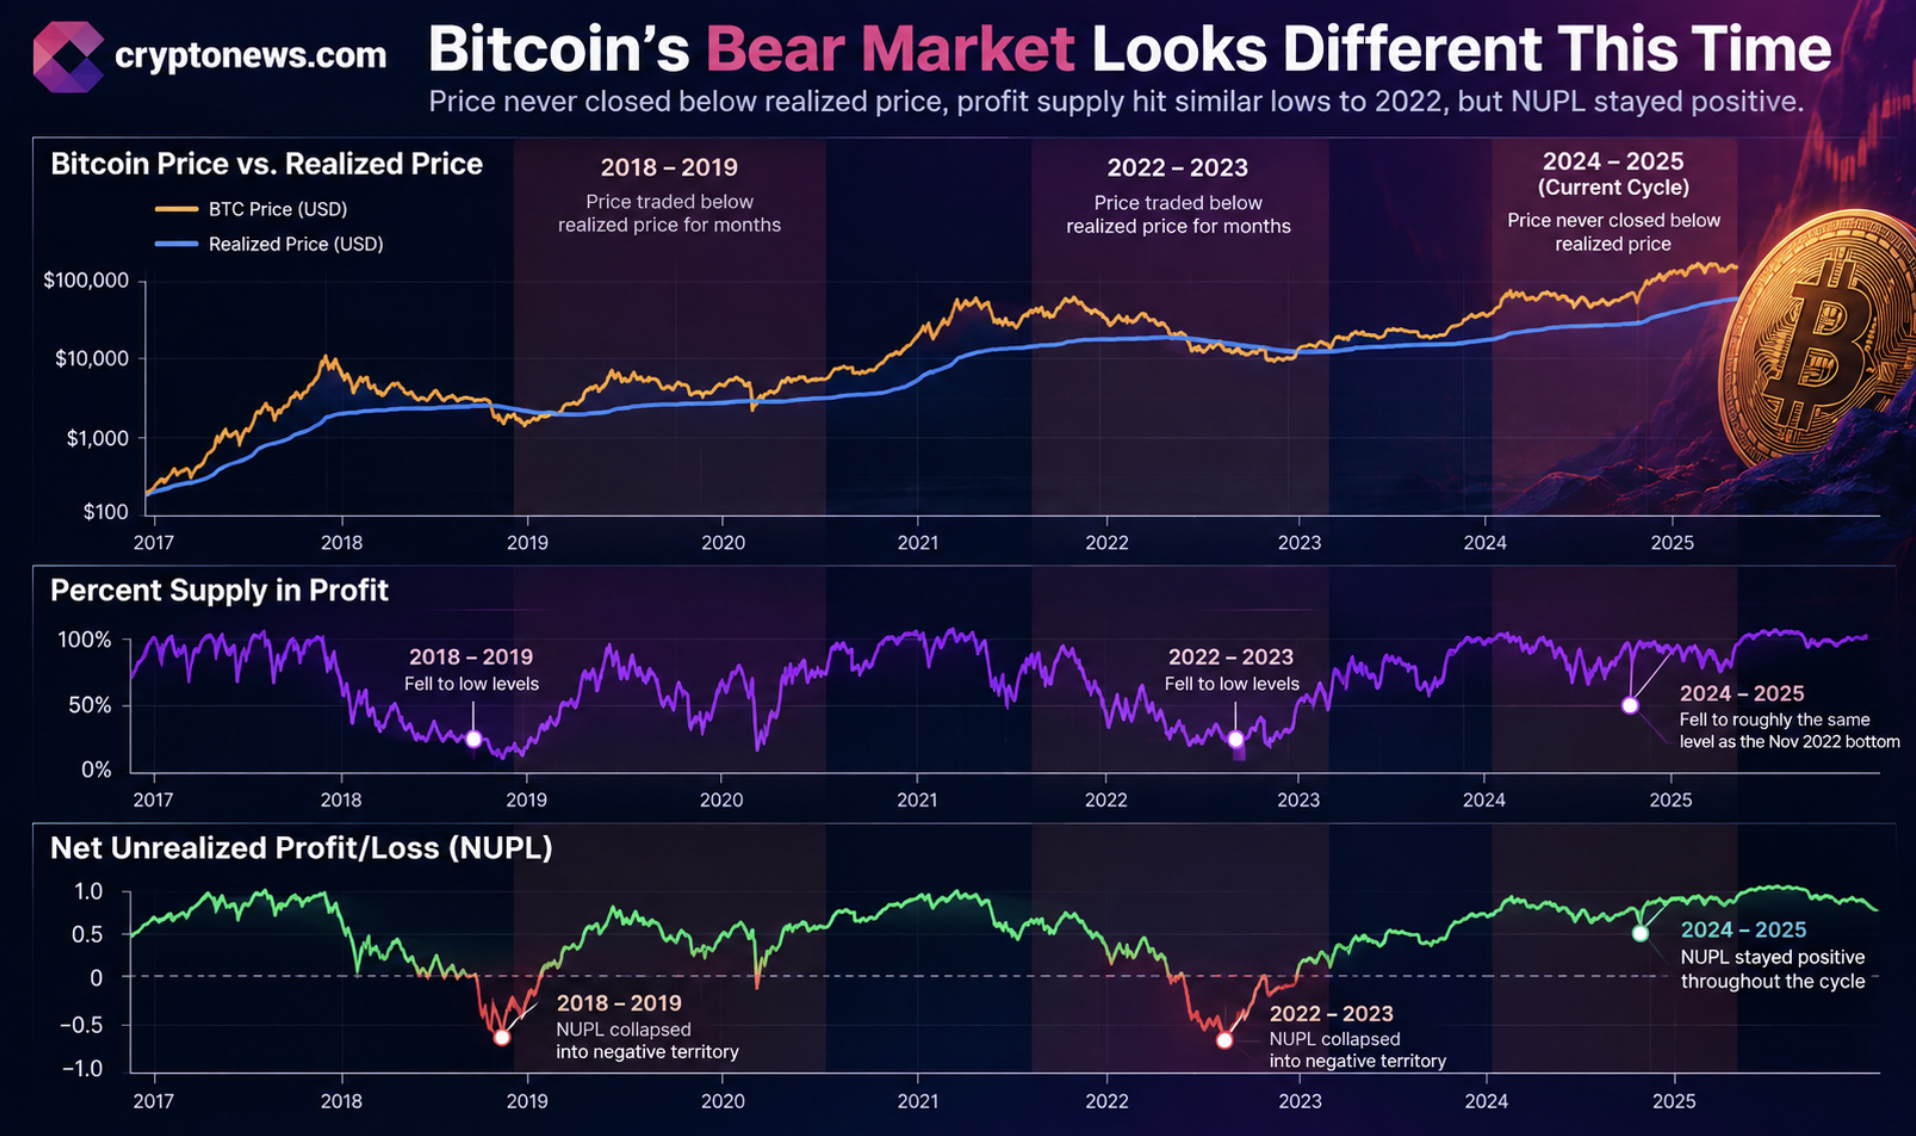
Glassnode data shows that the Percent Supply in Profit fell to roughly the same level at the June low as it did at the November 2022 bottom, indicating a comparable share of coins was sitting at a loss. The difference lies in magnitude. Net Unrealized Profit/Loss (NUPL), which tracks aggregate paper gains or losses across the entire supply, remained positive throughout the cycle. In 2018 and 2022, NUPL collapsed deep into negative territory as the market flipped into aggregate loss.
Smaller losses generally translate into less structural selling pressure, which helps explain why this drawdown did not produce the forced capitulation seen in prior cycles. This does not mean downside risk is eliminated; rather, it indicates that aggregate cost-basis damage has been narrower this time, a pattern consistent with on-chain accumulation signals that have emerged alongside this recovery.
The Levels That Decide the Thesis
Price currently trades above the True Market Mean near $77,000 and above the Short-Term Holder Cost Basis, both of which capped rallies for most of 2026. The largest nearby long-term holder supply cluster sits at $84,000–$85,000, just above the current price.
The next major resistance level is the mean MVRV price of $96,700. This is the level where the average holder’s unrealized profit returns to its long-run norm.
Options positioning on Deribit reinforces this upper boundary. Positive gamma has built up sharply near $95,000, while negative gamma sits between spot and $92,000. This suggests that dealer hedging tends to accelerate moves in the lower band and slow them as the price approaches the mean MVRV zone.
Holding above $84,000 keeps the path to $96,700 open; a drop back below it puts $77,000 back in play, and a break of that level would undermine the shallow bear-market thesis entirely.
Related Posts
Bitcoin Price, ETF Flows, and Volume
U.S. spot Bitcoin ETFs absorbed approximately $1.3 billion over the five trading days since the current squeeze began, following two weeks of net outflows. The most recent day marked the largest single inflow since early July, according to Glassnode.
This represented a meaningful reversal after a period of weakened flows and aligns with an institutional bid that did not exist during the 2018 or 2022 downturns—a structural difference worth considering against any Federal Reserve policy shifts that could swing flows in either direction.
Spot volume across exchanges more than doubled from its August trough, rising 121% since the rally began. Every prior volume expansion from late 2025 through mid-2026 occurred on a leg down, marking capitulatory selling. August broke that pattern, recording the first spike in a year to coincide with rising Bitcoin prices.

The seven-day average still sits roughly 30% below year-ago levels, indicating this is a recovery from a floor rather than a full return to 2025 conditions.
Weekly realized profit-taking during this run remains a fraction of what it was at the 2024 and 2025 tops, even though almost all short-term holders are now sitting in profit. This is the bullish reading: holders are not rushing to lock in gains despite the setup.
A rise toward the 2024–2025 realized-profit levels would signal that recent buyers are converting the rally into exit liquidity, which would be the first sign that the thesis is weakening.
This cycle’s low was the mildest since 2017, as realized-price impairment remains limited, and the market reverts to a more conventional test of support.
Discover: Best Crypto IPO this September
The post Bitcoin Never Closed Below Realized Price in 2026 Bear Market, Signaling Shallowest Bottom Since 2017 appeared first on Cryptonews.
