Disclaimer: Information found on CryptoreNews is those of writers quoted. It does not represent the opinions of CryptoreNews on whether to sell, buy or hold any investments. You are advised to conduct your own research before making any investment decisions. Use provided information at your own risk.
CryptoreNews covers fintech, blockchain and Bitcoin bringing you the latest crypto news and analyses on the future of money.
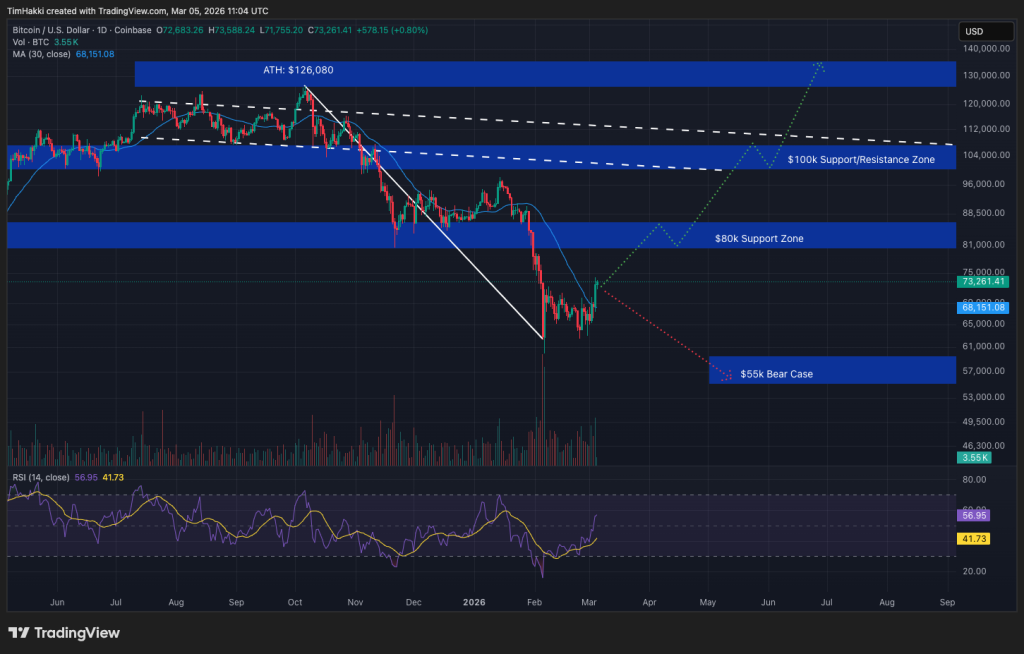
Traders are hopeful that the Bitcoin (BTC) selloff has finally run its course as prices hover around $73,000 for the first time since early February, although resistance remains present.
After bouncing back from structural support near $63,000 over the weekend earlier in March, Bitcoin has now increased by 8% over the past week and approximately 2.5% in the last 24 hours.
Market participants are particularly focused on the $74,000 mark, as it represented the peak of the post-ETF approval rally in 2024 and subsequently, the bottom of a selloff that occurred between February and April 2025, when Bitcoin fell from $100,000 to that level.
With the asset significantly up from its recent lows but facing resistance, the next 48 hours are likely to determine the trend for the remainder of Q1.
Discover: The best crypto to diversify your portfolio with
Bitcoin Price Prediction: Is a Larger Rally Forming?
Bitcoin is currently trading above $71,000, a crucial area that signifies the strong resistance that halted February’s upward movement.
The rebound from $63,350, validated by a Hammer candlestick pattern, indicated that buyers are prepared to enter at lower price points.
 Source: TradingView
The bearish perspective now hinges on whether Bitcoin can solidify its recent gains and advance to $76,000.
At the time of this writing, Bitcoin is down 7% for the month, but if the leading cryptocurrency can maintain its value over the next few days, its thirty-day price change will turn positive, providing a more stable foundation for further upward movement.
Bears are on the lookout for “hidden bearish divergence” on the RSI, where the price achieves a lower high while momentum reaches a higher high.
If this divergence materializes and Bitcoin fails to hold at $72,265, the downside targets could be significant. Some experienced traders caution that a final drop may be imminent, with technical projections indicating levels as low as $56,800 or even $41,400 if the $62,300 support level is breached.
Related Posts
 Source: EduwaveTrading, Market Analyst
Nonetheless, the bullish invalidation is evident. A sustained close above $79,000 by the end of the week would entirely negate the bear flag scenario. Immediate bullish confirmation would occur earlier: if BTC can reclaim the $73,000 level and convert it into support, it would pave the way to retest the psychological $80,000 mark.
Recent price forecasts indicate that a move beyond $72,000 could initiate a significant rally, assuming the volume supports the breakout.
Analyst View: The Line in the Sand
Market analysts are currently divided on whether the recent recovery is merely a temporary bounce or a true reversal. The prevailing view, however, is that current levels represent a “no man’s land” until a decisive break occurs.
To the upside, Bitcoin may need to rise above its 50-day SMA and reclaim the psychological $80,000 level before more buyers are drawn back into the market.
Other analysts, such as Samer Hasn, observe that recent extreme fear readings and ETF outflows may have indicated a local bottom, flushing out weaker hands in a typical capitulation event.
Bitcoin Resistance Level and Price Prediction: The Levels That Change Everything
Traders should disregard the noise and concentrate on three specific price levels in the upcoming sessions. First, monitor $74,000. A daily close above this level suggests that the 50-day moving average, which has established a strong resistance zone, is transitioning to support.
Second, keep an eye on the support band at $63,000. This is a definitive line for bulls. Losing this level confirms the bear flag breakdown and activates downside targets toward $56,000.
Lastly, watch the invalidation level at $80,000. Reclaiming this zone effectively nullifies the macro bearish structure and brings new all-time highs back into consideration. The next few daily candles will likely resolve this multi-month tension.
Discover: The hottest meme coins in crypto
The post Bitcoin Nears Two-Year ‘Make-or-Break’ Resistance: What’s Next? appeared first on Cryptonews.