Disclaimer: Information found on CryptoreNews is those of writers quoted. It does not represent the opinions of CryptoreNews on whether to sell, buy or hold any investments. You are advised to conduct your own research before making any investment decisions. Use provided information at your own risk.
CryptoreNews covers fintech, blockchain and Bitcoin bringing you the latest crypto news and analyses on the future of money.
Bitcoin (BTC) serves as an indicator of global anxiety, yet the recent geopolitical tensions, which have sparked concerns about a potential World War III, have not disrupted the asset’s optimistic outlook.
Despite alarming headlines, Bitcoin is maintaining its position above the $60,000 mark, anticipating a liquidity-driven surge rather than a capitulation scenario.
Traders are now factoring in resilience, looking beyond the initial fluctuations to the fundamental supply dynamics that favor bullish sentiment.
The market experienced a notable decline near $63,000 over the weekend before buyers intervened, preventing further drops.
This price movement indicates that the market is becoming desensitized to headline risks, redirecting attention to the monetary factors that typically drive rallies in the fourth quarter. It represents a conflict of narratives: geopolitical instability versus undeniable on-chain strength.
Key Takeaways:
- Bitcoin Exchange Reserves have decreased to levels not observed since 2018, resulting in a significant supply shock as demand establishes a support level.
- Spot BTC ETF Inflows are absorbing retail panic selling, with institutional investors viewing price dips as opportunities for accumulation.
- Global Liquidity M2 is once again on the rise, historically a key driver for the repricing of crypto assets regardless of news cycles.
Indicator 1: Bitcoin Exchange Reserves Indicate Supply Shock
The most significant on-chain metric at present is the swift reduction of Bitcoin Exchange Reserves. Data from CryptoQuant reveals that reserves have dropped to around 2.6 million BTC, the lowest since 2018. This represents a structural supply squeeze that warrants attention.
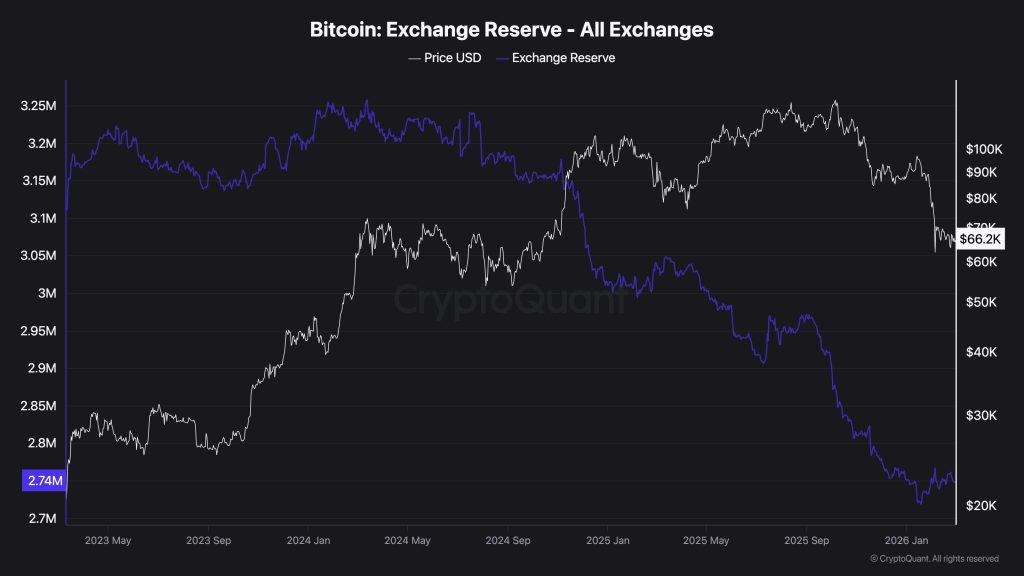 Source: CryptoQuant
When coins exit exchanges, they typically transition to cold storage or custody solutions, effectively removing them from the immediate sellable supply.
The implication is clear: a reduced number of coins available for sale means that less buying pressure is needed to elevate prices. In previous cycles, significant drops in exchange balances often preceded rallies driven by supply shocks.
This liquidity drain indicates that while weaker hands are selling amid headline fears, long-term holders are transferring assets off the ledger. We are observing a shift of wealth from impatient retail traders to high-conviction entities that comprehend the scarcity dynamics of the halving year.
Discover: The best crypto to diversify your portfolio with
Indicator 2: Bitcoin (BTC) ETF Inflows vs. Spot Selling
Institutional demand continues to serve as a substantial buffer against spot market fluctuations. Despite the negative sentiment on social media, Spot BTC ETF Inflows present a contrasting narrative.
Recent weeks have witnessed net inflows effectively countering the selling pressure from short-term holders, with the last week generating net inflows of $787.3 million, according to data from SoSoValue.
Consequently, funds like BlackRock’s IBIT continue to draw capital even as price movements remain sideways. This divergence of declining prices against increasing inflows is a classic signal of accumulation. Institutional accumulation is not slowing; it is intensifying during price dips.
Moreover, major financial institutions are enhancing their infrastructure. Morgan Stanley has begun holding client crypto directly, indicating that the smart money thesis remains focused on long-term adoption rather than short-term geopolitical distractions.
Indicator 3: How Bitcoin is Breaking the Downtrend Despite WW3 Fears
Related Posts
From a technical perspective, Bitcoin is adhering to crucial levels. The weekend dip found support before approaching the psychological $60,000 threshold, a level many traders had targeted for aggressive long positions.
Trader CrypNuevo noted on X that a move to anywhere between $60,000 and $61,000 would represent an ideal long entry, but the market preemptively approached that level, demonstrating eagerness to buy.
So my strategy for this week is:
Wait for Monday stock market opening reaction:
• If it’s a bloodbath (unlikely imo), then I’ll long Bitcoin around $61k-$60k ahead of de-escalation talk news.
• If it’s a slight decline, sideways or pump, I won’t long until later in the week.— CrypNuevo
(@CrypNuevo) March 1, 2026
 (@CrypNuevo) March 1, 2026
A decisive break above $70,000 would invalidate the downtrending pattern that has affected the chart since March.

Support at $60,000 is a critical threshold; losing that could shift the focus to $55,000 or lower. If Bitcoin can maintain this level, the pathway back to six figures by summer remains viable.
Indicator 4: Global Liquidity and Central Bank Easing
Bitcoin is fundamentally a liquidity sponge. The current growth of Global Liquidity M2, which measures global liquidity including cash, checking and savings deposits, money market securities, and other near-cash assets, serves as a macro tailwind that bearish traders may be overlooking.
As central banks from the ECB to the Fed indicate or implement rate cuts, the cost of capital decreases, prompting a shift of funds from risk-free assets to growth-oriented investments.
Historically, Bitcoin’s parabolic increases align closely with cycles of M2 expansion. We are currently in the early phases of a global easing cycle. While inflation data may cause temporary interruptions in the Fed’s plans, the overarching trend is evident: monetary expansion is gaining momentum.
Given the historical lag between M2 liquidity expansion cycles and Bitcoin bull markets, the current injections into the system are likely to influence asset prices in Q4 2024 and Q1 2025.
Traders anticipating a crash are effectively betting against the central bank liquidity cycle, a gamble that seldom yields positive results in the crypto markets.
Discover: The best crypto to buy now
Indicator 5: Bitcoin Sees Geopolitical Resilience Despite WW3 Fears
The market’s response to recent tensions in the Middle East reinforces the “digital gold” narrative, albeit with heightened volatility.
While the initial reaction involved a sell-off, Bitcoin quickly rebounded after the shock, recovering nearly all losses within 48 hours. This V-shaped recovery is characteristic of a robust bull market structure.
Analyst consensus is shifting away from “World War Three” scenarios toward a narrative of contained conflict, which limits downside risk for risk assets.
However, the relationship between energy prices and crypto remains strong. As oil prices respond to tensions with Iran, inflation expectations could rise, complicating the Fed’s pivot. Nevertheless, Bitcoin has currently disregarded this correlation, trading more on unique crypto flows than on petrodollar dynamics.
Data from CoinGlass indicates that the initial dip eliminated over-leveraged longs, resetting open interest to healthier levels. The market is now lighter, cleaner, and prepared for organic price discovery without the burden of excessive leverage.
Ultimately, with institutional accumulation quietly establishing a price floor and Bitcoin Exchange Reserves depleting, the path of least resistance appears to be upward despite fears of WW3. The Bitcoin market has already factored in the shock from the conflict. Now it awaits the influx of liquidity.
The post Bitcoin and WW3: 5 Key Indicators as BTC Eyes Global Liquidity Surge appeared first on Cryptonews.