Disclaimer: Information found on CryptoreNews is those of writers quoted. It does not represent the opinions of CryptoreNews on whether to sell, buy or hold any investments. You are advised to conduct your own research before making any investment decisions. Use provided information at your own risk.
CryptoreNews covers fintech, blockchain and Bitcoin bringing you the latest crypto news and analyses on the future of money.


The U.S. stock market rebounded sharply on May 17 and 18, fueled by optimism that a debt ceiling agreement would be reached. However, the market surrendered some of those gains on May 19 following reports of a temporary halt in the negotiations.
The U.S. Dollar Index (DXY), which had risen for three consecutive days, reversed course on May 19 after Federal Reserve Chair Jerome Powell hinted at an end to interest rate hikes. Speaking at a conference in Washington D.C., Powell noted that stresses within the banking system might reduce the need to raise rates as high as they otherwise would have to achieve the Fed’s goals.
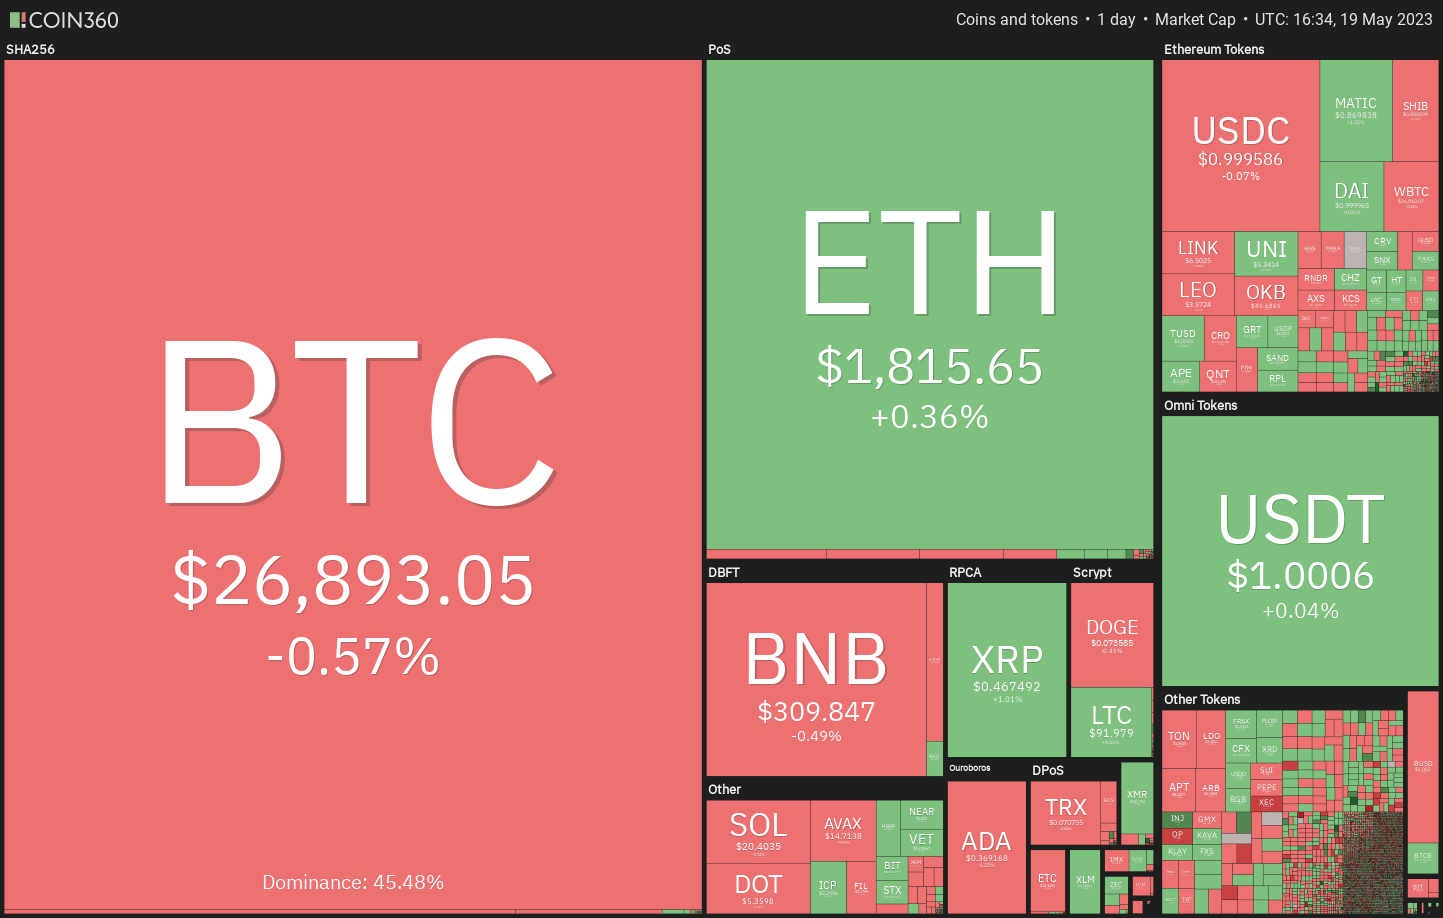
Daily cryptocurrency market performance. Source: Coin360
While Bitcoin‘s (BTC) short-term outlook remains uncertain, analysts maintain a bullish long-term perspective. Blockstream CEO and co-founder Adam Back recently suggested that “hyper-Bitcoinization” could be imminent. This scenario would significantly boost Bitcoin demand, potentially sending its price soaring. Back argued that the number of “wholesalers” has been steadily increasing. If this trend continues, it could reach a point where 10 million people attempt to buy 1 Bitcoin over a few years, driving the price “out of reach.”
Do the charts signal a potential recovery for Bitcoin and altcoins in the near term? Let’s examine the charts of the top 10 cryptocurrencies to find out.
Bitcoin price analysis
Bulls attempted to push the price into the symmetrical triangle pattern on May 17, but bears fiercely defended the level, pulling Bitcoin lower on May 18.
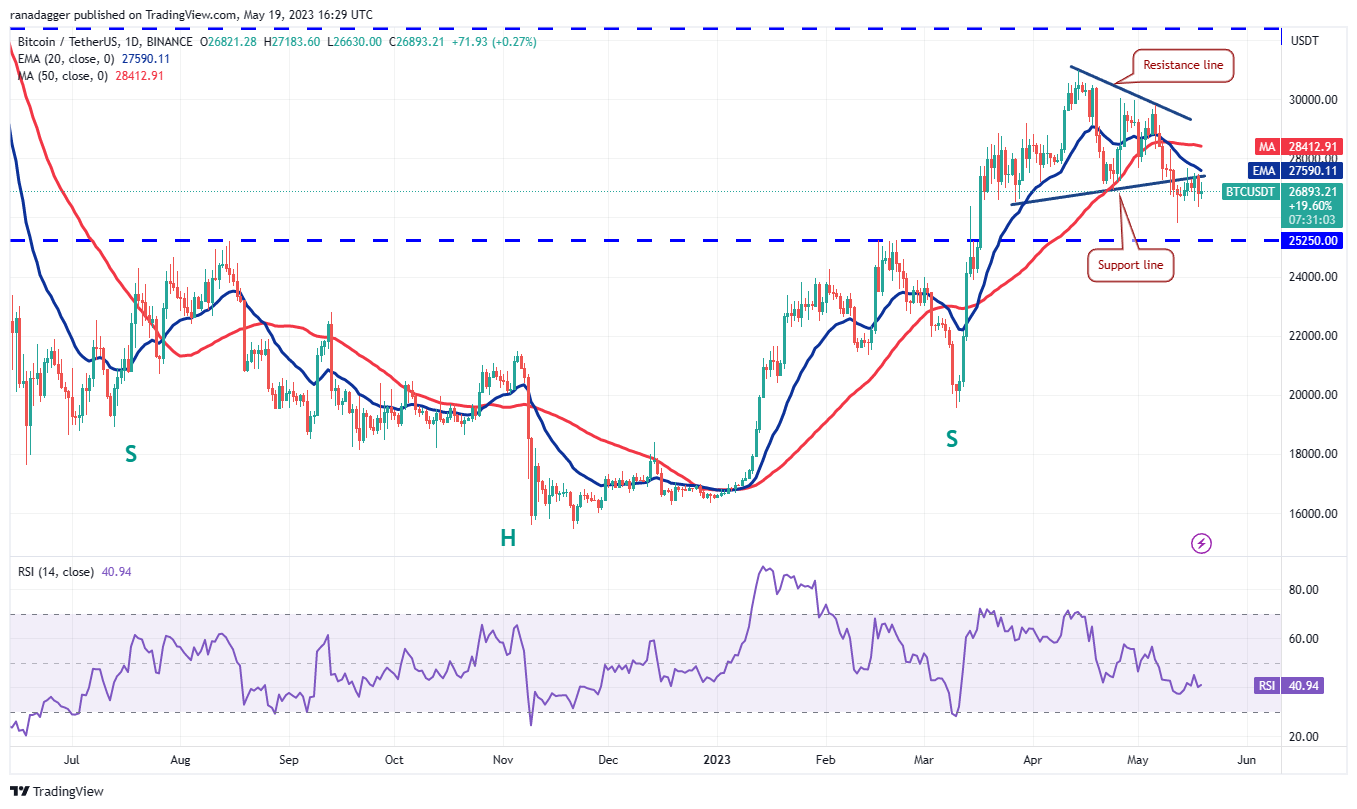
BTC/USDT daily chart. Source: TradingView
The BTC/USDT pair is likely to continue experiencing intense competition between bulls and bears in the zone between the support line and $25,250.
The downward-sloping 20-day exponential moving average (EMA) at $27,590 and the relative strength index (RSI) in negative territory indicate that bears hold a slight edge. However, the bears’ failure to sustain the price below $26,500 suggests that selling pressure diminishes at lower levels.
If buyers break through the overhead resistance, the pair could initiate a rally toward the 50-day simple moving average (SMA) at $28,412, and subsequently toward the resistance line. A break above the triangle would shift the advantage to the bulls.
Ether price analysis
Bulls have been attempting to push Ether (ETH) above the 20-day EMA ($1,840) for several days, but bears have prevented this move.
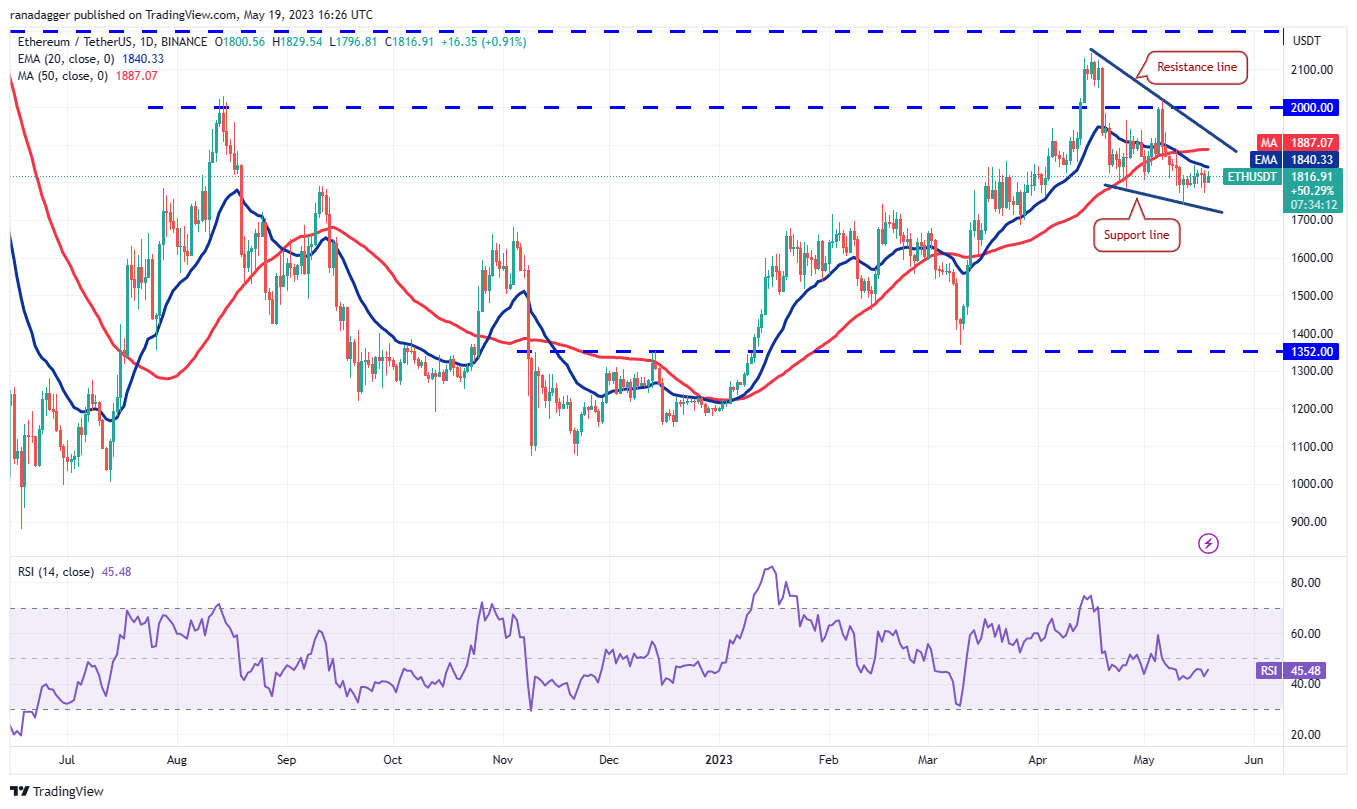
ETH/USDT daily chart. Source: TradingView
The long tail on the May 16 to May 18 candlestick indicates that bulls continue to buy intraday dips. This enhances the prospects of a break above the 20-day EMA. If this obstacle is cleared, the ETH/USDT pair could rise to the resistance line of the falling wedge pattern.
This is a critical level to monitor, as a break and close above it would signal the start of a new upward move. On the downside, bears must push the price below the support line to initiate a downward move toward $1,600.
BNB price analysis
BNB (BNB) continues to trade within a descending channel pattern. The price declined from the 20-day EMA ($315) on May 18, indicating that sentiment remains bearish.
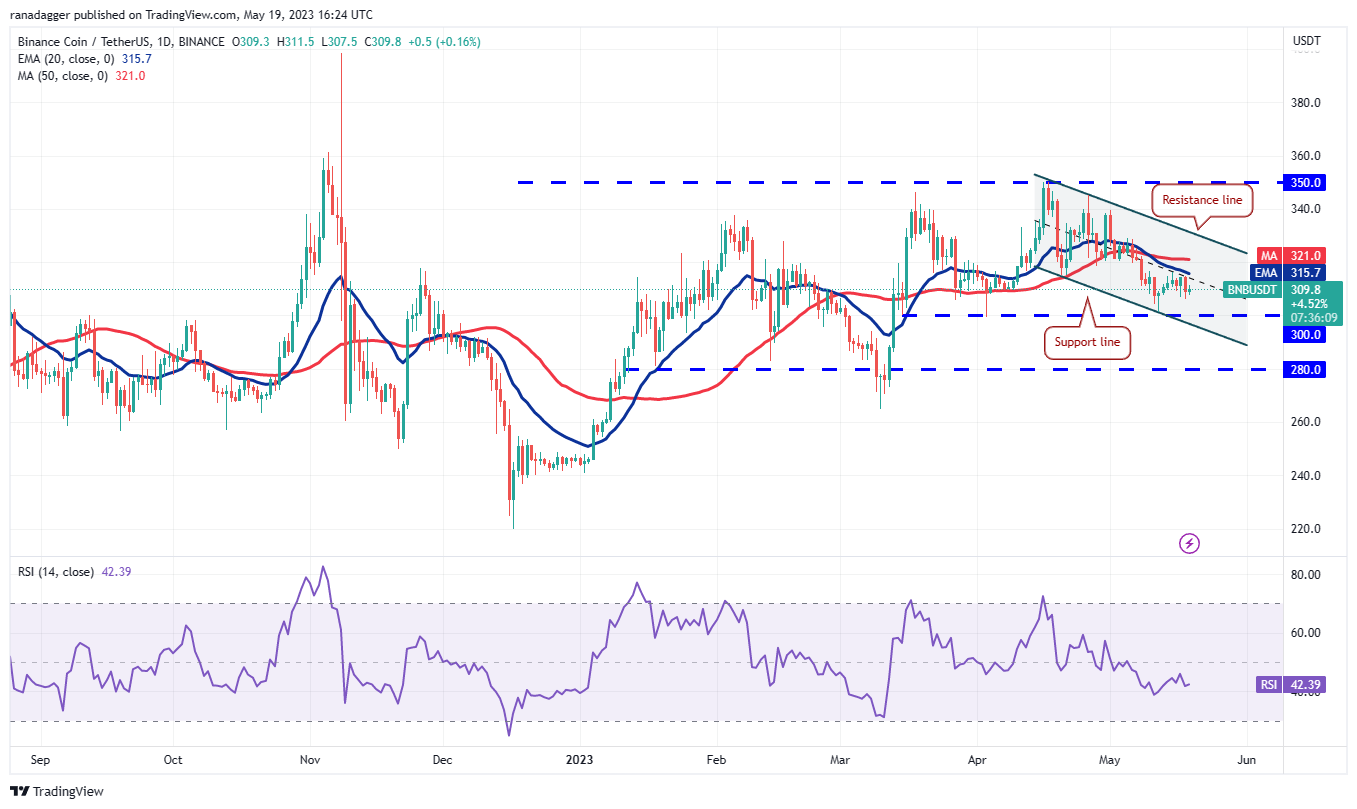
BNB/USDT daily chart. Source: TradingView
The first sign of strength would be a break and close above the 20-day EMA. This could clear the path for a likely rally to the resistance line. Bears are expected to defend this level vigorously. If the price drops sharply from the resistance line, it will suggest that the BNB/USDT pair may remain inside the channel for some time.
Bears likely have other plans. They will attempt to sink the price below the channel’s support line and challenge the crucial support at $280.
XRP price analysis
After struggling near the 20-day EMA ($0.45) on May 17, buyers cleared the barrier on May 18. This suggests that XRP (XRP) is witnessing a resurgence by the bulls.
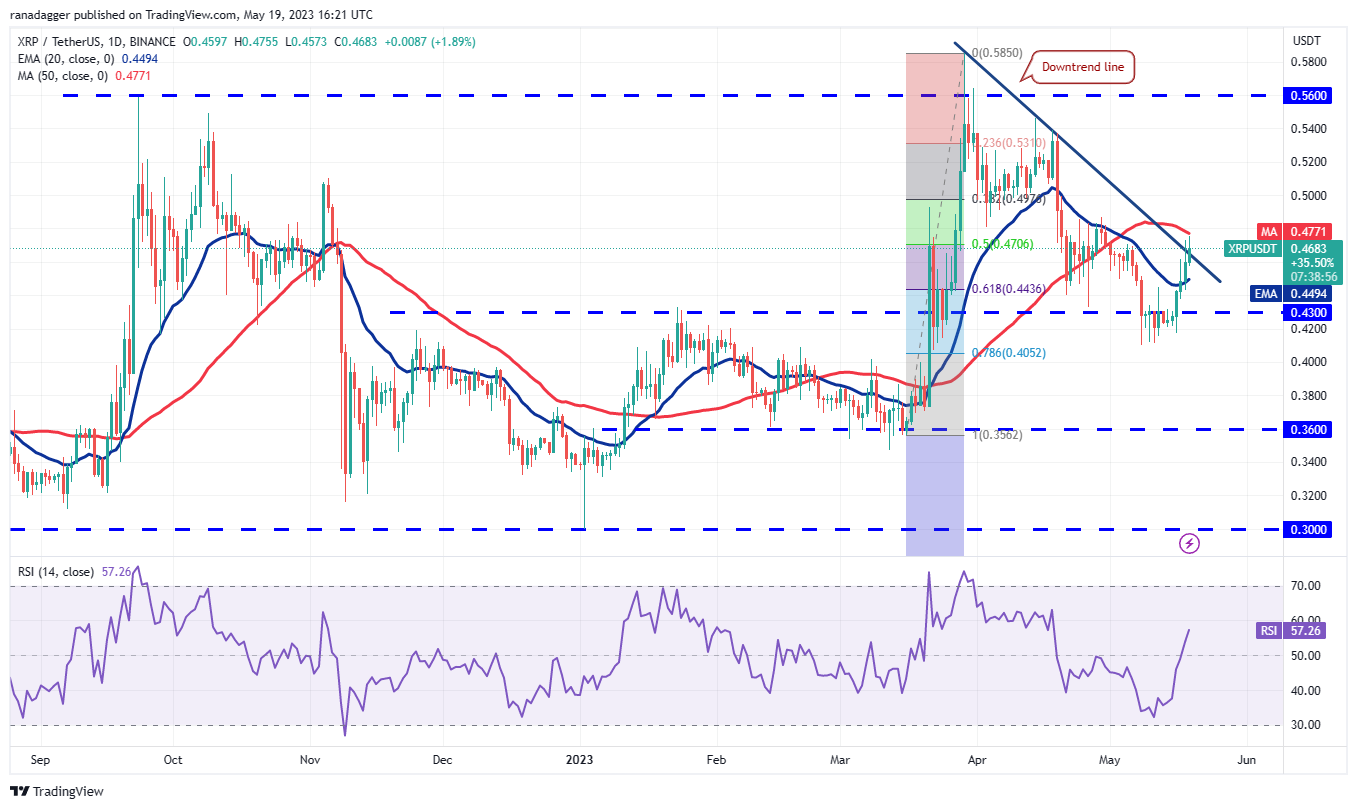
XRP/USDT daily chart. Source: TradingView
The flattening 20-day EMA and the RSI in positive territory indicate that selling pressure is easing. There is a strong resistance zone between the downtrend line and the 50-day SMA ($0.48), but it is likely to be breached. If this occurs, the XRP/USDT pair could begin its northward march toward $0.54.
Conversely, if the price drops from the current level, it will suggest that bears continue to sell on relief rallies. This could keep the pair stuck between the 50-day SMA and $0.40 for a while.
Cardano price analysis
Bulls attempted to sustain Cardano (ADA) above the 20-day EMA ($0.37) on May 17 and 18, but bears did not relent.
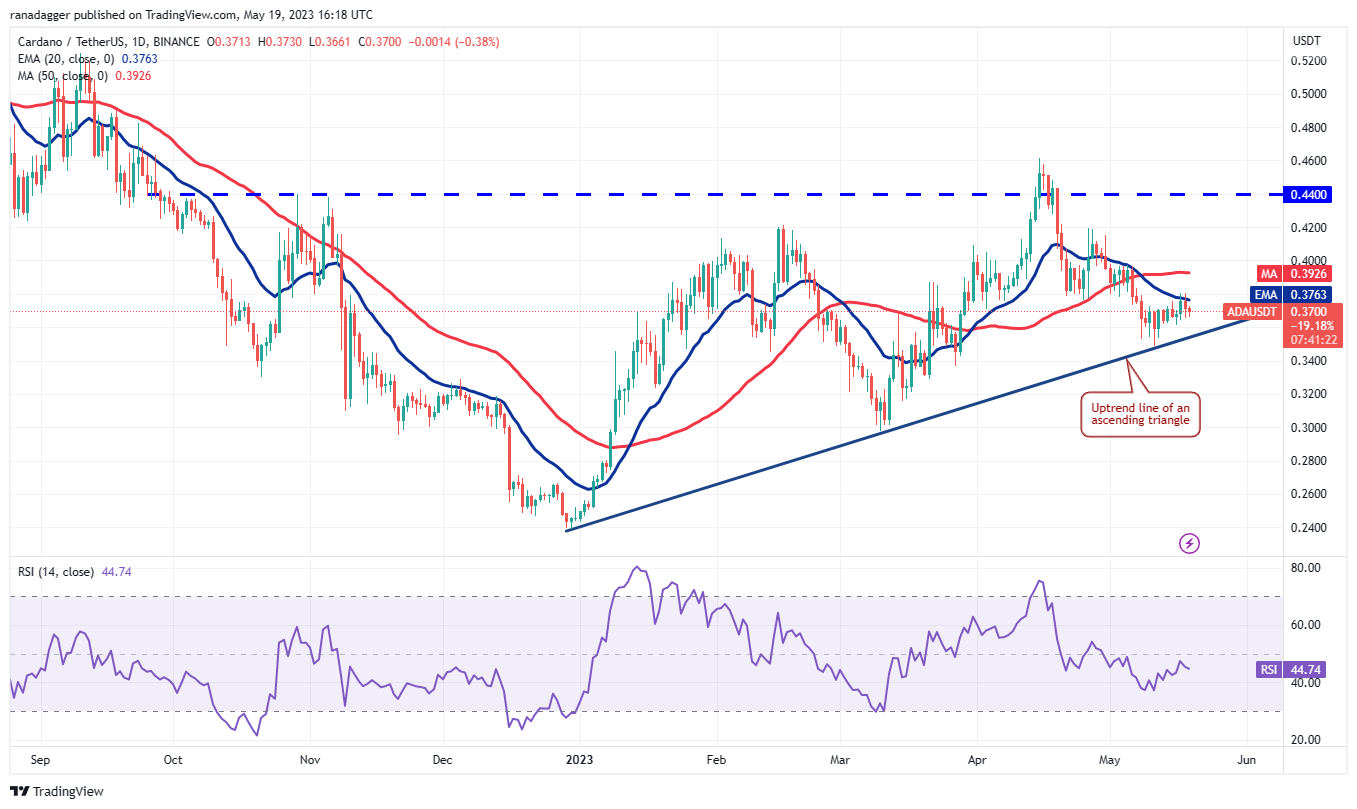
ADA/USDT daily chart. Source: TradingView
Related Posts
The bulls have not lost much ground from the 20-day EMA, which is an encouraging sign. This indicates that every minor dip is being bought. Bulls will attempt again to push the price above the 20-day EMA. If they succeed, the ADA/USDT pair may first climb to the 50-day SMA ($0.39) and then attempt a move to $0.44.
Time is running out for the bears. If they want to seize control, they must quickly pull the price below the uptrend line. This would open the door for a potential fall to $0.30.
Dogecoin price analysis
Bulls attempted to propel Dogecoin (DOGE) above the 20-day EMA ($0.07) on May 17, but bears held their ground.
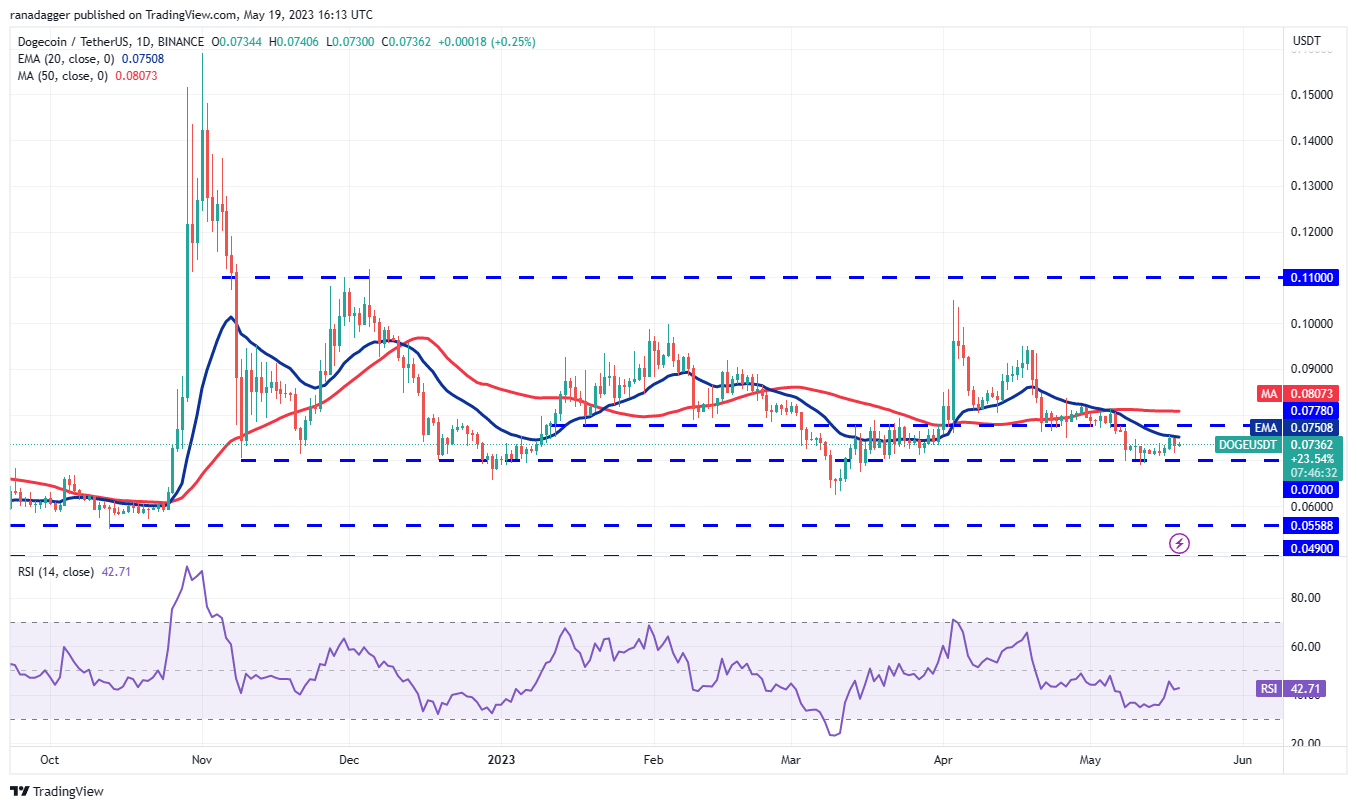
DOGE/USDT daily chart. Source: TradingView
Bulls may attempt again to clear the overhead hurdle. If they succeed, the DOGE/USDT pair could rally to the 50-day SMA ($0.08). This level is likely to act as a barrier, but if crossed, it will suggest that the pair continues to swing within the large range between $0.07 and $0.11.
Contrary to this scenario, if the price drops from the current level and plunges below $0.07, it will indicate that bears have overpowered the bulls. The pair could then slump to $0.06.
Polygon price analysis
Buyers pushed Polygon (MATIC) above the resistance of the narrow range of $0.82 to $0.88 on May 17. Although bears pulled the price back into the range on May 18, a minor positive is that bulls purchased intraday dips, as evidenced by the long tail on the day’s candlestick.
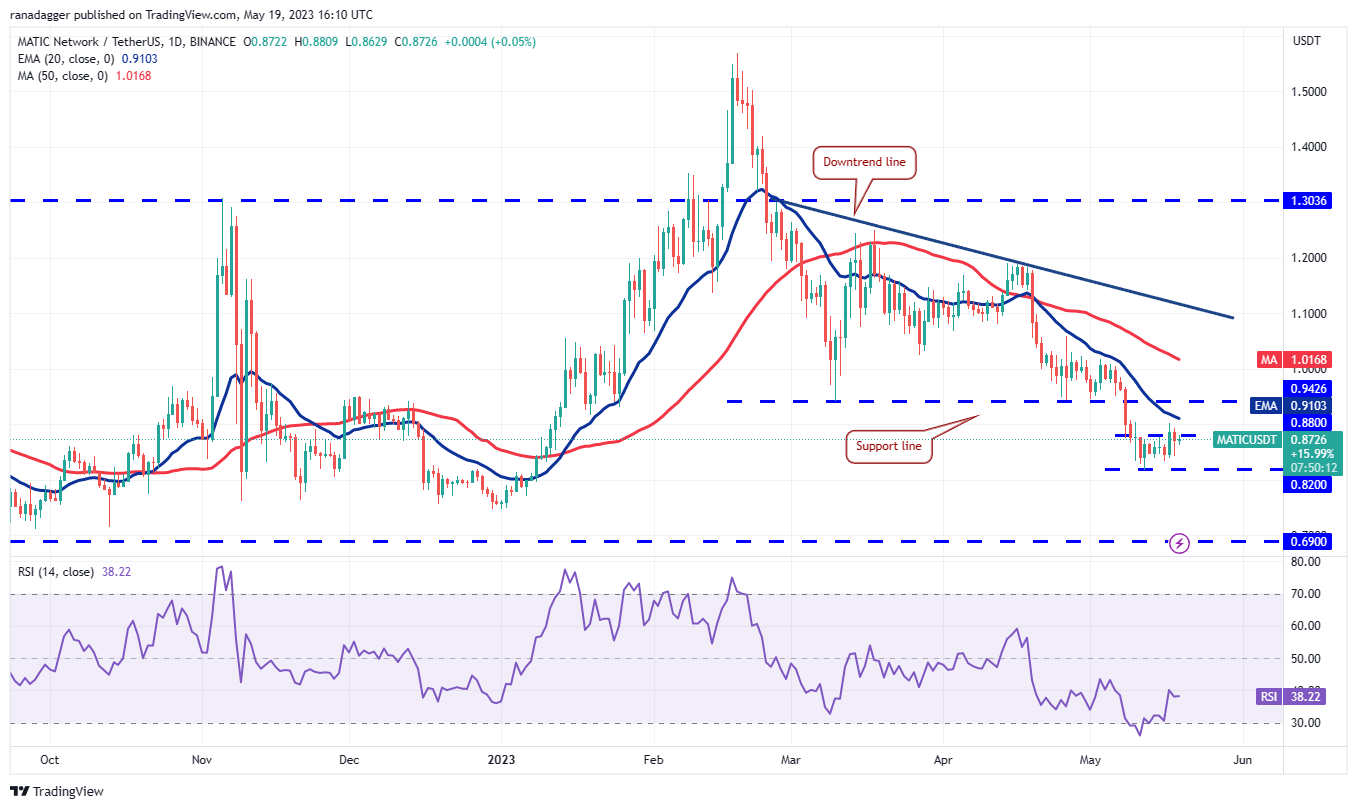
MATIC/USDT daily chart. Source: TradingView
The zone between the 20-day EMA ($0.91) and $0.94 is likely to witness strong selling from bears. If bulls overcome this obstacle, the MATIC/USDT pair is likely to gain momentum and reach the downtrend line.
Alternatively, if the price fails to rise above the 20-day EMA, it will indicate that sentiment remains negative and bears are selling on every minor relief rally. Sellers will then attempt again to sink the pair below $0.82.
Related: Bitcoin price risk? US debt deal to trigger $1T liquidity crunch, analyst warns
Solana price analysis
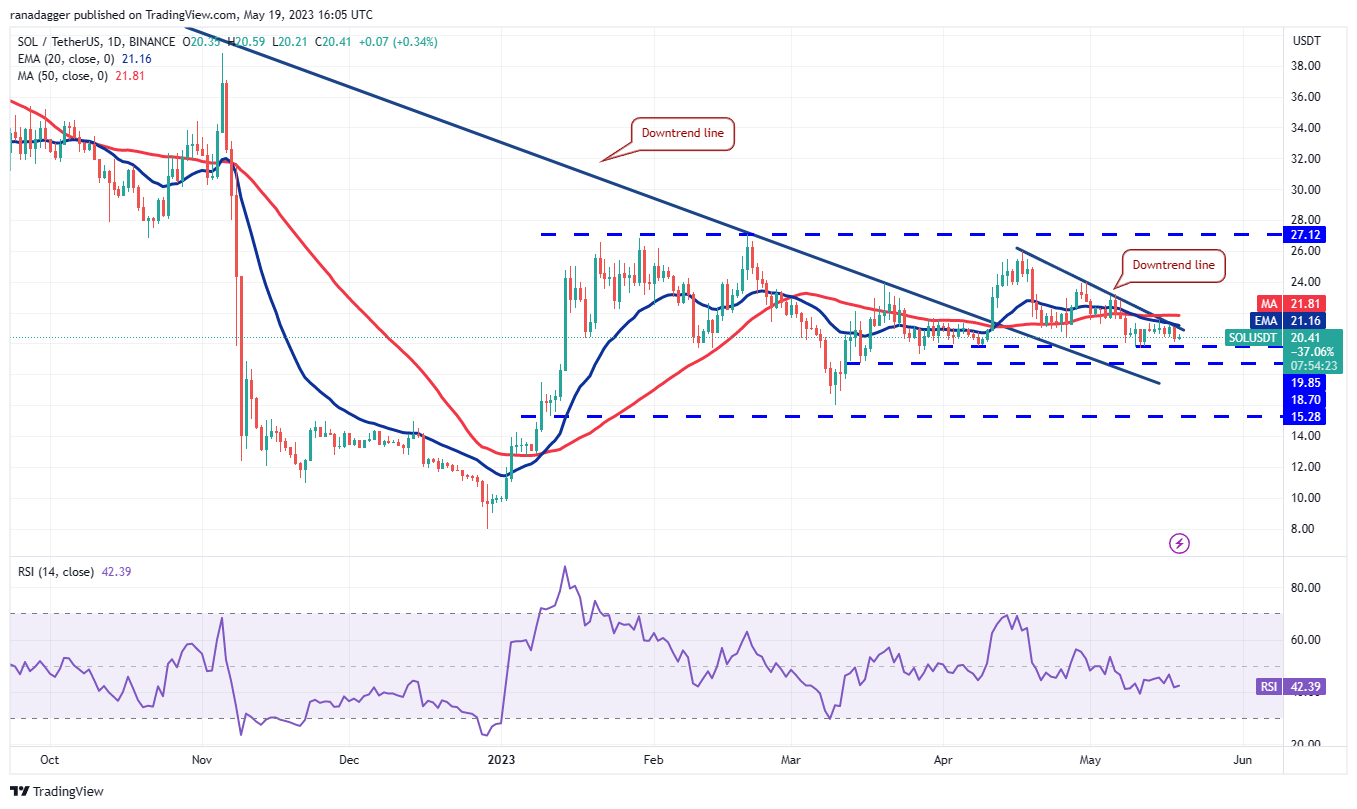
Solana (SOL) dropped sharply from the downtrend line on May 18, indicating that bears are fiercely defending the level.
SOL/USDT daily chart. Source: TradingView
Bears will attempt to increase their advantage by sinking the price below the strong support at $19.85. If they succeed, the SOL/USDT pair may first tumble to $18.70 and then to $16.
Conversely, if the price rebounds from the current level and climbs above the 50-day SMA ($21.81), it will indicate that bulls are active at lower levels. The pair may then attempt a rally to $24 and subsequently to $27.12.
Polkadot price analysis
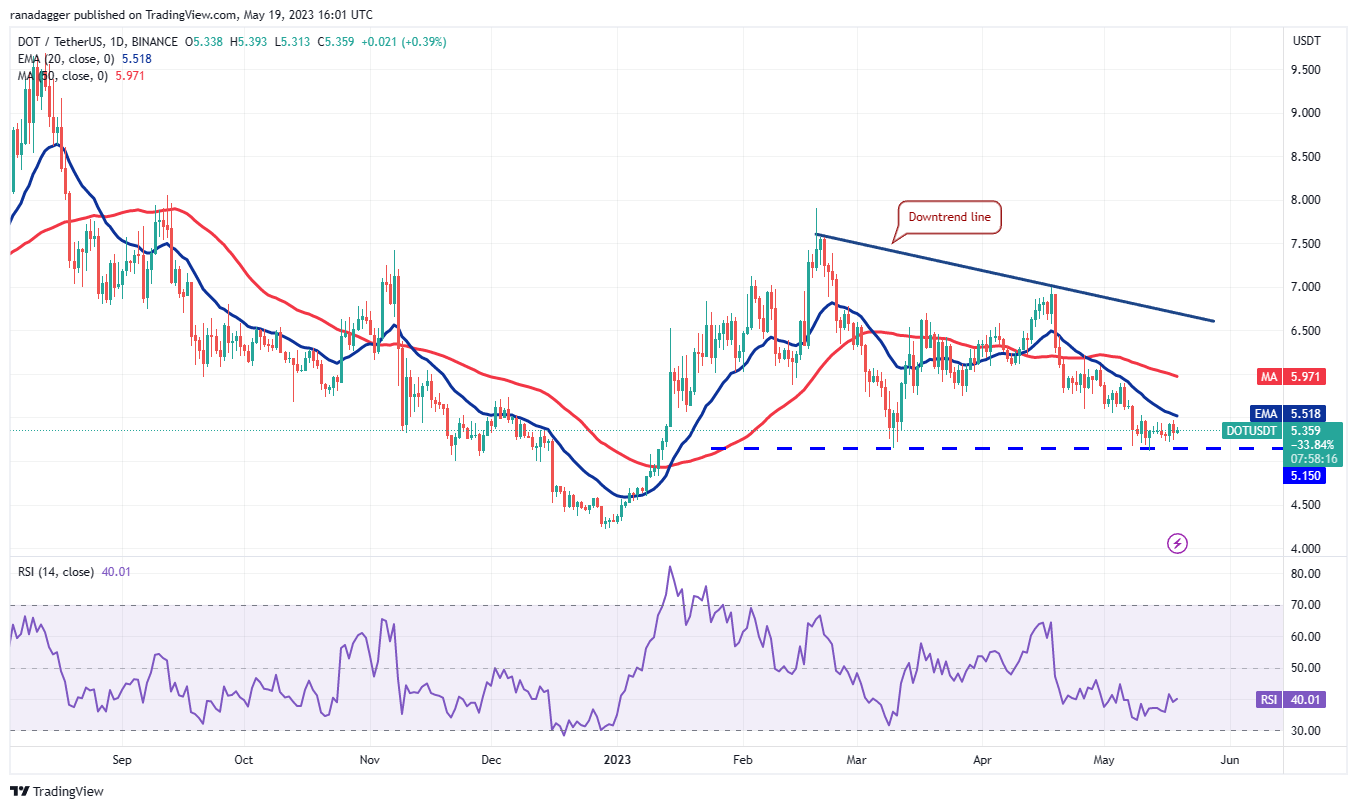
Polkadot (DOT) has been struggling to initiate a recovery, indicating that demand dries up at higher levels.
DOT/USDT daily chart. Source: TradingView
Often, tight consolidation near a strong support level tends to break to the downside. In this case, a break and close below $5.15 will complete a descending triangle pattern and open the door for a possible decline to $4.22.
If bears want to prevent this fall, they must quickly drive the price above the 20-day EMA ($5.51). If they do, the DOT/USDT pair could rise to the 50-day SMA ($5.97) and then rally to the downtrend line. Buyers must overcome this resistance to indicate that the correction may be over.
Litecoin price analysis
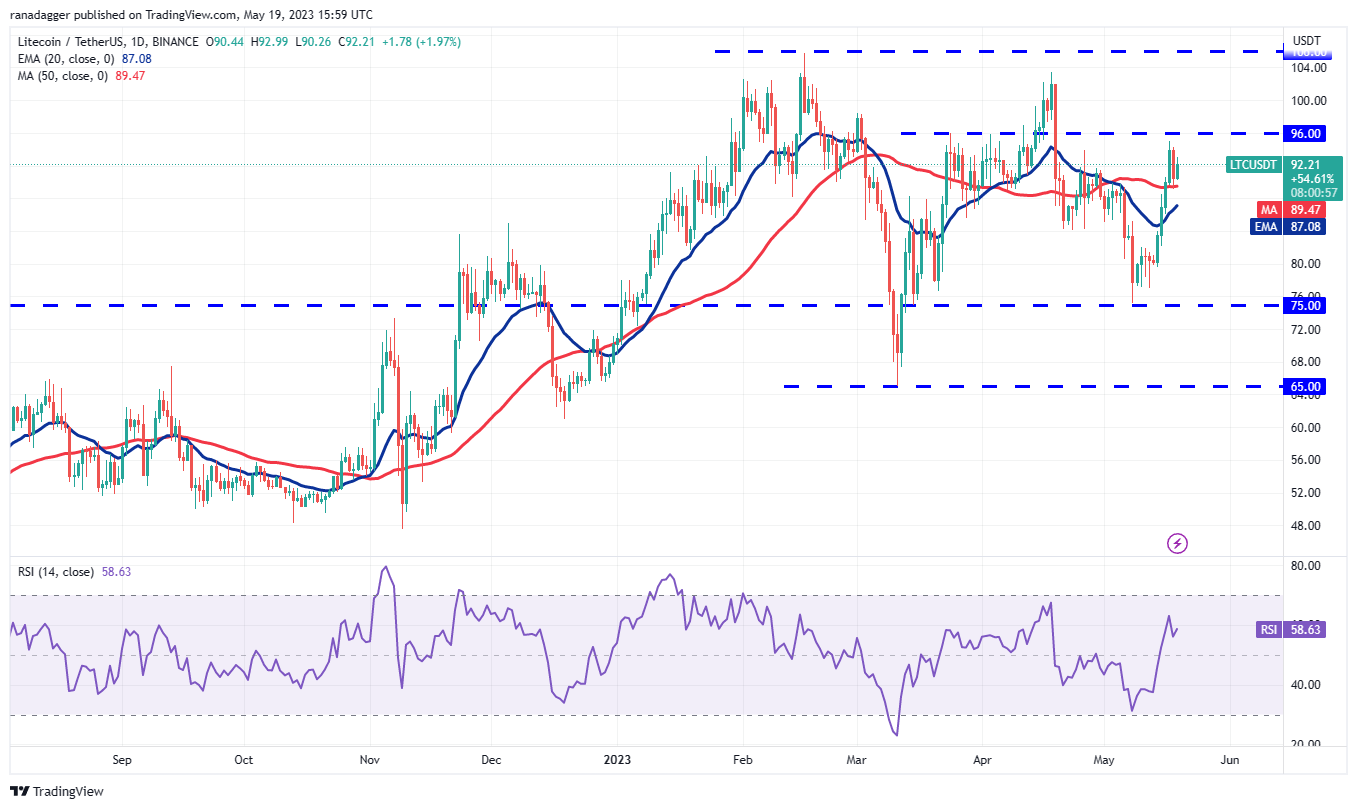
Litecoin (LTC) dropped from the overhead resistance of $96 on May 18, but a positive sign is that bulls prevented the price from slipping below the 50-day SMA ($89). This shows that bulls are attempting to flip this level into support.
LTC/USDT daily chart. Source: TradingView
The 20-day EMA ($87) has started to turn upward, and the RSI is near 59, indicating that bulls have the upper hand. Buyers will next make another attempt to clear the overhead hurdle at $96 and propel the LTC/USDT pair to $106.
This positive view will be invalidated in the near term if the price drops and breaks below the moving averages. Such a move would indicate that the pair may oscillate between $75 and $96 for some time.
This article does not contain investment advice or recommendations. Every investment and trading move involves risk, and readers should conduct their own research when making a decision.
This article is for general information purposes and is not intended to be and should not be taken as legal or investment advice. The views, thoughts, and opinions expressed here are the author’s alone and do not necessarily reflect or represent the views and opinions of Cointelegraph.
