Disclaimer: Information found on CryptoreNews is those of writers quoted. It does not represent the opinions of CryptoreNews on whether to sell, buy or hold any investments. You are advised to conduct your own research before making any investment decisions. Use provided information at your own risk.
CryptoreNews covers fintech, blockchain and Bitcoin bringing you the latest crypto news and analyses on the future of money.
Is the significant drop in Bitcoin’s volatility and the decrease in short-term holders indicative of a bullish market trend?
The most recent analysis from Glassnode Insights, titled "The Week On-Chain," highlighted that Bitcoin (BTC) has reached historically low volatility levels. This has resulted in a mere 2.9% gap between the asset’s Bollinger Bands, signifying an unusually tight trading range.
This scenario has only been recorded twice in Bitcoin’s past: in September 2016, when BTC was priced around $604, and in January 2023, when the asset held a consistent value of $16,800.
The report indicates that phases of diminished volatility, coupled with investor fatigue, lead to the movement of coins based on their proximity to the current price. This suggests that traders are likely realizing minimal profits or losses upon exiting. The report concludes that establishing a new price range is essential to encourage renewed spending, which could contribute to a projected rise in volatility.
Is Bitcoin’s low volatility indicative of broader markets?
The limited range within which Bitcoin has been trading – specifically, $29,050 to $29,775 over the last three weeks – is unusual and does not necessitate complex mathematical analysis to comprehend. This has resulted in an exceptionally low annualized 30-day volatility of 17%. The critical question is whether this trend is confined to cryptocurrencies or if it is also a phenomenon seen in traditional markets, including stocks, oil, bonds, and currencies.
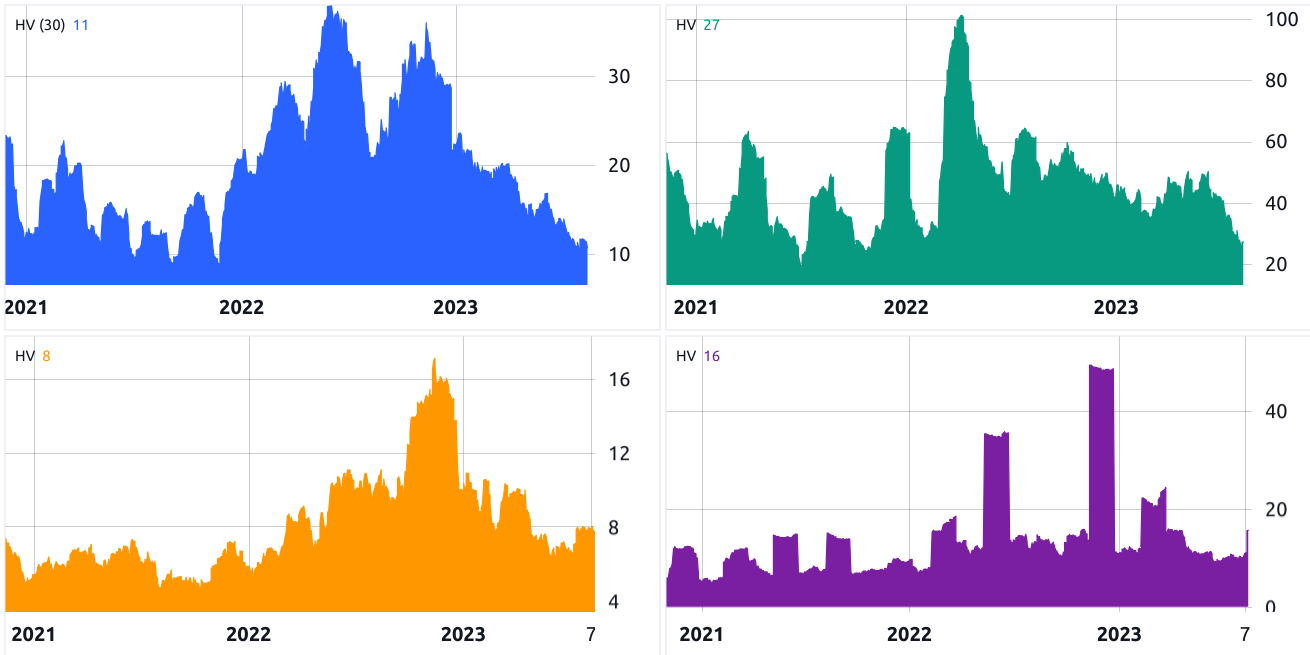 S&P 500 (blue), WTI (green), DXY (orange), 10-year Treasury (purple) 30-day volatility. Source: TradingView
Observe that the 30-day volatility of the S&P 500 and oil price (WTI) is currently at its lowest since November 2021. Notably, the DXY index did not follow this trend, as it increased to 8% from 6% in May 2023. Furthermore, the 10-year Treasury yield recently rose from its 18-month low of around 10% to the current 16%. These trends may have influenced the reduction in Bitcoin’s volatility.
According to Glassnode, there is a significant concentration of short-term holders’ price distribution between $25,000 and $31,000. This pattern resembles similar periods during previous bear market recoveries. However, the data indicates that many of these investors are still holding positions at a loss, creating short-term selling pressure.
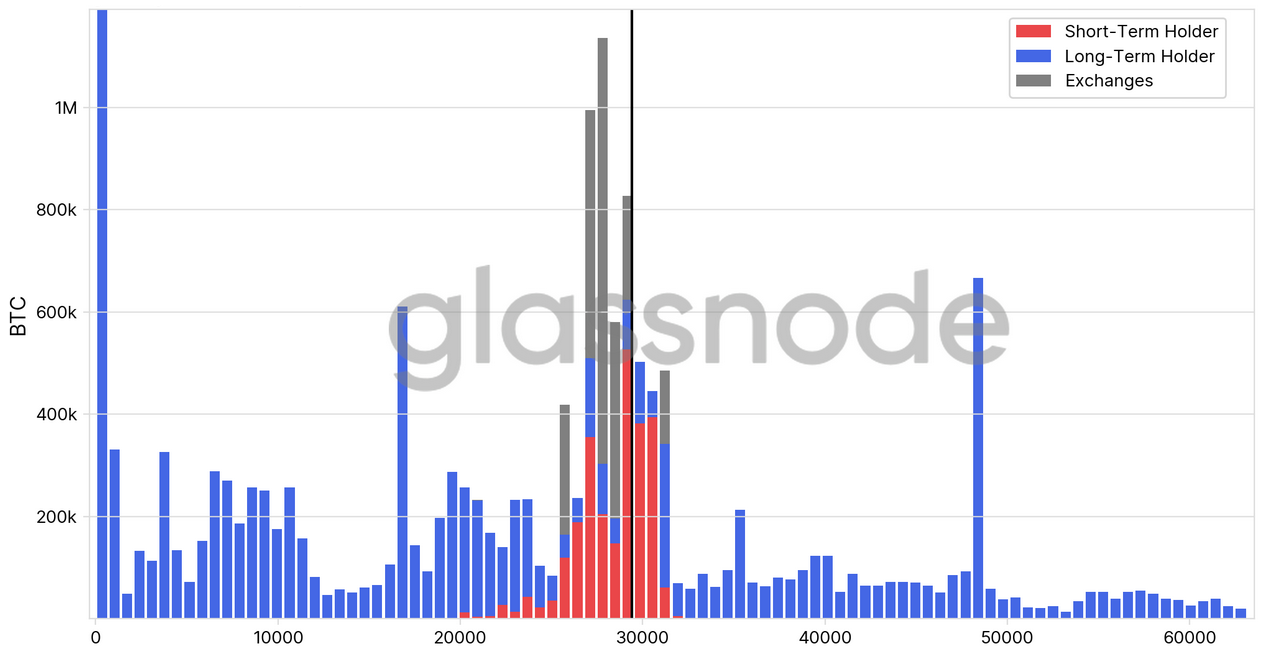 Entity-adjusted unspent BTC realized price distribution. Source: Glassnode
Related Posts
Additionally, the analytics firm points out a significant decline in short-term holder supply to a multi-year low of 2.56 million BTC. Conversely, the supply held by long-term holders has reached an all-time high of 14.6 million BTC, as noted in the report.
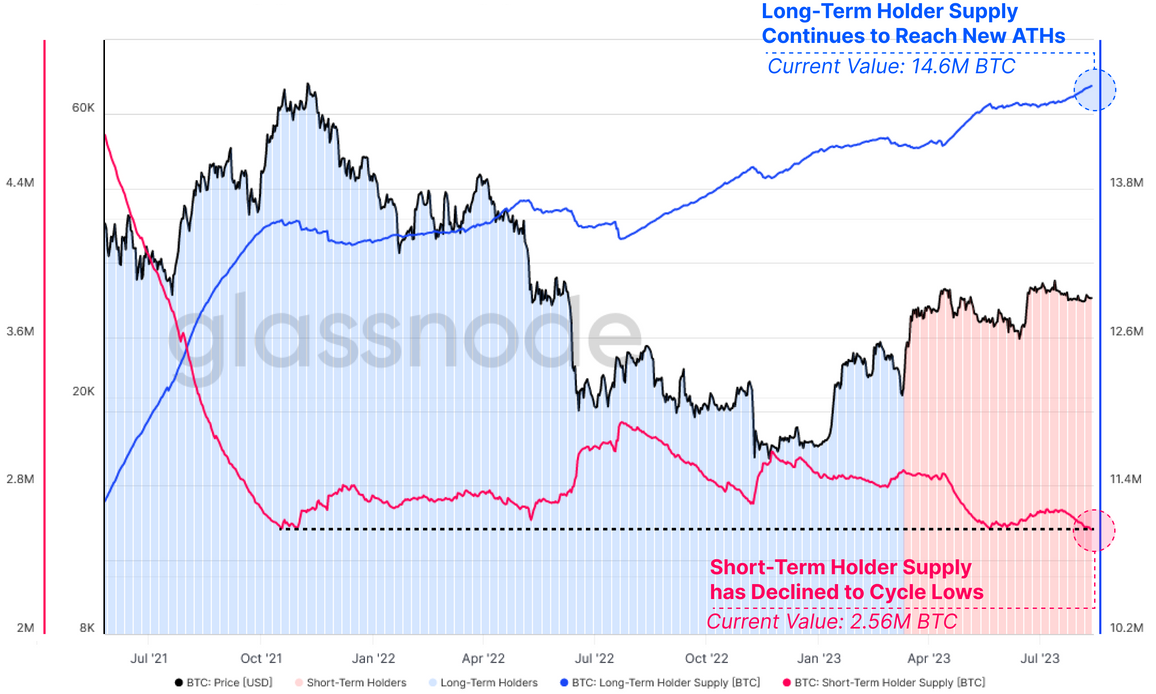 Bitcoin long-term and short-term holder threshold. Source: Glassnode
In a relatively optimistic scenario where only 10% of the 1.77 million BTC held by long-term investors at $47,000 or higher change their positions before Bitcoin exceeds $40,000, this equates to approximately six and a half months of the current mining output. This underscores the importance of considering the potential impact of a global economic recession on Bitcoin’s price, beyond the fact that short-term holders are becoming increasingly scarce.
This hypothesis does not negate Glassnode’s assertion of increased positions by "long-term conviction holders." However, no historical data can account for the U.S. 10-year Treasury yields approaching their highest level in 16 years or the 30-year fixed average mortgage rate in the U.S. nearing the 7% threshold.
Despite the current trend, long-term holders may still alter their sentiment and actions in response to adverse economic conditions.
Higher yields in equities could draw in investors, potentially leading to increased volatility, while rising government and corporate borrowing costs might pressure budgets and profitability. Simultaneously, real estate markets could decelerate due to the effects on mortgage affordability. Such conditions would likely compel central banks to implement fiscal measures to bolster economic activity, often resulting in upward inflationary pressures.
Bitcoin’s emergence as a $50 billion asset class occurred just six years ago, making it uncertain how holders will respond to the challenges faced by some traditional markets. This contrasts with the historically low volatility observed in the S&P 500, oil, and Bitcoin markets.
This raises the question: could this calm be a precursor to a period of upheaval, and will Bitcoin act as a hedge against rising inflation? Only time will reveal the answers.
Collect this article as an NFT to preserve this moment in history and demonstrate your support for independent journalism in the crypto sector.
This article is intended for general informational purposes and should not be construed as legal or investment advice. The views, thoughts, and opinions expressed herein are solely those of the author and do not necessarily reflect or represent the views and opinions of Cointelegraph.