Disclaimer: Information found on CryptoreNews is those of writers quoted. It does not represent the opinions of CryptoreNews on whether to sell, buy or hold any investments. You are advised to conduct your own research before making any investment decisions. Use provided information at your own risk.
CryptoreNews covers fintech, blockchain and Bitcoin bringing you the latest crypto news and analyses on the future of money.


Bitcoin (BTC) has fallen for three consecutive days as traders evaluate several bearish factors, including rising transaction fees and negative signals for risk-on assets from legendary investor Warren Buffett.
On May 9, the BTC price dropped below $27,500, representing an 8% decline from its local high of $29,850 set three days prior. This dip was accompanied by increased trading volume, suggesting that the downward move has significant momentum behind it.
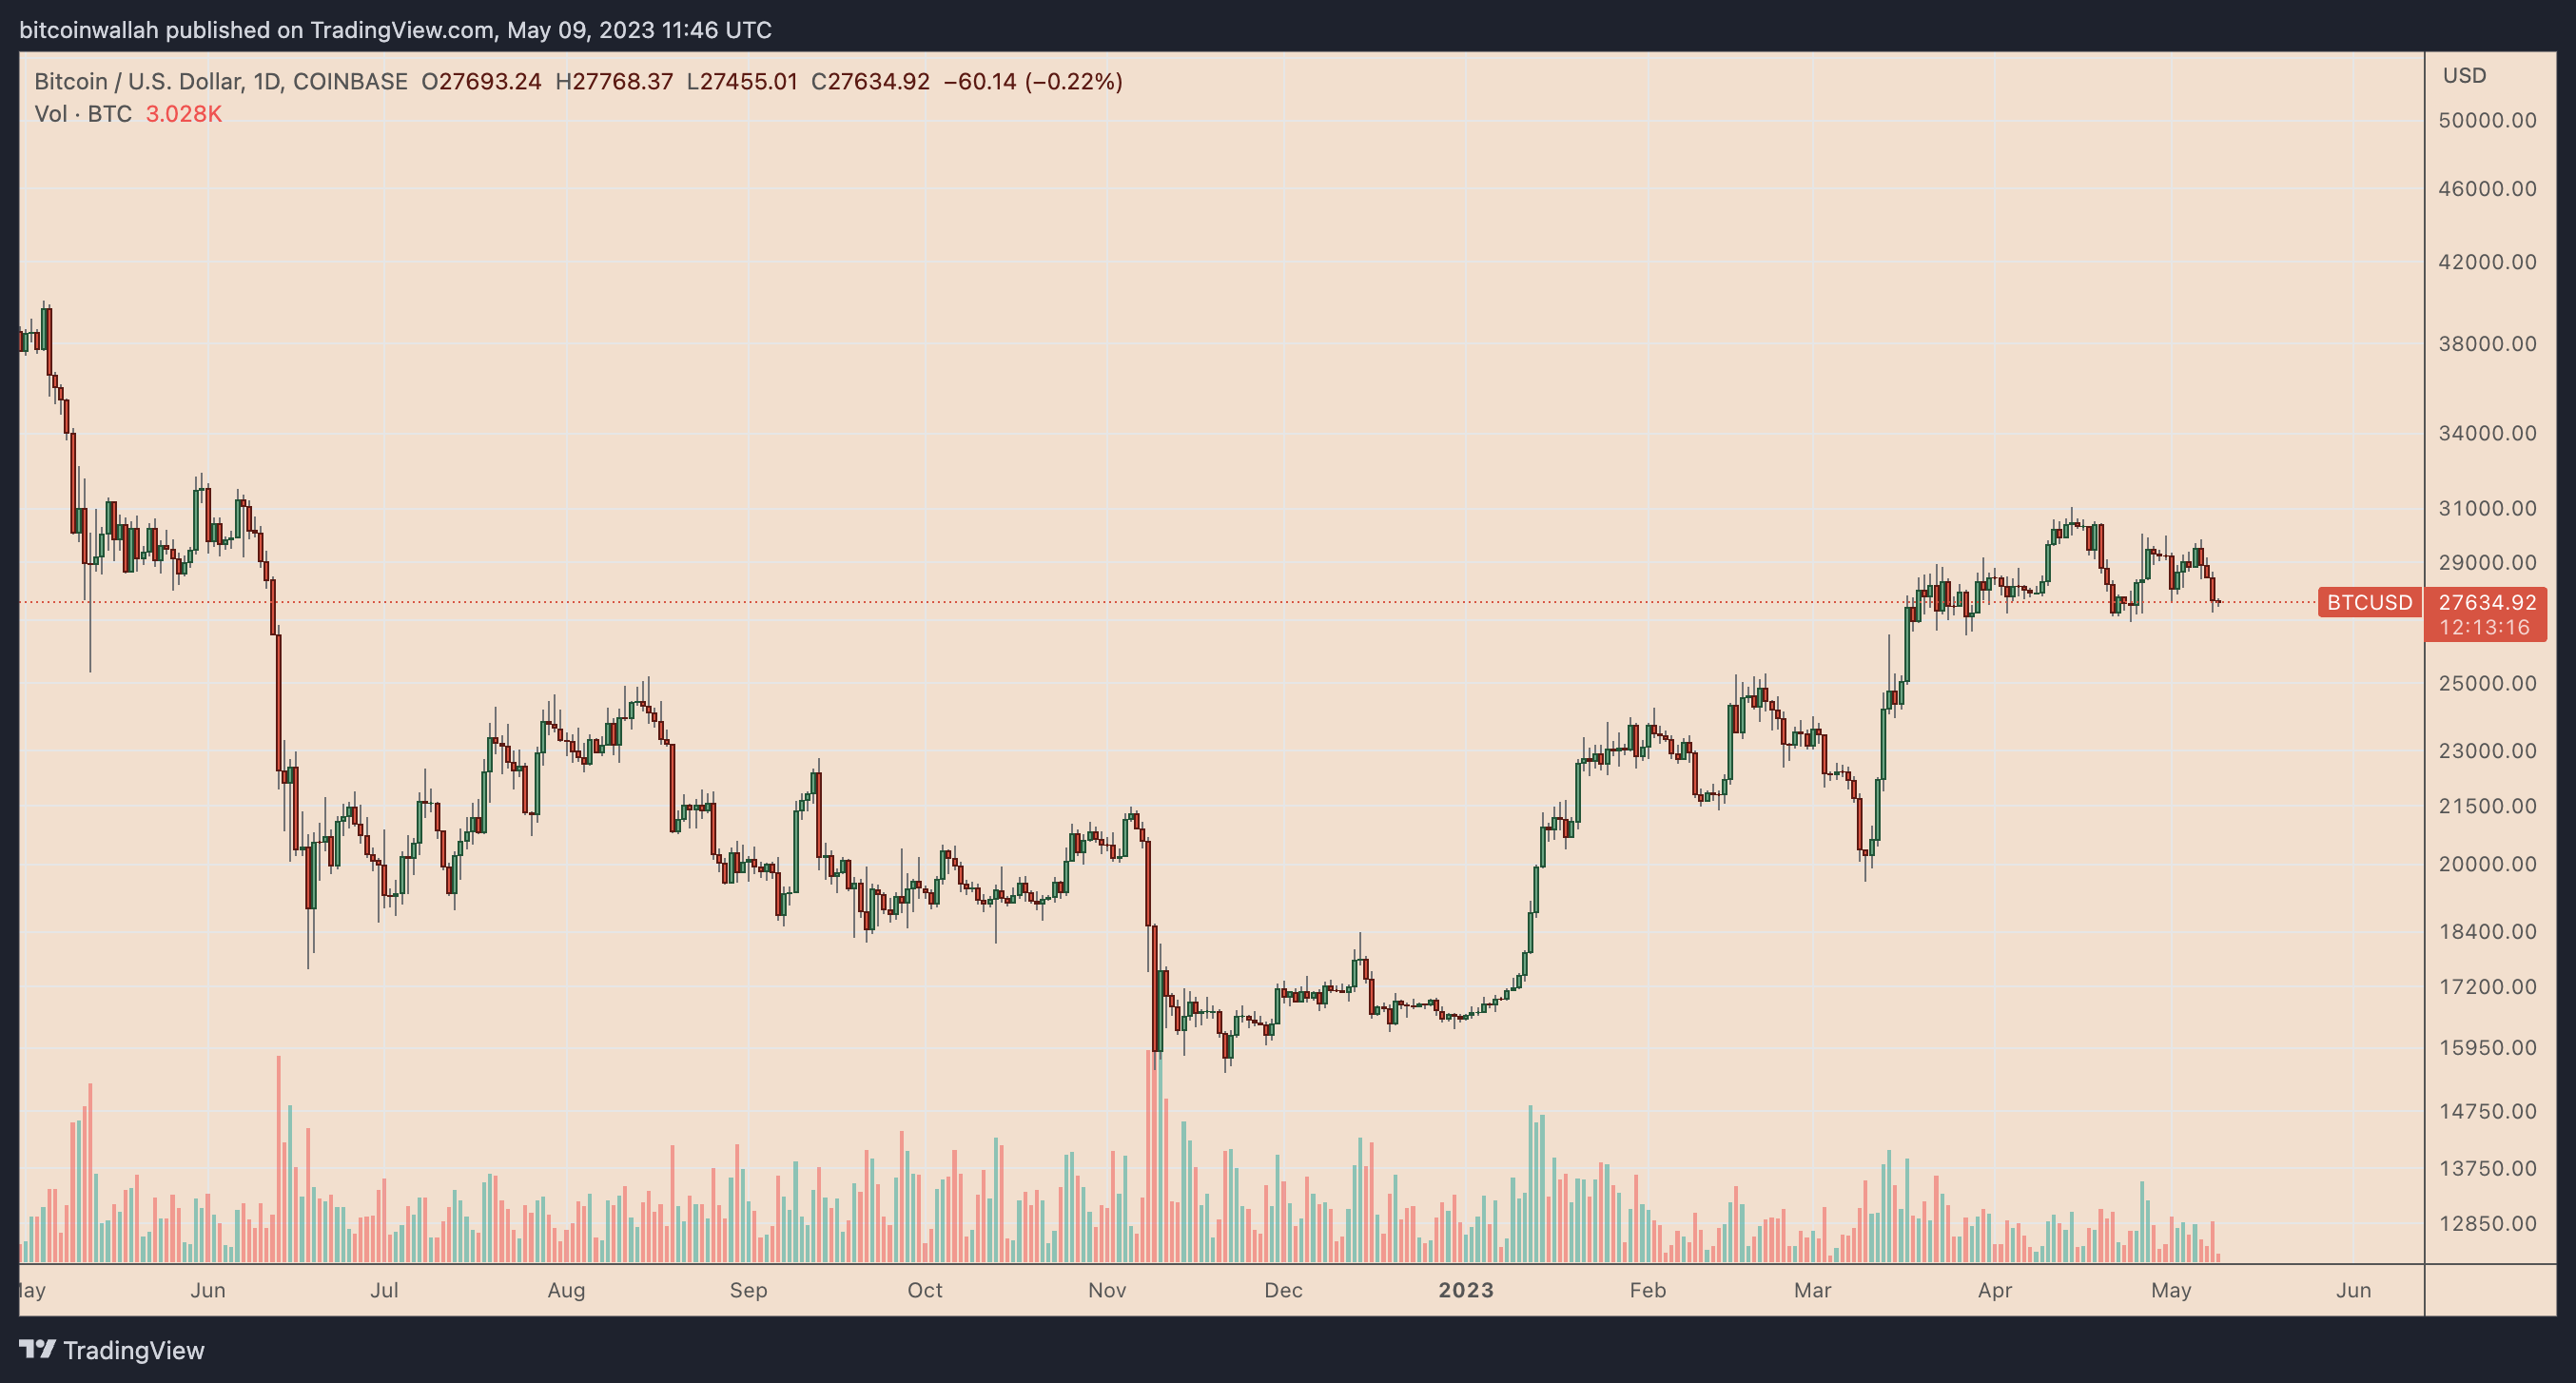
BTC/USD daily price chart. Source: TradingView
However, will this be a short-term downtrend, or is there more room for the price to fall? Let us examine the details.
H&S pattern suggests BTC could fall below $25,000
From a technical perspective, Bitcoin risks dropping below $25,000 in the short term.
This downside target is based on Bitcoin’s head-and-shoulders (H&S) pattern, which is confirmed by three peak formations atop a common support level. The middle peak, known as the “head,” is taller than the other two—the left and right shoulders—which are nearly equal in height.
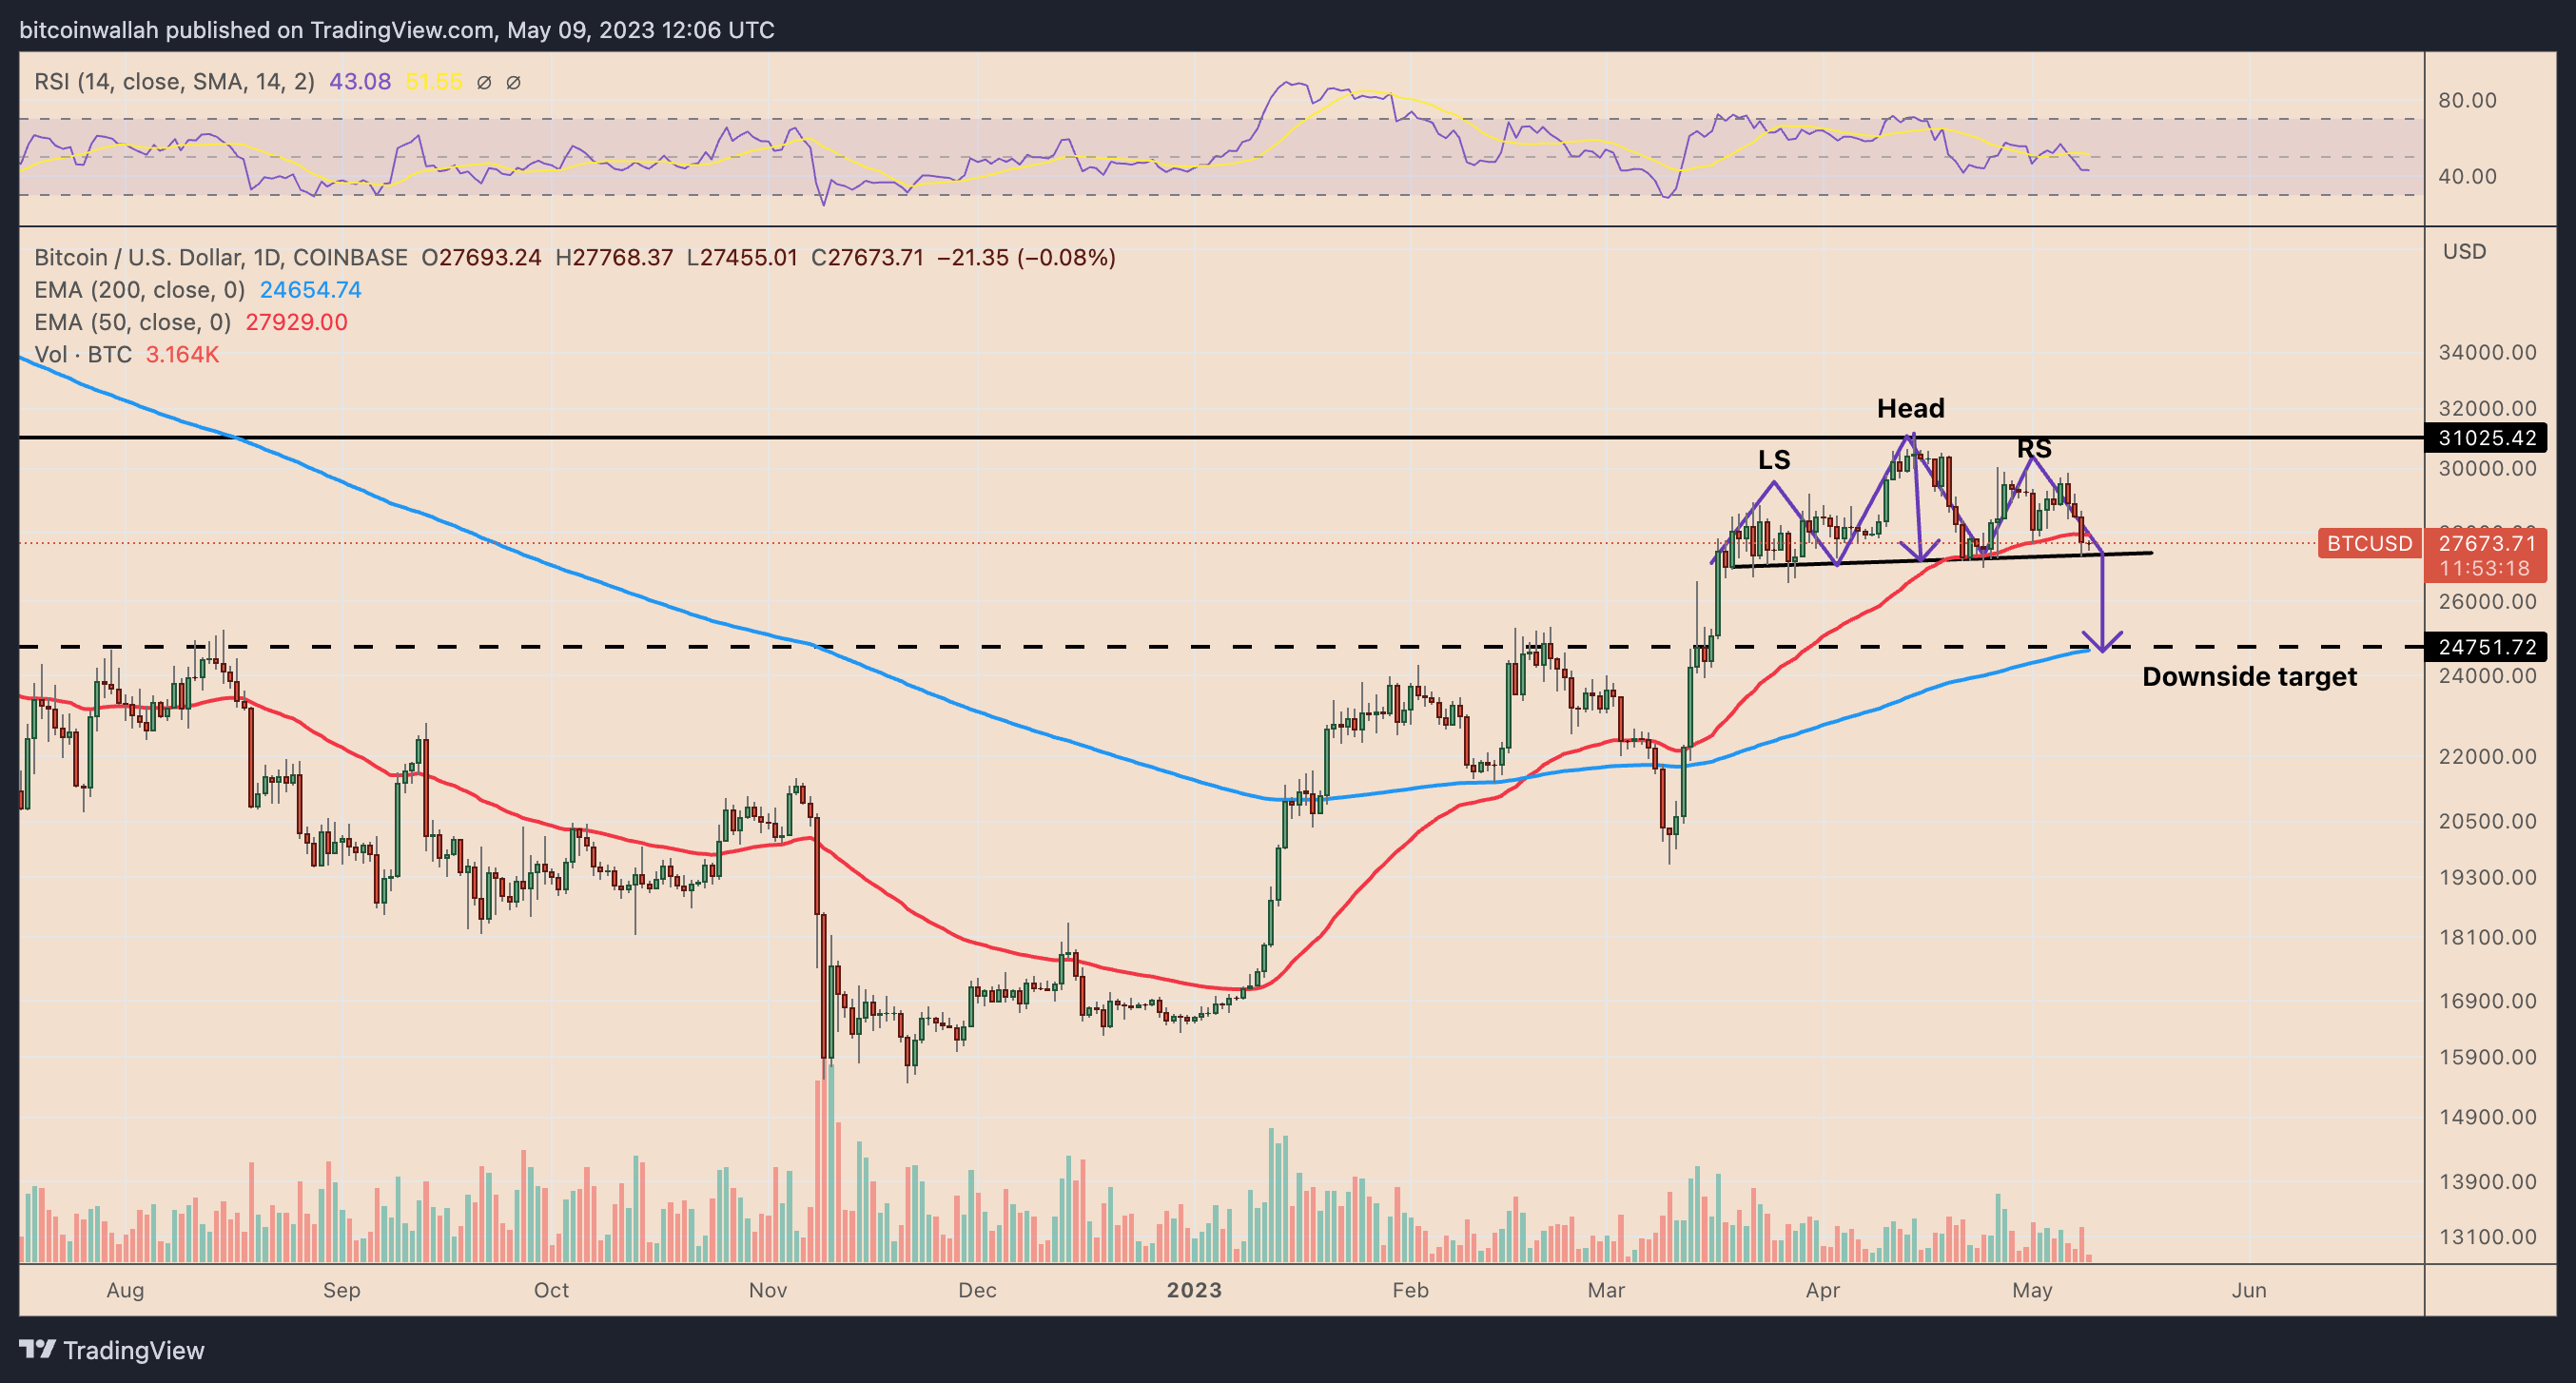
According to standard technical analysis, a decisive break below the H&S support level near $27,500 could cause the price to fall by an amount equal to the pattern’s maximum height—that is, the distance between the head and the support level.
This raises the possibility of Bitcoin dropping to $24,750 by June, a decline of approximately 10% from current price levels.
Additionally, independent market analyst Cold Blooded Shiller anticipates the Bitcoin price declining to $25,000, a former weekly resistance level, within the next two days.
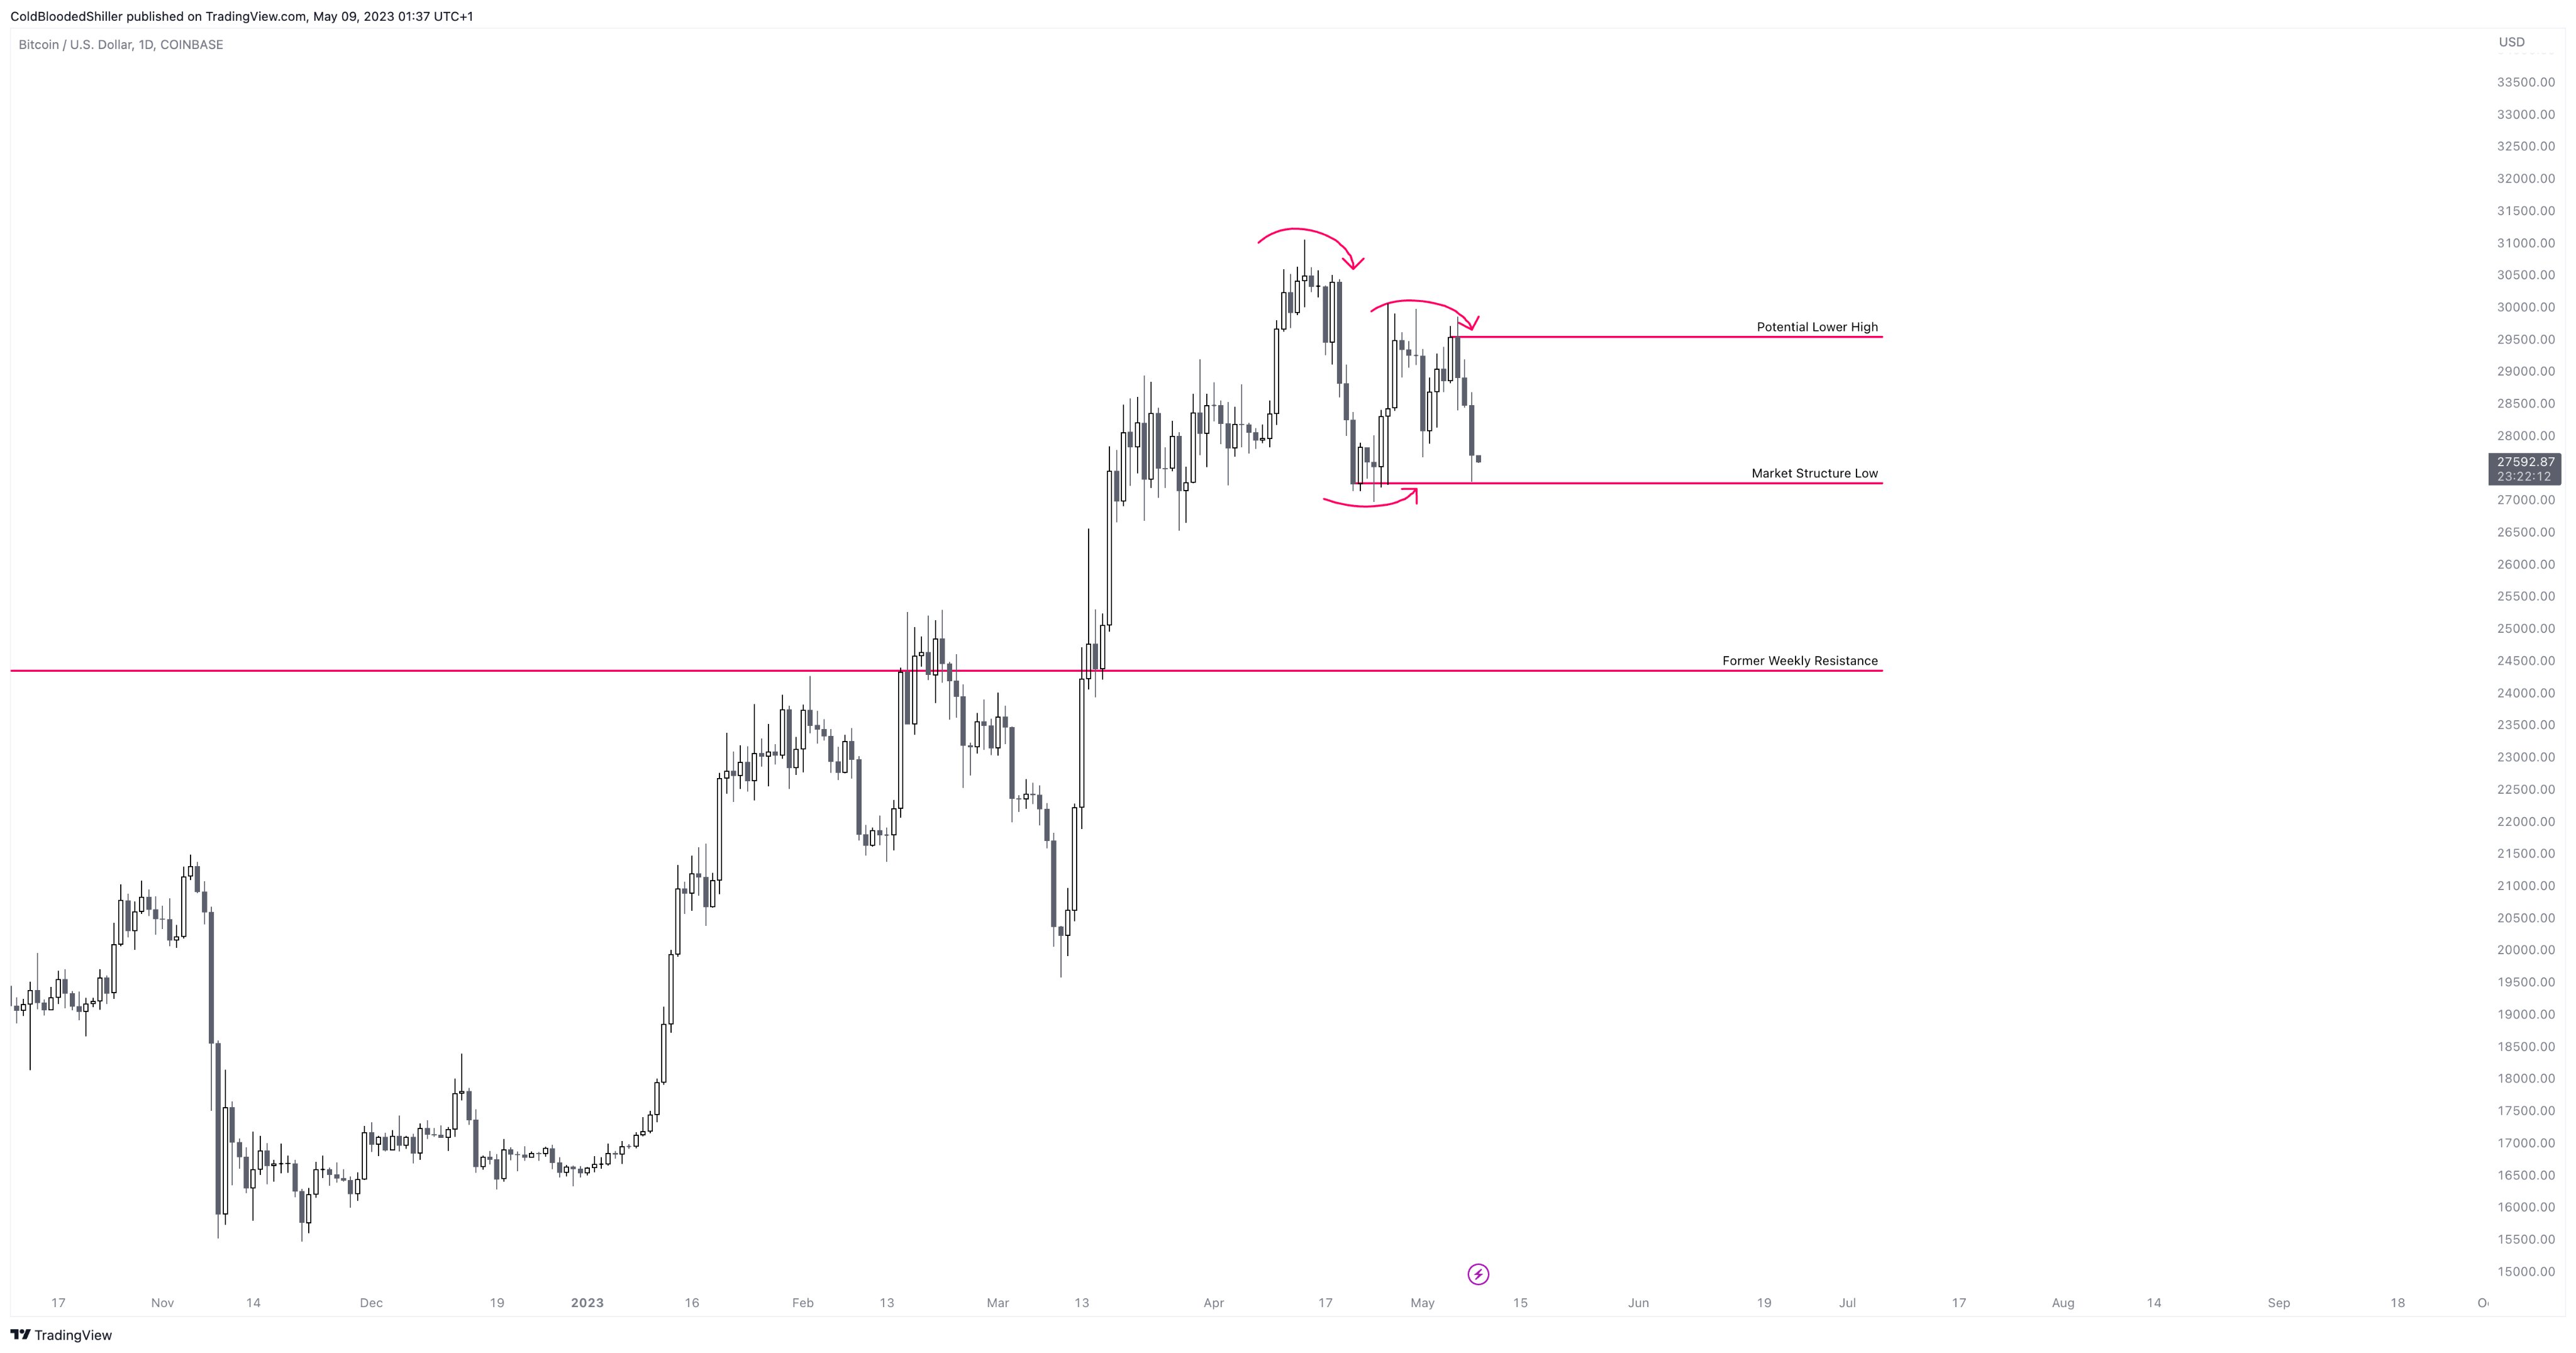
BTC/USD daily price chart. Source: TradingView/Cold Blooded Shiller
Related Posts
“I still think that if this snaps the structure it’s going to move very quickly (24-48 hours) towards that Weekly level,” the analyst tweeted, adding:
“[$27.5K] is one of the better potential defense points for BTC, but the crypto market has been trading incredibly weakly. Way out of line with its usual correlation to either indexes or metals.”
Conversely, a high-volume rebound from the H&S support would invalidate the bearish setup. A recovery toward $30,000 would then be back on the table.
April CPI data release
Bitcoin’s price has declined in the days leading up to the release of U.S. inflation data on May 10.
Notably, the core consumer price index (CPI), which excludes food and energy, could come in near 5.5% for April, almost the same as the previous month, according to Bloomberg.
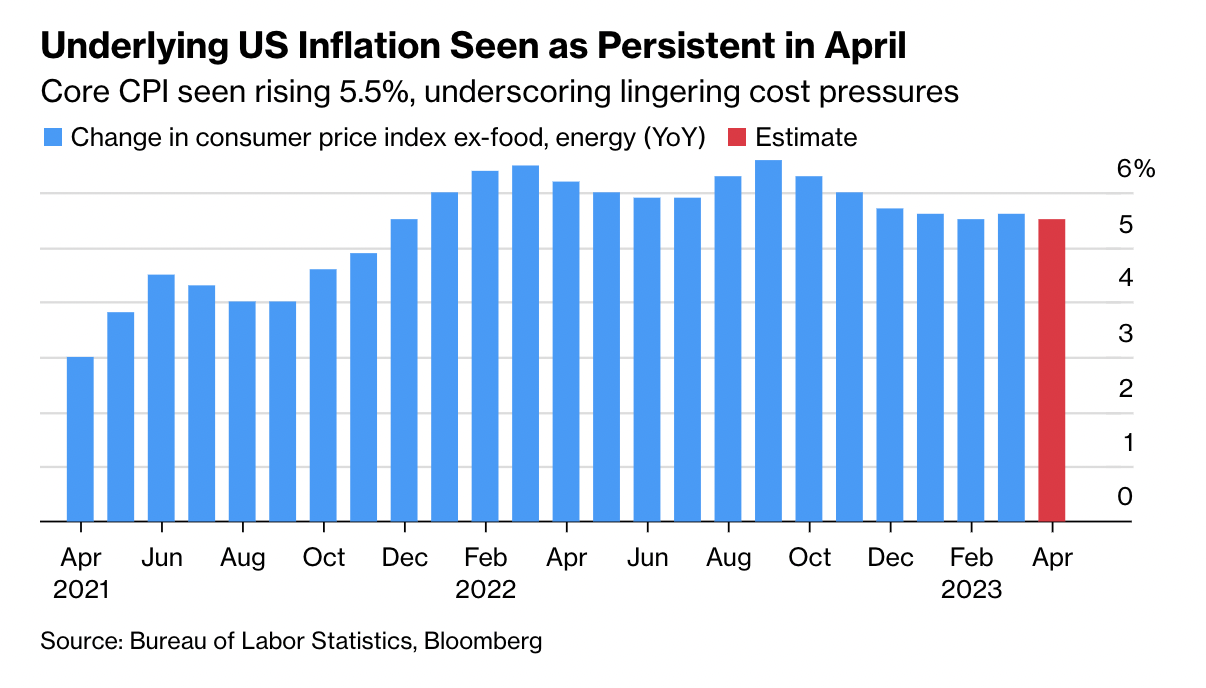
Core CPI projection in April 2023. Source: Bloomberg
This persistent CPI reading implies that the Federal Reserve would need to continue its interest rate hikes to bring inflation down to its preferred target of 2%.
Higher interest rates tend to reduce investors’ appetite for riskier, zero-yielding assets like Bitcoin. This fundamental factor aligns with the H&S price target for BTC/USD mentioned above.
Nevertheless, Jerome Powell, the chairman of the Federal Reserve, stated last week that the Fed would pause rate hikes in June to study how the U.S. economy has responded to higher interest rates and the ongoing banking sector crisis.
He ruled out the possibility of rate cuts, despite Fed funds futures data indicating the likelihood of at least five rate cuts between May 2023 and January 2024—a potential buy signal for Bitcoin investors.
Bloomberg economists noted:
“Fed Chair Jerome Powell said at the May FOMC meeting that rates might already be ‘sufficiently restrictive’ — but he needs more time to observe developments before he can have confidence in that judgment. Neither April’s CPI nor PPI prints will be reassuring, with both expected to show headline inflation accelerating.”
The views, thoughts, and opinions expressed here are the authors’ alone and do not necessarily reflect or represent the views and opinions of Cointelegraph.
