Disclaimer: Information found on CryptoreNews is those of writers quoted. It does not represent the opinions of CryptoreNews on whether to sell, buy or hold any investments. You are advised to conduct your own research before making any investment decisions. Use provided information at your own risk.
CryptoreNews covers fintech, blockchain and Bitcoin bringing you the latest crypto news and analyses on the future of money.
Bitcoin’s price movement resembles the trend that previously caused it to plummet to $60,000.
The latest price movements reflect the November–January trend, indicating a lack of strong conviction from the “buy the dip” investors.
 BTC‘s price pattern looks reminiscent of the previous decline to $60K. (GoranH/Pixabay)
Key points:
- Bitcoin’s current price movements resemble the November–January trend that preceded a steep decline from approximately $90,000 to nearly $60,000.
- The ongoing counter-trend recovery, characterized by a weak and erratic bounce within an overarching downtrend, indicates that the buy-the-dip investors are lacking vigor.
- A breach beneath the low of the most recent trading range may intensify the sell-off.
Bitcoin’s price movements are creating a sense of déjà vu, and it is not a favorable one.
Analyzing the price fluctuations since early February, a particular and concerning pattern is emerging that closely resembles what occurred between November and January. This pattern ultimately led to a significant sell-off, dropping to around $60,000.
This situation reflects what technical analysts often refer to as a counter-trend recovery – a slight rebound within an existing downtrend.
Here is the chart. Observe the two yellow channels.
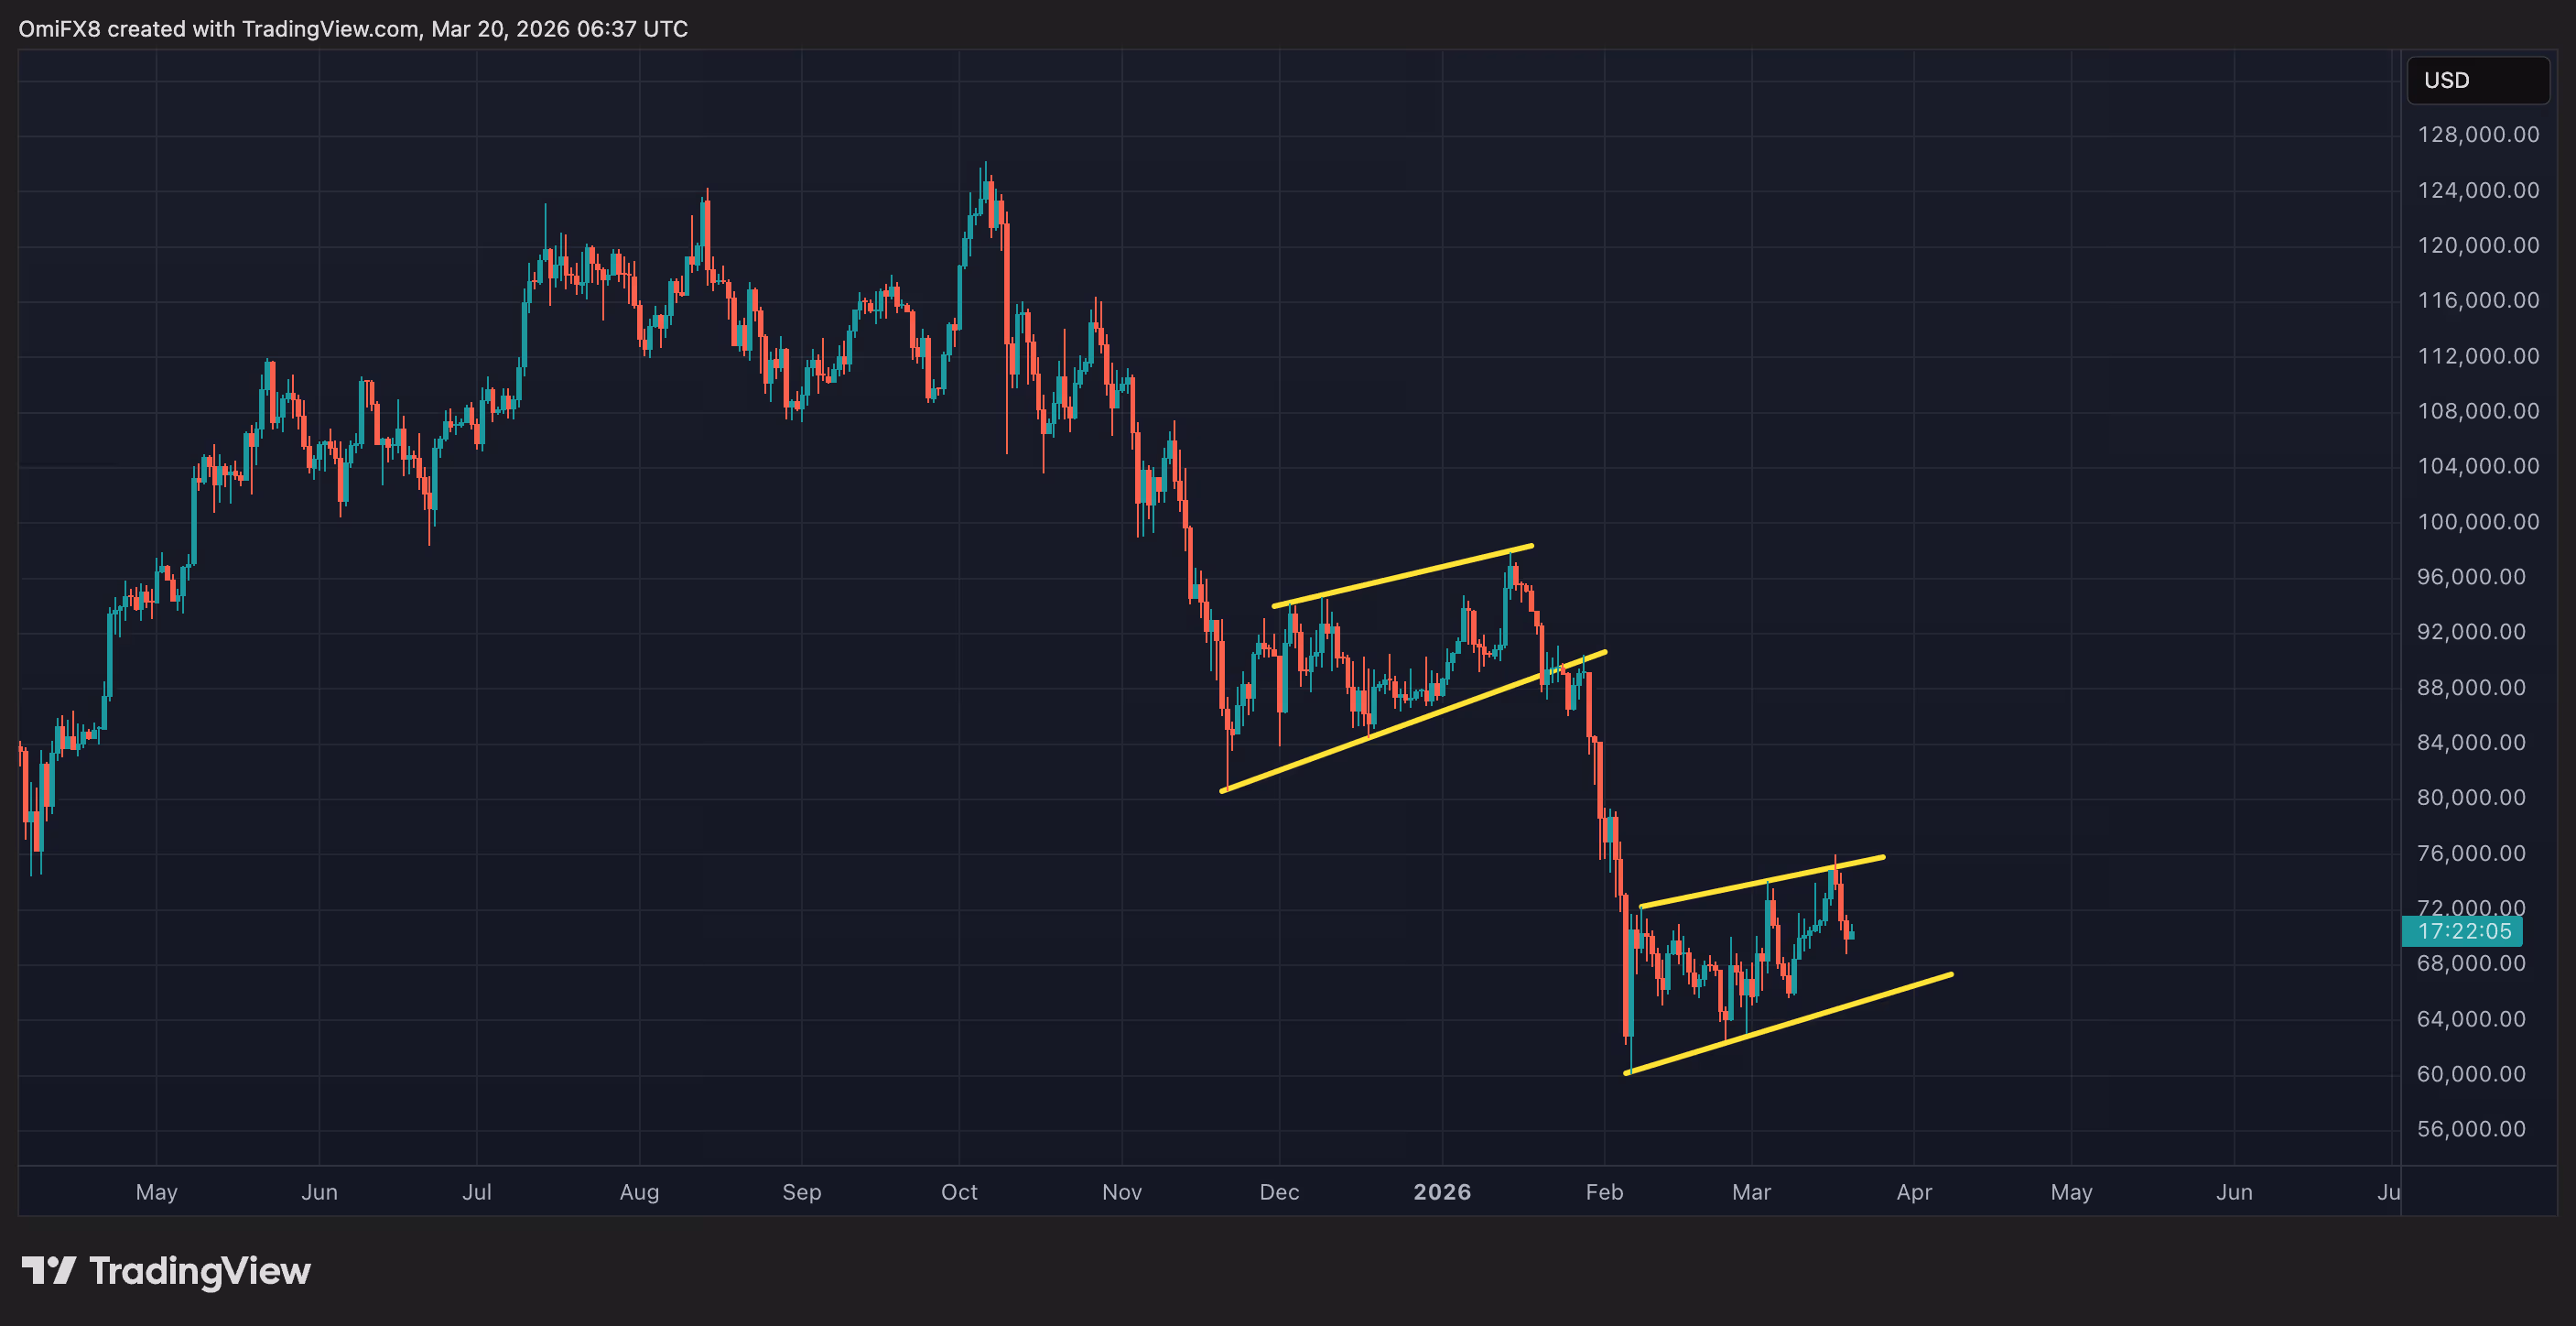 Bitcoin’s daily chart. (TradingView)
Related Posts
The initial yellow channel, located on the left, illustrates price movements from Nov. 20 to Jan. 20. During that period, bitcoin fluctuated within a tight range, showing a slight upward trend following a decline from $100,000. It appeared as if the price was recovering, but in reality, it was merely a pause – or a minor bounce – within a larger downward trend.
This led to the price ultimately breaking below the bottom of that trading range. The level that traders considered a “floor” or support eventually failed, resulting in bitcoin plummeting in a direct line from around $90,000 to nearly $60,000 by Feb. 6.
Now, observe the second channel on the right.
Following the lows in early February, bitcoin has once again traded within a tight range that shows an upward inclination, perfectly confined between those two trendlines.
The resemblance to the earlier pattern is unmistakable. The current relief rally lacks the explosive energy that characterized the November-January pattern. It is a gradual, erratic upward movement. According to technical analysis principles, this indicates bullish fatigue, with the market simply taking a breather before the bears regain their strength.
What’s next?
Charts are not infallible, and historical performance does not assure future outcomes. Nonetheless, traders utilize them to gauge market sentiment, and at this moment, they portray a narrative of a “buy the dip” crowd that is lacking in strength and assurance.
If bitcoin drops below the lower trendline of its existing channel, around $65,800, it may indicate the resurgence of bearish dominance.
The conclusion is that bitcoin stands at a critical juncture. The bear market could intensify, as some predict, should prices fall beneath the channel formation. Conversely, if it breaks out above the channel, the downtrend might lose momentum, allowing the bulls to mount a significant comeback.