Disclaimer: Information found on CryptoreNews is those of writers quoted. It does not represent the opinions of CryptoreNews on whether to sell, buy or hold any investments. You are advised to conduct your own research before making any investment decisions. Use provided information at your own risk.
CryptoreNews covers fintech, blockchain and Bitcoin bringing you the latest crypto news and analyses on the future of money.
Implied volatility metrics DVOL and BVIV indicate that maximum fear has subsided, with cryptocurrencies outpacing traditional markets in risk pricing.
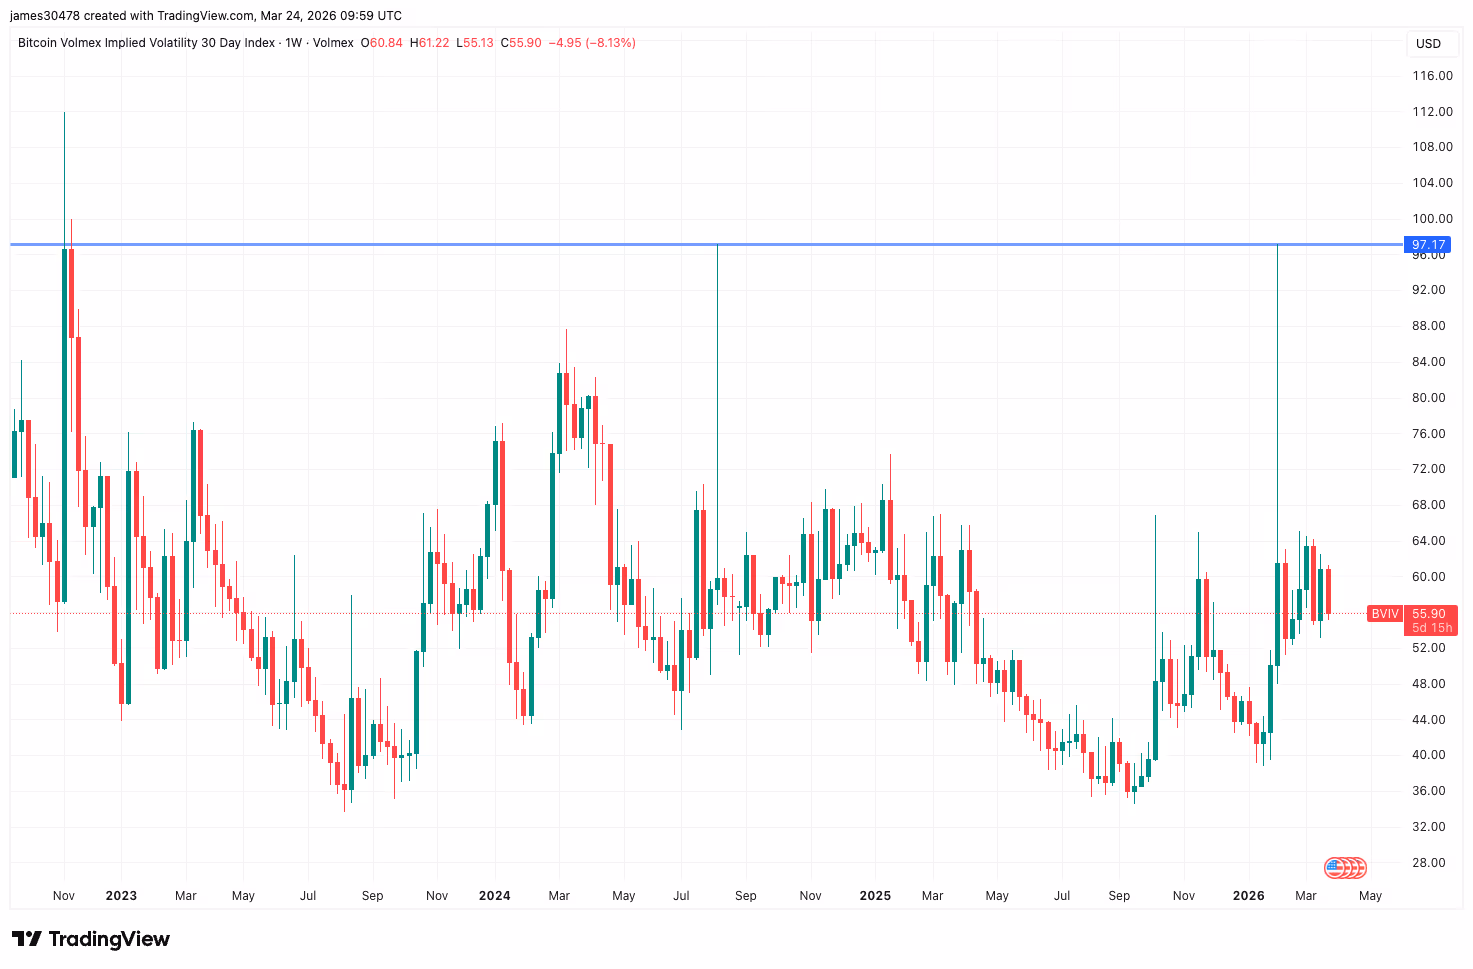 BVIV (TradingView)
Key points:
- DVOL and BVIV have reached levels indicative of previous cycle lows, signaling heightened implied volatility and maximum fear typically observed at market troughs.
- Bitcoin’s volatility peaked in February, whereas the VIX only spiked weeks later and remains below earlier crisis peaks, suggesting traditional markets may still be in adjustment mode.
Concerns exist that bitcoin could experience a more significant sell-off, but a notable indicator implies the lowest point may have already passed.
This indicator is the 30-day implied volatility, which represents an options-based assessment of anticipated price fluctuations over the coming month.
The commonly referenced 30-day implied volatility indices, such as Deribit’s DVOL and Volmex’s BVIV, jumped to 90% in early February when bitcoin plummeted to nearly $60,000. Historically, such volatility spikes have coincided with peak anxiety and capitulation, indicating price bottoms.
VIX-like contrary indication
Bitcoin’s market dynamics have increasingly paralleled Wall Street since the introduction of spot BTC ETFs in the U.S. in early 2024.
Related Posts
In this setting, implied volatility has come to function as a “fear gauge” and a contrary indicator akin to the VIX, a real-time measure of expected 30-day volatility for the S&P 500: It typically declines in stable markets but rises sharply during periods of intense fear that signify major market lows.
This behavior was evident earlier last month when bitcoin declined sharply. The ensuing demand for options, primarily puts, propelled DVOL and BVIV upwards to 90% and beyond in a manner consistent with previous capitulation instances, such as in August 2024, when prices fell to and stabilized around $50,000.
A similar scenario occurred in November 2022 when the FTX collapse triggered peak fear, driving implied volatility to 90%. At that juncture, bitcoin bottomed below $20,000.
Thus, if historical trends are indicative, the bitcoin downtrend that initiated in October at levels above $126,000 has likely concluded.
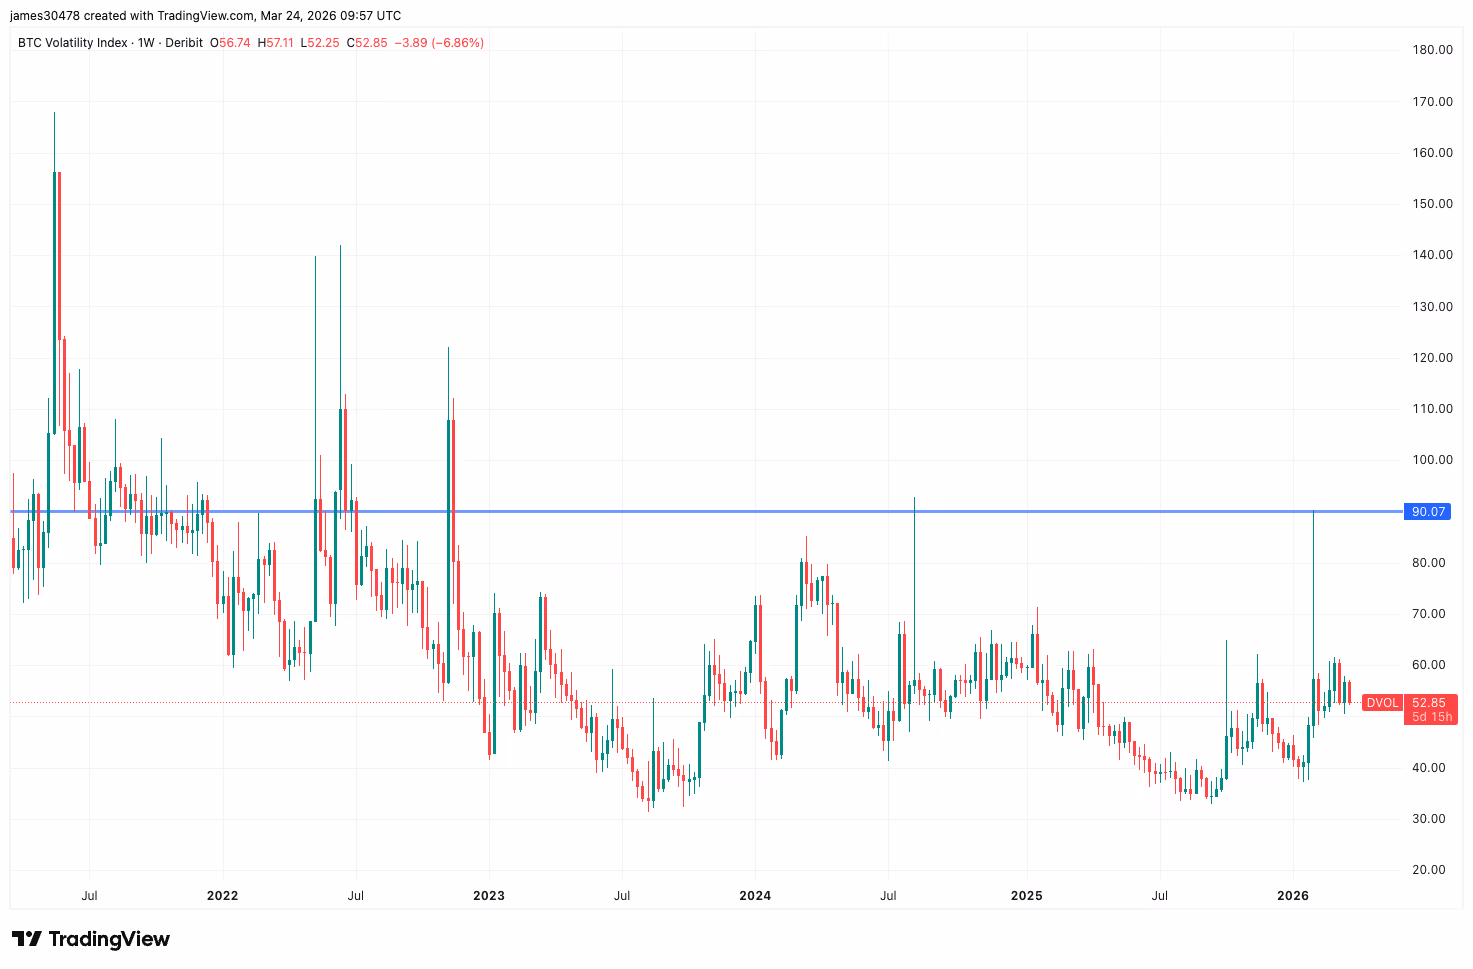 DVOL (TradingView)
Some may contend that one indicator is insufficient to draw conclusions, which is a reasonable perspective. However, its significance lies in its established function in traditional markets as a contrary indicator.
A significantly elevated VIX, well above its long-term average, is often seen as a strong contrarian buying signal for long-term investors, as it signifies peak market fear and “panic”.
Indeed, numerous Wall Street strategies utilize the VIX as a “background indicator” to initiate systematic equity purchases. For example, quantitative mean reversion funds employ models where a VIX significantly diverging higher from its long-term average prompts an automated increase in equity leverage.
On the topic of the VIX, it reached a one-year peak of 35% on March 9, nearly a month after the surge in bitcoin volatility. The VIX has remained elevated throughout 2026 but has stayed below previous dislocation peaks exceeding 60, observed during Liberation Day in April 2025.