Disclaimer: Information found on CryptoreNews is those of writers quoted. It does not represent the opinions of CryptoreNews on whether to sell, buy or hold any investments. You are advised to conduct your own research before making any investment decisions. Use provided information at your own risk.
CryptoreNews covers fintech, blockchain and Bitcoin bringing you the latest crypto news and analyses on the future of money.

- Bitcoin (BTC) price reached its lowest point in three months at $25.3K on Saturday.
- BTC supply last active over 1-5 years achieved a new all-time high.
Following a significant downturn in altcoins, cryptocurrency prices are showing signs of recovery. Notably, Bitcoin’s (BTC) price has retraced into the $26,000 range.
Last week, Bitcoin experienced its lowest weekly close in the last three months. Data from TradingView indicates that the BTC price concluded at $25,350. Currently, this leading cryptocurrency is poised to retest its macro downtrend breakout. At the time of writing, BTC was trading at $26,111, reflecting a 0.97% increase.
Bitcoin (BTC) Price: Breakout or Breakdown?
Expert traders are sharing their analyses, highlighting two opposing scenarios for BTC — a potential breakout to the upside or a breakdown to the unfavorable downside.
Firstly, Lark Davis, a well-known crypto influencer, expressed his view on the likelihood of BTC breaking the downtrend, akin to the market movements in 2015 and 2019. His analysis included two indicators: the BraveNewCoin Bitcoin Liquid Index (BNC-BLX) and the monthly MACD.
Related Posts
Is it really this easy?
Simple Bitcoin chart.
Long term downtrend line has broken.
Monthly MACD edging closer to a bullish cross. Previous crosses have signaled the start of massive rallies. pic.twitter.com/9LyFDOu7oM— Lark Davis (@TheCryptoLark) June 13, 2023
According to the chart, the MACD line is approaching the signal line. If a bullish cross occurs, BTC would confirm its upward movement. Conversely, another notable crypto analyst, RektCapital, pointed out the signals indicating a potential breakdown.
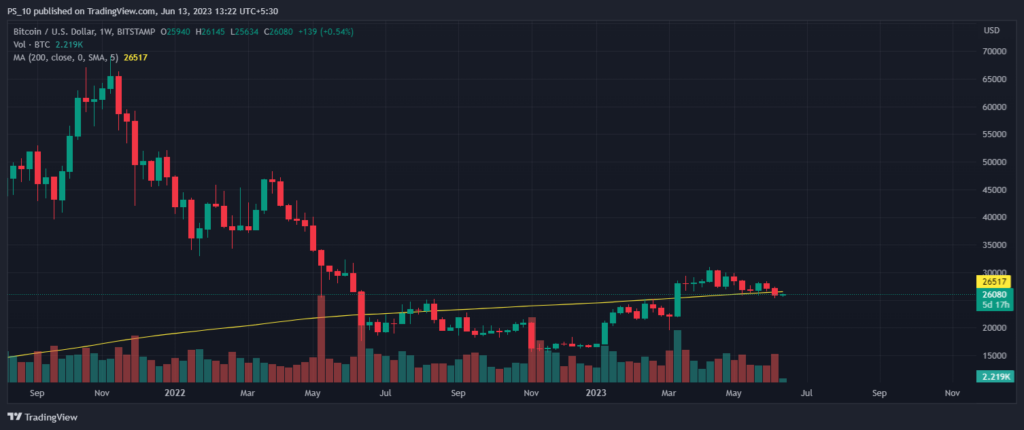 BTC/USD Weekly Price Chart (Source: TradingView)
His analysis focused on the recent weekly close of Bitcoin (BTC) below the 200 EMA, which is around $26K. At the time of his analysis, the BTC/USD price was near the 200 EMA line. An upward trend would invalidate the breakdown signals, while the opposite would confirm new lows for the cryptocurrency.
Additionally, the accumulation of BTC by large whales has reached an “equilibrium,” as reported by Glassnode. The prevailing market sentiment for Bitcoin (BTC) has also shifted into the fear zone.
Meanwhile, this leading cryptocurrency continues to receive significant support from the global crypto community. Notably, on Monday, 500 supporters in Argentina formed a 40-meter “B” for Bitcoin by holding orange umbrellas. On Saturday, the BTC logo was projected onto the walls of the central bank of the Czech Republic. Over five years ago, the bank’s statement — “Don’t be afraid of Bitcoin” — attracted attention from Bitcoin advocates and criticism from proponents of fiat currency.
Recommended For You:
SUI Token Rebounds From All-Time Low, A Promising Recovery?