Disclaimer: Information found on CryptoreNews is those of writers quoted. It does not represent the opinions of CryptoreNews on whether to sell, buy or hold any investments. You are advised to conduct your own research before making any investment decisions. Use provided information at your own risk.
CryptoreNews covers fintech, blockchain and Bitcoin bringing you the latest crypto news and analyses on the future of money.

U.S. Ground Operation in Iran and Cryptocurrencies: A Comparative Analysis, 2026/03/27 21:29:21


Opinion The primary factor driving price changes in the last month has been the military actions of the United States and Israel against Iran in the Middle East. During periods of calm, cryptocurrencies have seen growth. Speculation about a new escalation of the conflict led to a weekly correction in digital assets.
Related Posts
Bitcoin
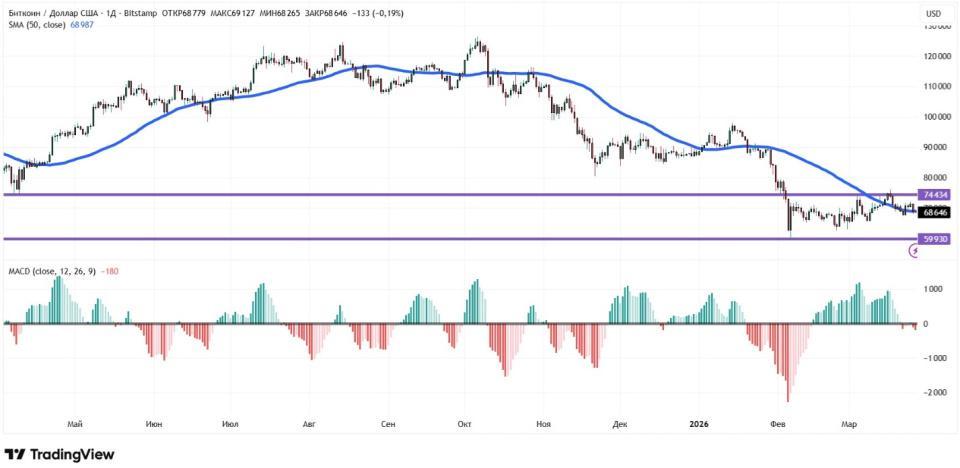
From March 20 to 27, 2026, Bitcoin’s price fell by 2.75%. The leading cryptocurrency is once again trading below the key psychological level of $70,000. For most trading sessions, five out of seven, Bitcoin was on the losing side this week.
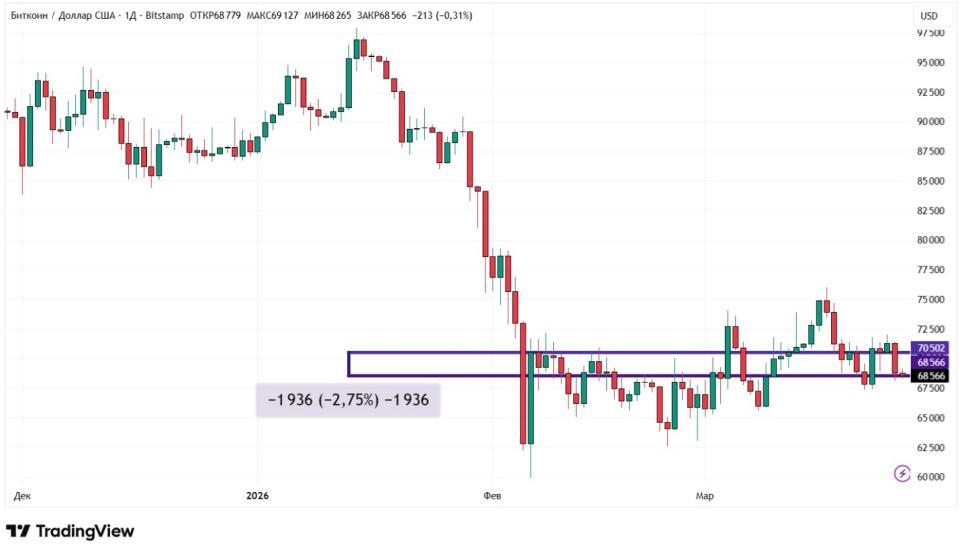
Source: tradingview.com
BTC continues to face pressure due to uncertainty regarding the timeline for the end of the conflict in the Middle East. On the positive side, U.S. President Donald Trump extended the ceasefire on strikes against Iranian energy infrastructure until April 6. Additionally, the U.S. side proposed a 15-point plan to de-escalate the conflict, although it was not supported by the Islamic Republic.
There is an increasing number of news reports about the likelihood of a U.S. ground operation. On the Myriad platform, which functions as a decentralized prediction market, the probability of U.S. troops being deployed to Iranian territory by May 1 exceeds 60%. This unstable situation inevitably causes fluctuations among crypto investors.
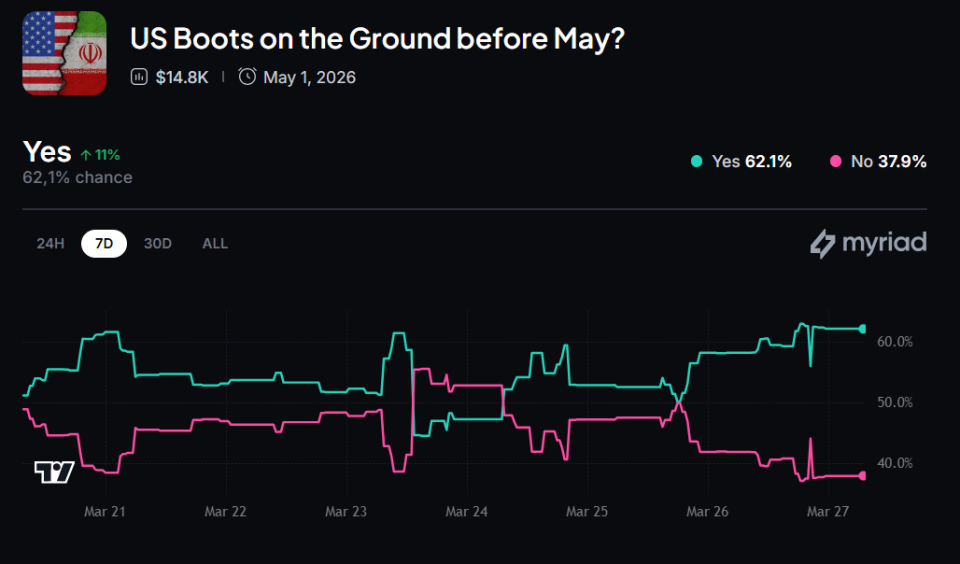
Source: myriad.markets
The Coinbase Premium indicator, which reflects the difference in sentiment between users of the largest U.S. crypto exchange and those who prefer its offshore competitor Binance, remained negative for almost the entire week, with rare exceptions. Typically, during a bullish trend, corporate investors from the U.S. show greater interest in digital assets than crypto enthusiasts in other regions. For example, this was the case in 2024. In March 2026, the picture is reversed: it demonstrates a reluctance of U.S. capital to actively invest in Bitcoin. In other words, bearish sentiment prevails.
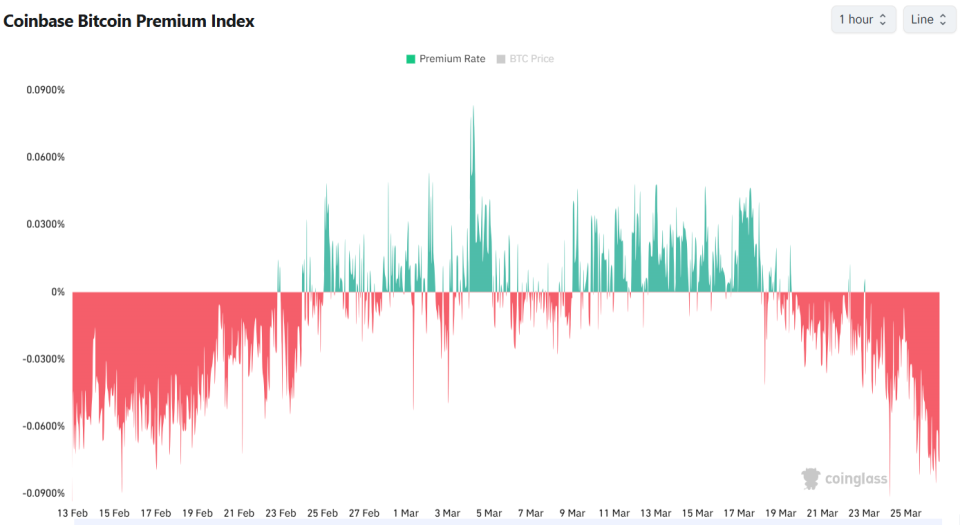
Source: coinglass.com
Spot Bitcoin ETFs broke a four-week streak of inflows. This time, a total outflow of $70.71 million was recorded. The majority of this amount, $50.93 million, came from Grayscale’s fund, Grayscale Bitcoin Trust (GBTC).
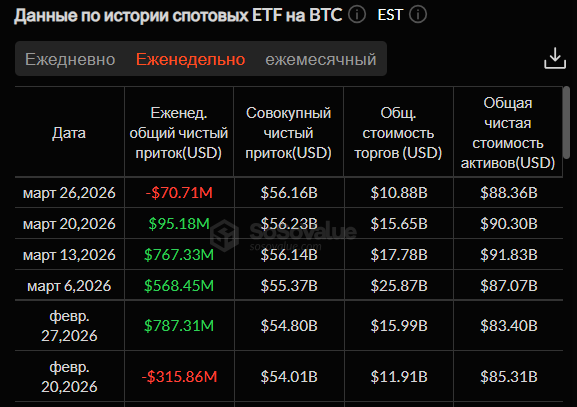
Source: sosovalue.com
From a technical analysis perspective, Bitcoin is trading in a clear range. By the end of March, momentum, according to indicators, belonged to the bears. The price fell below the 50-day moving average (marked in blue). Additionally, the MACD histogram moved from the positive to the negative zone, which is also a bearish signal. The nearest support and resistance levels on the daily chart are $59,930 and $74,434, respectively.
Source: tradingview.com
The Fear and Greed Index increased by two points compared to last week. Its current value is 13. The index still indicates that extreme fear dominates crypto investor sentiment.
Ethereum
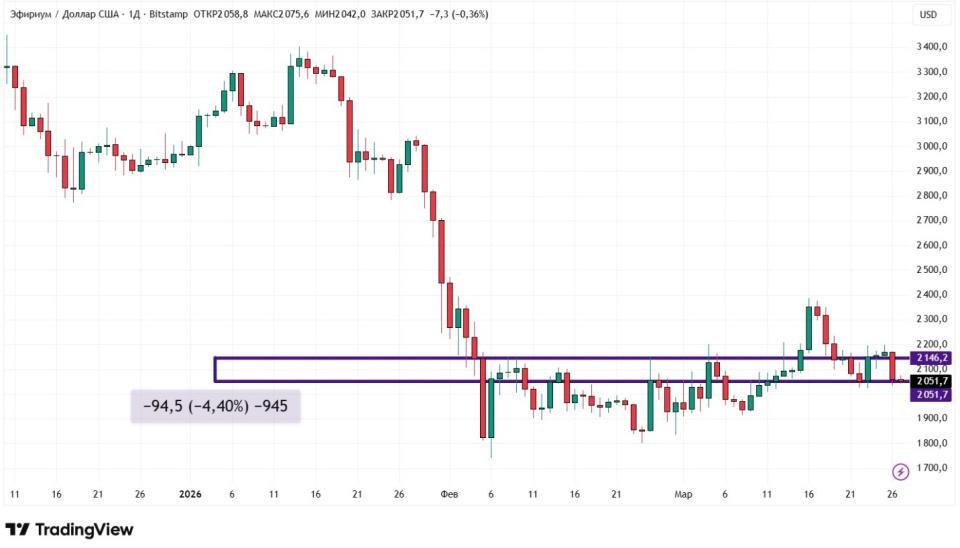
Ether dropped by 4.4% from March 20 to 27. ETH made unsuccessful attempts throughout the week to reach the $2,200 mark. The trading session on March 26, when ether fell by 5.03%, was the worst for the second-largest cryptocurrency in over a month, since February 23.
Source: tradingview.com
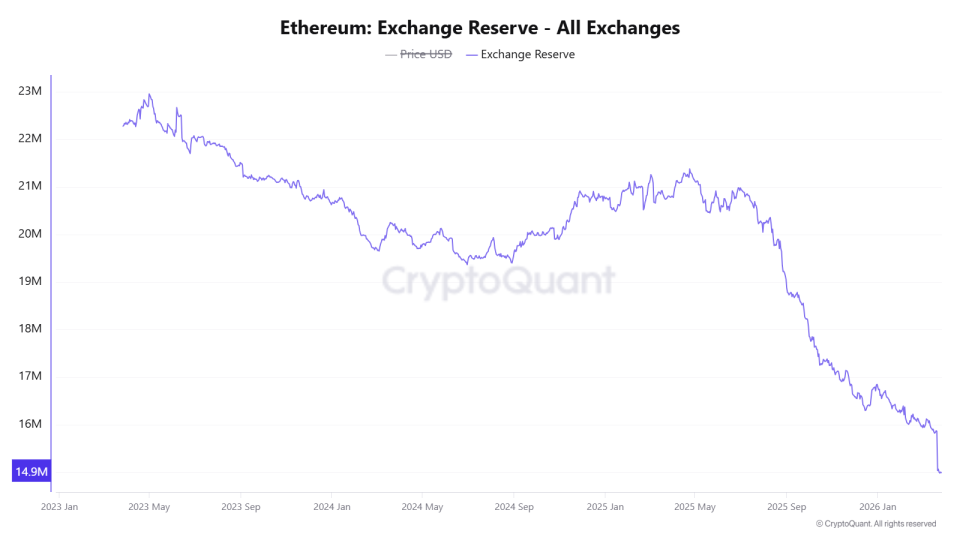
The amount of ETH on crypto exchanges continues to decline. According to the analytics platform CryptoQuant, on March 27, this figure dropped below 15 million coins.
Source: cryptoquant.com
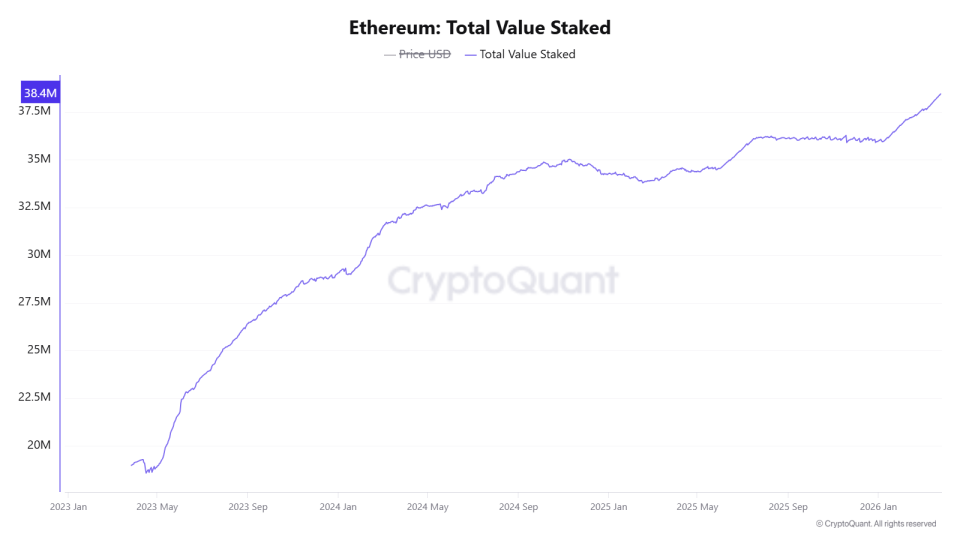
This is largely due to continued user interest in staking. The amount of ETH in staking at the end of March exceeded 38.4 million coins, which accounts for approximately 32% of the total circulation.
Source: cryptoquant.com
A decrease in supply on exchanges is usually a signal for price growth. However, no increase in ETH price is observed. This is largely due to weak demand from corporate investors.
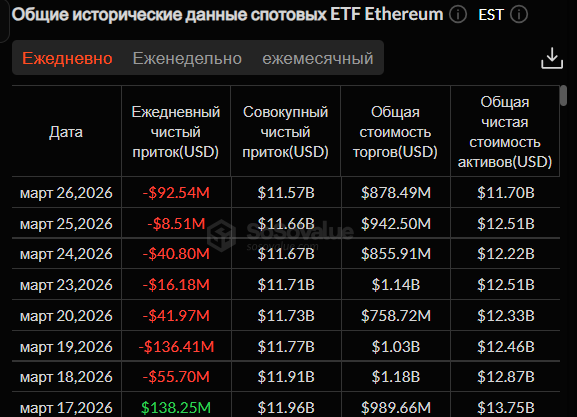
This is confirmed by the dynamics of spot Ethereum ETFs. A series of trading sessions with outflows from these products reached six days. The largest outflow, amounting to $92.54 million, occurred on Thursday, March 26. The most activity was observed around two BlackRock funds: iShares Ethereum Trust (ETHA) and iShares Staked Ethereum Trust ETF (ETHB). Investors withdrew $140.24 million from the first, while $96.81 million was deposited into the newer second fund.
Source: sosovalue.com
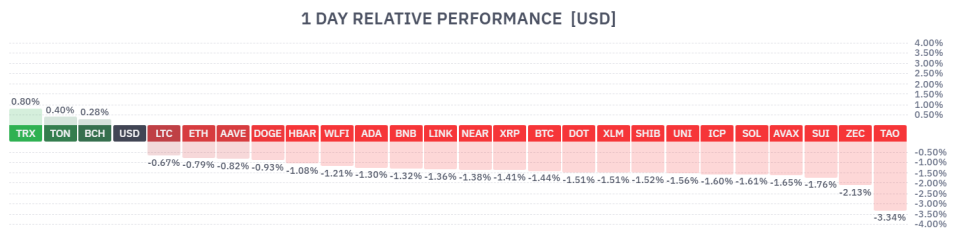
Another factor negatively affecting ETH is the strong dollar. When the U.S. currency strengthens, other assets struggle to rise. Given the increase in energy costs, everything typically considered a “safe haven” comes under pressure.
Source: finviz.com
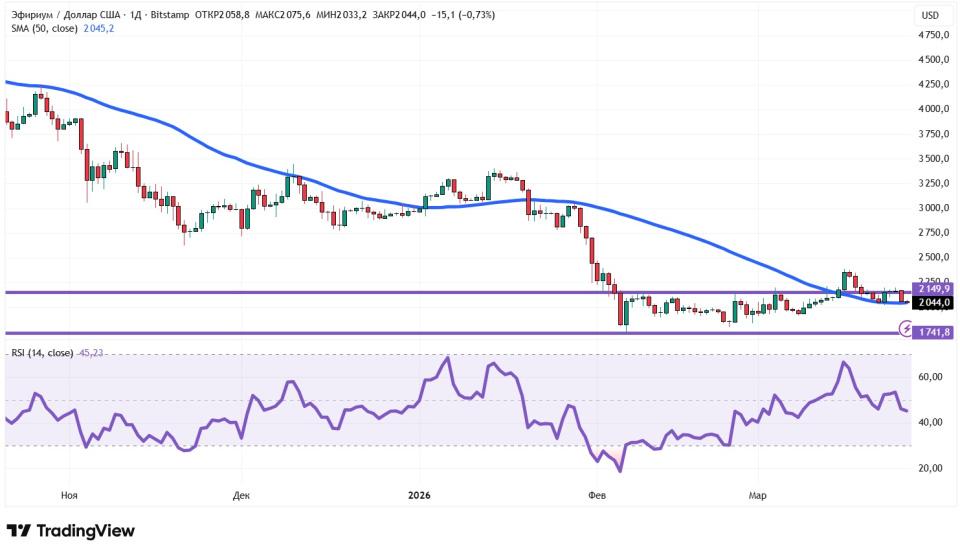
From a technical analysis perspective, Ethereum does not have a clearly defined trend. The price is near the 50-day moving average (marked in blue): it sometimes exceeds it and sometimes falls below it. The rise above the resistance level of $2,149.9 from March 15 to 19 turned out to be a bullish trap. The RSI dropped below 50, which also indicates seller (bear) dominance. The long-term support level on the daily chart is $1,741.8.
Source: tradingview.com
Tron
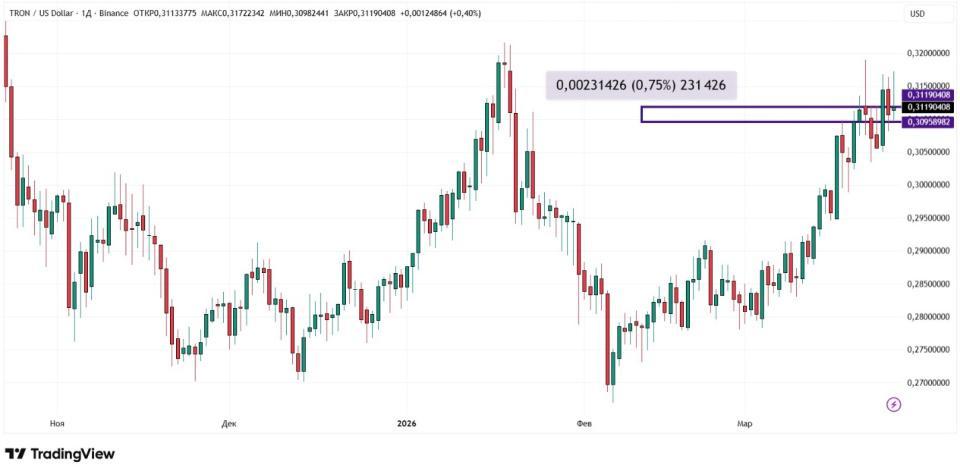
Tron increased by 0.75% from March 20 to 27. This is the only cryptocurrency in the top 10 by market capitalization that showed growth last week. However, volatility remains low: none of the trading sessions changed the price by more than 3%.
Source: tradingview.com
Tron, whose shares are traded on the Nasdaq exchange and which is behind the eponymous cryptocurrency, continued to increase its reserve of its own TRX tokens. Last week, the company purchased an additional 160,835 coins. The company’s total balance reached 688.5 million TRX. Such a significant purchase not only contributed to the growth of the cryptocurrency’s price but also instilled confidence in crypto investors.
Crypto bank Anchorage Digital announced the integration of the Tron blockchain. In the first stage, this concerns custodial services. The partnership will allow large clients to store Tron cryptocurrency through the bank’s platform in a non-custodial Porto wallet. Later, Anchorage Digital plans to add support for all TRC-20 standard assets, as well as TRX staking.
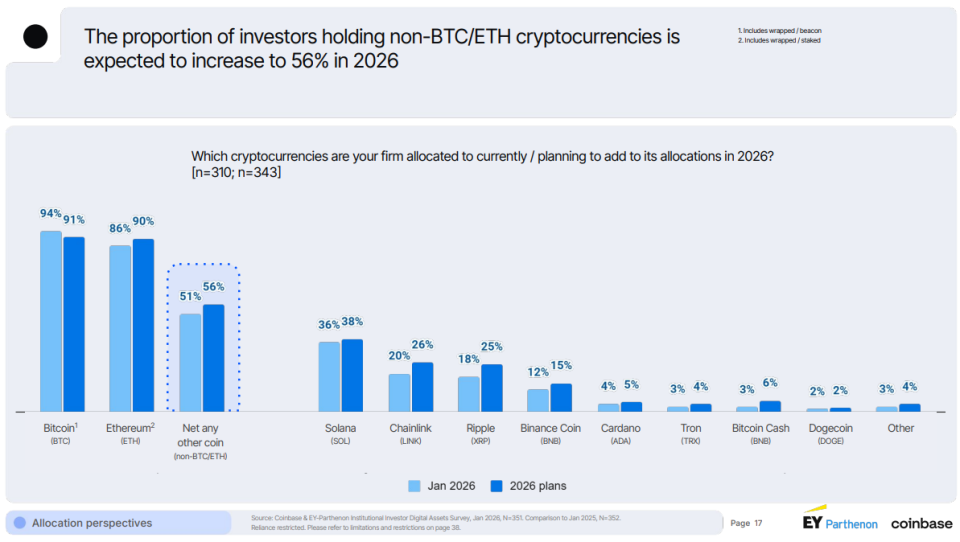
It is worth noting a survey conducted by the crypto exchange Coinbase. According to its results, the number of legal entities willing to invest in cryptocurrencies other than Bitcoin and Ethereum reaches 56%. The share of corporate (institutional) investors willing to invest in Tron by the end of the year was 4% — slightly higher than the 3% recorded in January.
Source: coinbase.com
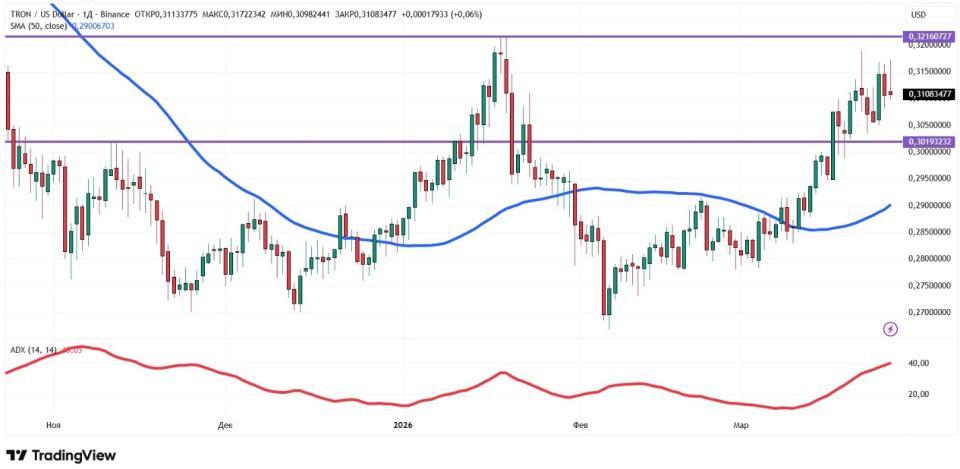
From a technical analysis perspective, Tron’s trend is upward. This is confirmed by the fact that the price is above the 50-day moving average (marked in blue). The trend is strengthening, as evidenced by the growth of the ADX indicator. The nearest support and resistance levels on the daily chart are $0.302 and $0.322, respectively.
Source: tradingview.com
Conclusion
The week for Bitcoin and Ethereum was marked by a decline. Investors are afraid of further escalation of the military conflict in the Middle East, which could occur due to a U.S. ground operation in Iran. The growth of Tron is explained by increased interest in the coin from corporate investors.
This material and the information contained herein do not constitute individual or other investment advice. The editorial opinion may not coincide with the opinions of analytical portals and experts.
