Disclaimer: Information found on CryptoreNews is those of writers quoted. It does not represent the opinions of CryptoreNews on whether to sell, buy or hold any investments. You are advised to conduct your own research before making any investment decisions. Use provided information at your own risk.
CryptoreNews covers fintech, blockchain and Bitcoin bringing you the latest crypto news and analyses on the future of money.


Opinion
Related Posts
U.S. President Donald Trump announced a ceasefire in the conflict with Iran until April 22. Crypto investors welcomed the news with optimism. However, there are aspects that have limited and will continue to limit the price growth of major crypto assets.
Bitcoin
Bitcoin increased by 6.76% from April 3 to April 10, 2026. The largest cryptocurrency by market capitalization firmly established itself above the important psychological mark of $70,000. BTC volatility remains at a low level: only by the end of one trading session on Tuesday, April 7, did the price change by more than 3%.
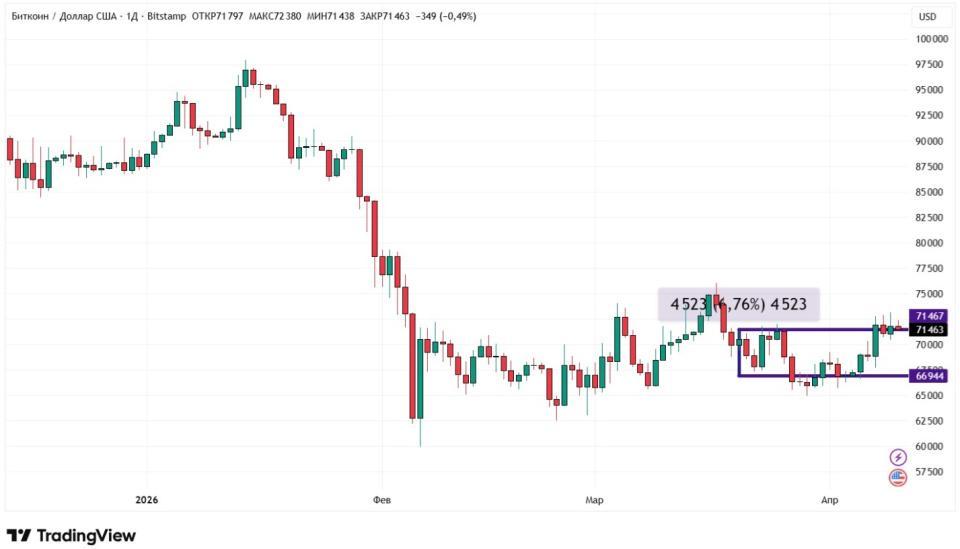
Source: tradingview.com
The main reason for Bitcoin’s growth was the announcement of a two-week ceasefire in the Middle East. According to the agreement, Iran must open the Strait of Hormuz. In turn, the U.S. committed to not undertaking active military actions for fourteen days. Against this backdrop, Bitcoin managed to rise to $73,000, where its growth was halted. The reason is that signing a ceasefire is one thing, but adhering to it is another. The Strait of Hormuz remains under threat. Israel, which acted jointly with the U.S. against Iran, shifted its focus to attacks on the terrorist group Hezbollah in Lebanon. This cooled the enthusiasm of crypto investors, who switched to a wait-and-see mode.
Bitcoin may also have been influenced by the U.S. inflation statistics published on April 9. The main indicator for February stood at 2.8%, with the core rate at 3%. Both values matched the Dow Jones consensus forecast. Compared to January, both overall and core inflation increased by 0.4%. This also matched the forecast. However, forecasts for U.S. population income and GDP have now been revised downward. Given that the published statistics were lagging and contained nothing unusual, the crypto market reacted without sharp fluctuations.
Spot Bitcoin ETFs recorded a cash inflow for the second consecutive week. This time, it amounted to $545.9 million. The majority of this sum, $474.5 million, went to BlackRock’s fund, iShares Bitcoin Trust (IBIT).
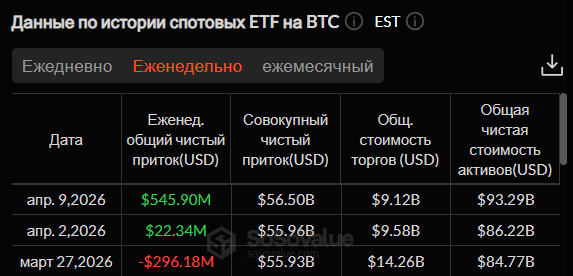
Source: sosovalue.com
According to technical analysis, Bitcoin remains in a sideways movement. Although the price exceeded the 50-day moving average (marked in blue), the resistance zone between $72,000 and $76,000 has not yet been broken. The Stochastic oscillator has risen into the overbought zone (above 80) — a bearish (sell) signal. The support level on the daily chart is $65,000.
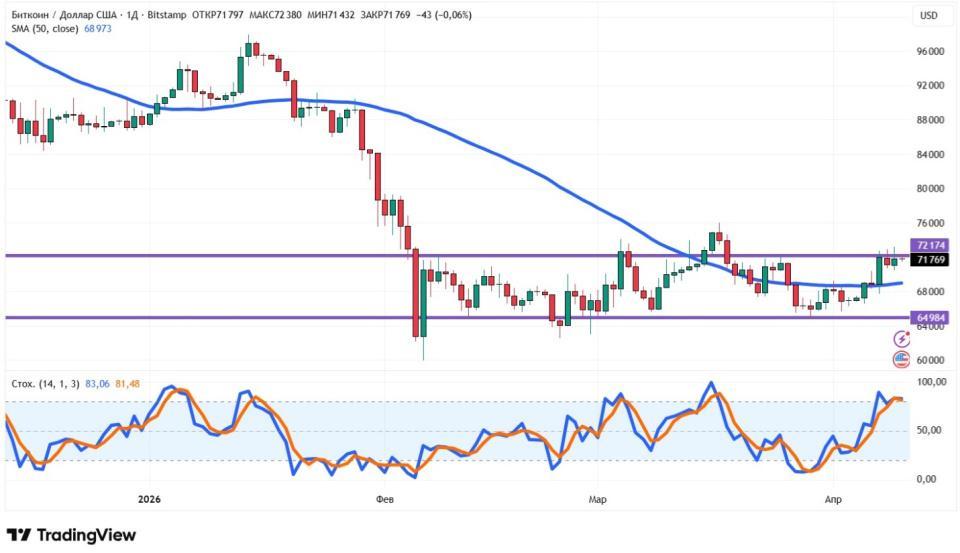
Source: tradingview.com
The Fear and Greed Index increased by seven points compared to last week, reaching 16. Extreme fear still predominates in crypto investor sentiment.
Ethereum
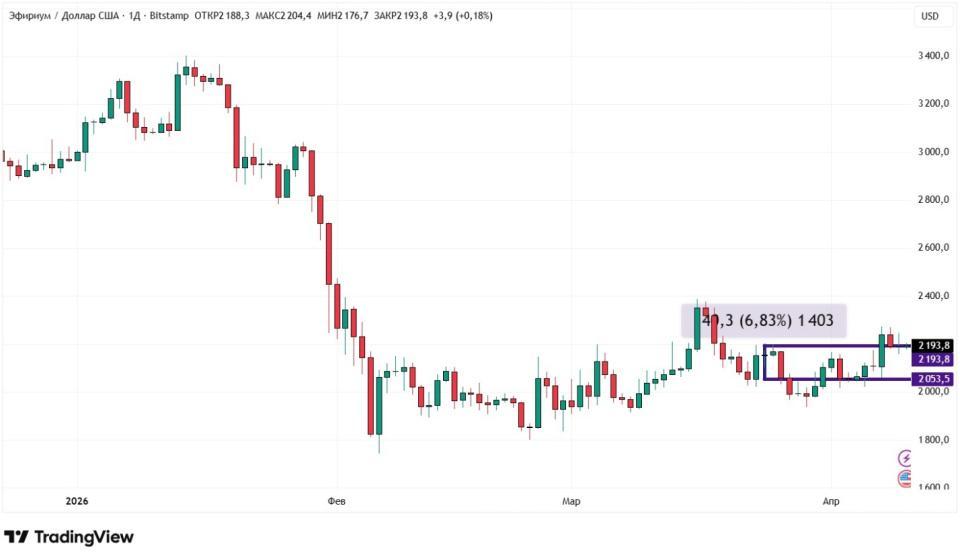
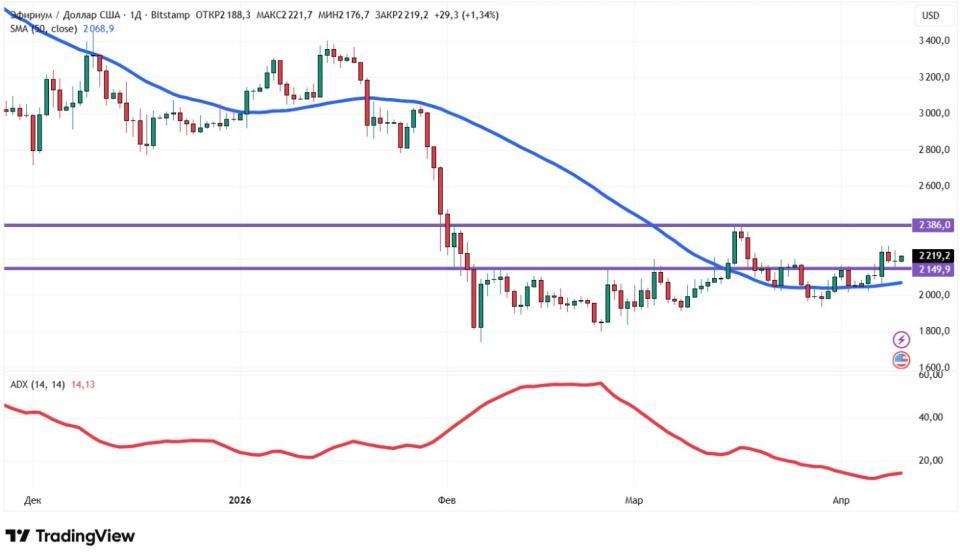
The price of Ether increased by 6.83% from April 3 to April 10. This allowed ETH to update its three-week high. Most of the growth occurred during one trading session on Tuesday, April 7, when Ether increased by 6.32%.
Source: tradingview.com
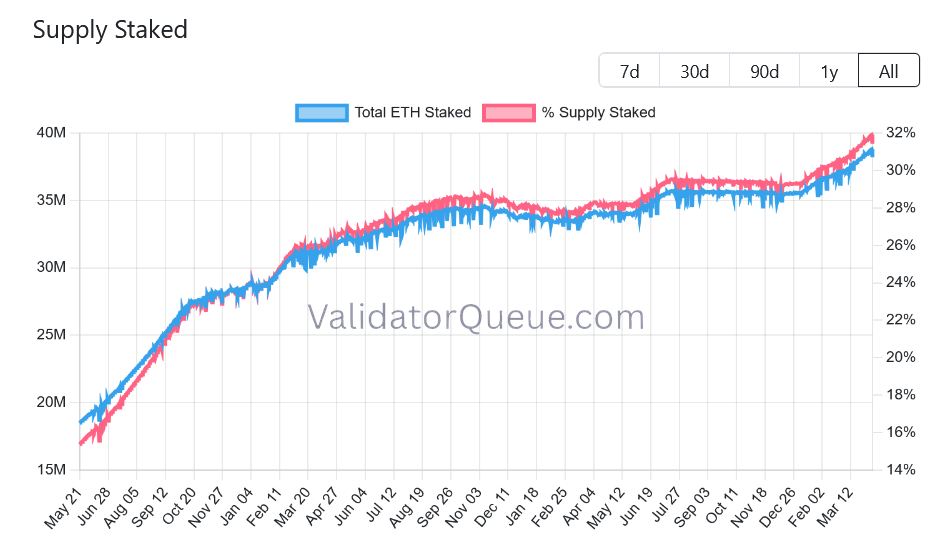
The positive dynamics of the second-largest cryptocurrency by market capitalization were caused not only by international tensions but also by record staking figures. The number of coins staked in this way exceeded 38.5 million for the first time last week. This not only confirms increased investor interest in Ether but also reduces the free supply of ETH. The latter has a favorable effect on the price.
Source: validatorqueue.com
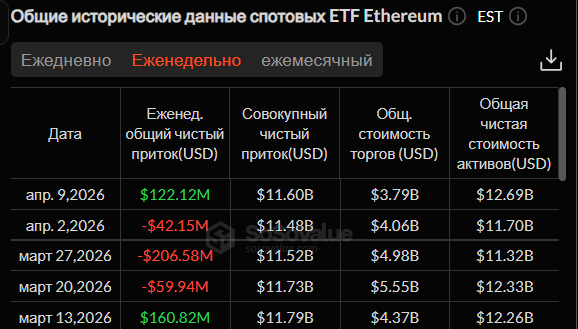
Spot Ethereum ETFs broke a three-week period of cash outflows. This time, an inflow of $122.12 million was recorded. The majority of the sum, $114.66 million, went to BlackRock’s fund, iShares Ethereum Trust (ETHA).
Source: sosovalue.com
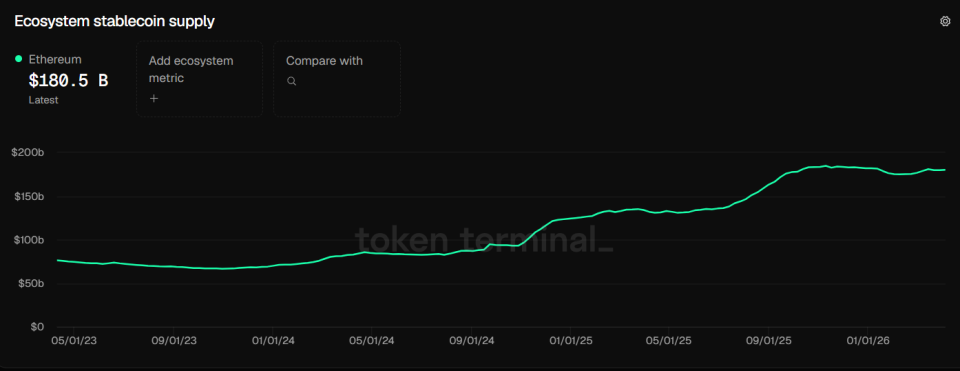
Ether is supported by the volume of stablecoins in the Ethereum blockchain — near an all-time high. In monetary terms, the volume amounted to $180.5 billion. According to Ethereum itself, its share of the stablecoin market is 60%. They are the cornerstone of decentralized finance (DeFi). An increase in the supply of stablecoins should likely lead to increased activity on the Ethereum network.
Source: tokenterminal.com
From a technical analysis perspective, buyers have taken the initiative. This is evident from the fact that the price exceeded the 50-day moving average (marked in blue). However, the strength of the trend is very weak, as confirmed by the low value of the ADX indicator (14.13). Support and resistance levels on the daily chart: $2,149.9 and $2,386.
Source: tradingview.com
Polygon
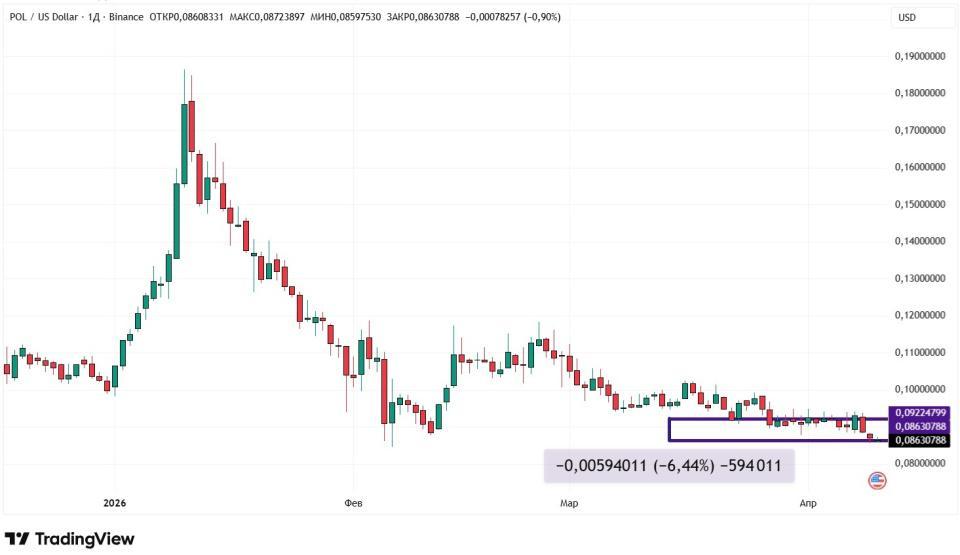
The price of Polygon cryptocurrency decreased by 6.44% from April 3 to April 10. POL continues to trade close to its all-time low recorded in February. Last week, Polygon cryptocurrency demonstrated negative dynamics during every trading session, except for Tuesday, April 7, when the coin increased by 3.31%.
Source: tradingview.com
The main news of the past week was the activation of the Giugliano hard fork. The main feature of the update is the reduction of transaction finalization time (the time when it becomes irreversible) to two seconds. Additionally, Giugliano will allow the implementation of EIP-1559 parameters in block headers. This, in turn, will allow decentralized applications (dApps) to request gas prices directly, without third-party assistance.
The hard fork, conducted on April 8, was supported by cryptocurrency exchanges. The South Korean trading platform Upbit and the multinational platform Binance announced a temporary suspension of POL deposits and withdrawals on that day. Polygon trading on these exchanges continued in normal mode. The actions of Upbit and Binance are a common practice in the crypto industry, demonstrating interest in POL from major players.
Polygon Labs, the company behind Polygon, has begun seeking $100 million in funding for the further development of its stablecoin payment system, Open Money Stack. In January 2026, Polygon Labs already acquired Sequence, a provider of non-custodial digital wallets, and Coinme, a company focused on cryptocurrency payments.
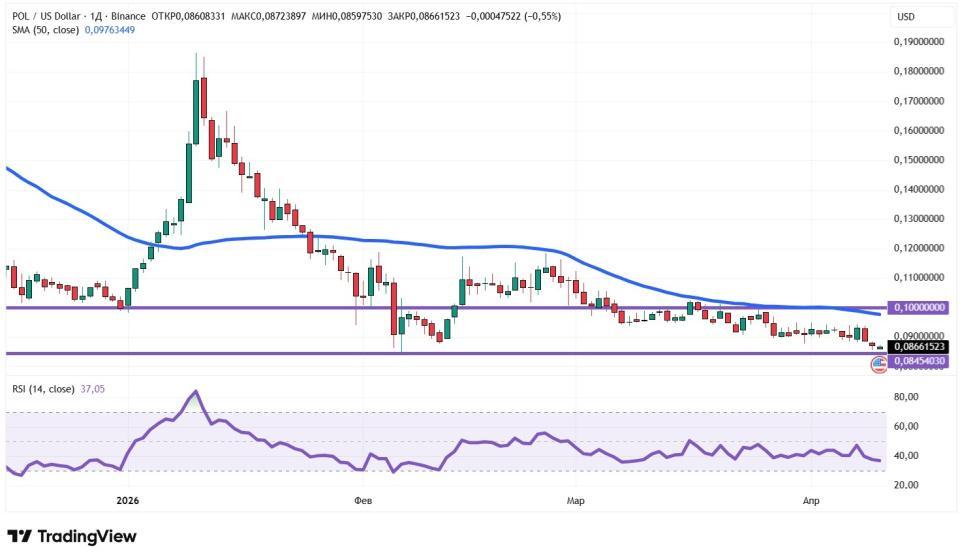
From a technical analysis perspective, Polygon’s trend is downward. This is confirmed by the fact that the price is below the 50-day moving average (marked in blue). The RSI indicator value is below 50 but above the oversold zone, which is also a bearish omen. The nearest support and resistance levels on the daily chart: $0.0845 and $0.1.
Source: tradingview.com
Conclusion
The Iran-U.S. ceasefire gave hope to crypto investors and contributed to the growth of Bitcoin and Ether. Nevertheless, there is still a lot of uncertainty. Moreover, the ceasefire is not fully observed. Polygon continues to decline. Even the Giugliano hard fork, which reduced transaction finalization to two seconds, did not help.
This material and the information contained herein do not constitute individual or other investment advice. The editorial opinion may not coincide with the opinions of analytical portals and experts.
