Disclaimer: Information found on CryptoreNews is those of writers quoted. It does not represent the opinions of CryptoreNews on whether to sell, buy or hold any investments. You are advised to conduct your own research before making any investment decisions. Use provided information at your own risk.
CryptoreNews covers fintech, blockchain and Bitcoin bringing you the latest crypto news and analyses on the future of money.

Numbers in Focus: Lunar Phases and Other Unconventional Indicators in Crypto Trading, 2026/03/02 10:00:07

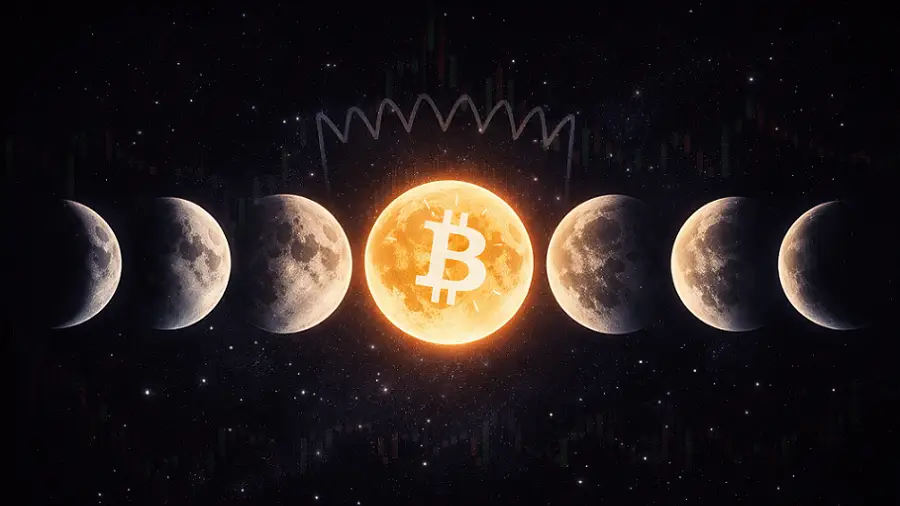
Opinion Participants in the cryptocurrency market use a wide variety of indicators, ranging from the Fear and Greed Index to MACD and RSI. In addition to traditional technical analysis tools, unconventional indicators are also employed, whose effectiveness may be questioned, such as Mercury retrograde and lunar phases.
Related Posts
Lunar Phases
The “Moon Phase Trading Indicator” is an unconventional technical analysis tool that some traders use to develop trading strategies. Its proponents suggest that lunar cycles can influence market participant behavior through psychological or physiological mechanisms.
Interest in this topic arose long before the cryptocurrency market existed. In 2001, researchers from the University of Michigan published a paper titled “Lunar cycle effects in stock returns.” The authors concluded that during new moon periods, the average stock return was statistically higher than during full moon periods. This effect was observed on stock indices in various countries, including the United States.
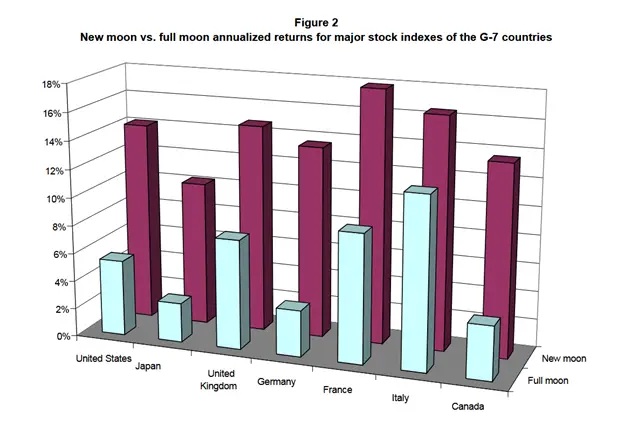
Source: scispace.com
However, the study did not provide a definitive explanation for the cause of the identified correlation. Among the hypotheses mentioned were the possible influence of lunar cycles on sleep and hormonal processes, as well as the coincidence of phases with other economic events—such as corporate earnings reports, payment cycles, and changes in liquidity. In this case, lunar phases may serve merely as a statistical proxy indicator rather than an independent factor.
Later, the concept was adapted for the cryptocurrency market, despite the fact that the original work concerned only stocks and was published before the appearance of Bitcoin. Currently, there are variations of the indicator applied to both digital assets and stocks of companies related to the crypto industry.
In its basic interpretation, it is believed that a buy signal forms near new moons, and a sell signal forms near full moons. Proponents of the method emphasize the importance of considering the overall trend.
-
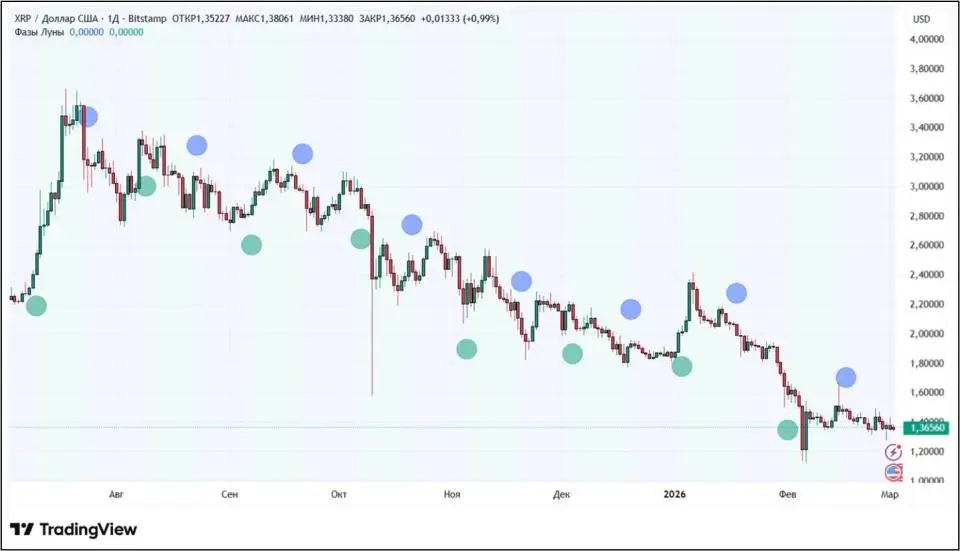
In a downtrend, if the current lunar phase is recorded at a price lower than during the previous similar phase, this is interpreted as confirmation of the sell signal.
-
In an uptrend, the subsequent phase should occur at a price higher than the previous one, which is interpreted as confirmation of the continuation of the growth.
For example, in the daily chart of XRP shown below, periods of the waxing moon (after the new moon) and the waning moon (after the full moon) are compared with price dynamics. Within a downtrend, successive phases fall at lower price levels, which formally corresponds to the logic of the sell signal.
Source: tradingview.com
Mercury Retrograde
Continuing the theme of astrological interpretations in trading, market participants often mention Mercury retrograde—an astronomical phenomenon that in popular culture is associated with an increase in errors and communication failures. In the context of trading, some traders view this period as potentially unfavorable for decision-making.
For most market participants, this approach remains more of an ironic element of discussions. Nevertheless, there are proponents who try to account for retrograde periods in their strategies and even integrate corresponding markers into graphical indicators.
A common explanation is that during Mercury retrograde, market participants make more mistakes, and price dynamics become less predictable. It is assumed that this may be accompanied by increased volatility and decreased average returns. In terms of technical analysis, this situation is interpreted as an increase in the number of false breakouts and short-term trend reversals.
There is no scientific evidence of a direct link between the astronomical phenomenon and market dynamics. However, some researchers point to the possible influence of psychological factors. This refers to the “self-fulfilling prophecy” phenomenon: if a significant number of participants expect increased market “chaos” and adjust their behavior accordingly, this in itself can amplify short-term fluctuations.
Thus, Mercury retrograde in trading is more often viewed not as a fundamental factor, but as an illustration of how expectations and collective psychology can influence market behavior.
Cramer’s Inverse Indicator
One of the most famous informal “indicators” is the so-called Inverse Cramer. It is named after CNBC host Jim Cramer, author of the show Mad Money.
For many years, some market participants noticed that Cramer’s individual public forecasts did not come true. Over time, this turned into a meme: investors began to use his statements as a signal for the opposite action—buy if he recommends selling, and vice versa.
In 2023, the idea received institutional form: Tuttle Capital Management launched an exchange-traded fund (ETF) focused on the Inverse Cramer strategy. However, less than a year later, the fund was closed.
The very fact of the appearance of such a product illustrates how strongly media personalities can influence investor behavior—even if this influence is ironic.
In the summer of 2025, Cramer stated that he was buying Bitcoin and Ethereum, explaining this by concern for the future of his children and a desire to obtain “insurance against the US national debt.”
The Taxi Driver Indicator
Among informal market observations, the so-called “taxi driver indicator” is widely known. Its logic is as follows: if people far from investing—such as taxi drivers, acquaintances, or neighbors—begin to actively talk about cryptocurrencies, the market may be in a state of overheating.
The premise is behavioral. Mass interest in an asset often intensifies closer to the peak of growth, when participants driven by the fear of missing out (FOMO) enter the market. At this stage, demand is formed by late investors, which may coincide with the final phase of the speculative cycle.
The “taxi driver indicator” is not a formalized analysis tool and does not have a quantitative methodology. It reflects observation of collective sentiments and the level of engagement of the general audience.
In the history of financial markets, cases of sharp growth in interest from non-professional participants often coincided with the final stages of bubbles. However, such coincidences do not imply a stable causal relationship and cannot be considered an independent trading signal.
“Bart Simpson’s Head” and “Dinosaur”
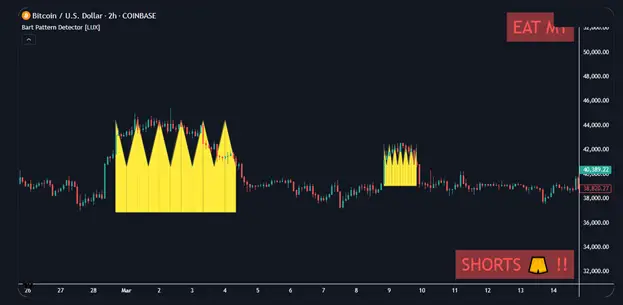
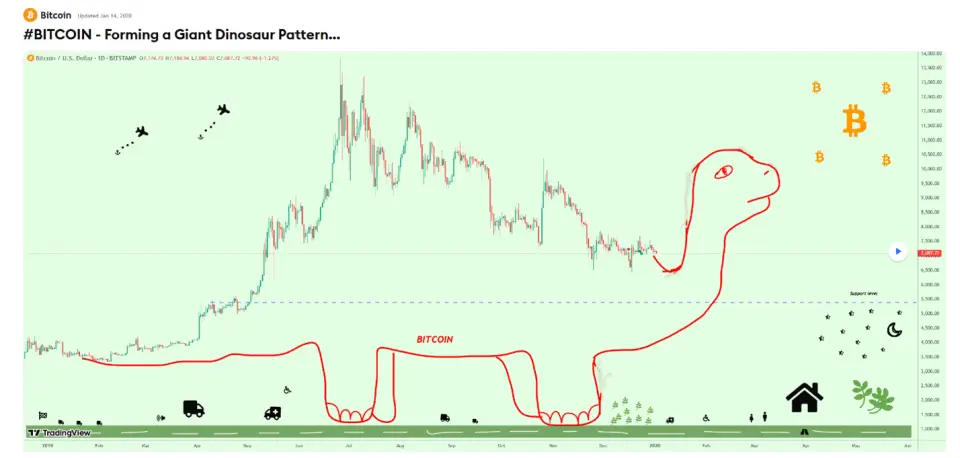
In the informal trader community, there are also humorous graphical “patterns.” By analogy with classic candlestick analysis models—such as “hammer,” “bullish engulfing,” and “bearish engulfing”—users have started to highlight visually recognizable shapes with ironic names, such as “Bart Simpson’s head” or “dinosaur.”
Unlike traditional technical analysis models, these shapes do not have a formalized methodology and are not part of the widely accepted set of tools. They look as follows:
Source: tradingview.com
Source: tradingview.com
The “dinosaur” pattern is usually described as a sharp rise followed by a prolonged decline, forming a “hump” on the chart. “Bart Simpson’s head” looks like a sequence of a nearly vertical upward impulse, a prolonged sideways movement, and an equally sharp decline. There is also a mirror version—the “inverted head”—reflecting the opposite dynamics.
Despite visual similarities with some real models—such as the “cup” or various triangles—these shapes do not belong to classical technical analysis and are used primarily as descriptive memes.
At the same time, it is important not to confuse such humorous names with tools that are actually used in trading, even if they have figurative designations. An example is the “Alligator indicator,” where the metaphor is used to simplify the description of the interaction of moving averages within a formalized methodology.
Alligator Indicator
The “Alligator” indicator was developed by trader and analyst Bill Williams, author of a number of tools with figurative names, including the “Awesome Oscillator.” His methodologies have gained popularity on various markets, including the cryptocurrency market.
The Alligator is based on smoothed moving averages (Smoothed Moving Average, SMMA) shifted forward relative to the current price. They form three lines with figurative names:
-
A 13-period line shifted by 8 bars—the “jaw”;
-
An 8-period line shifted by 5 bars—the “teeth”;
-
A 5-period line shifted by 3 bars—the “lips”.
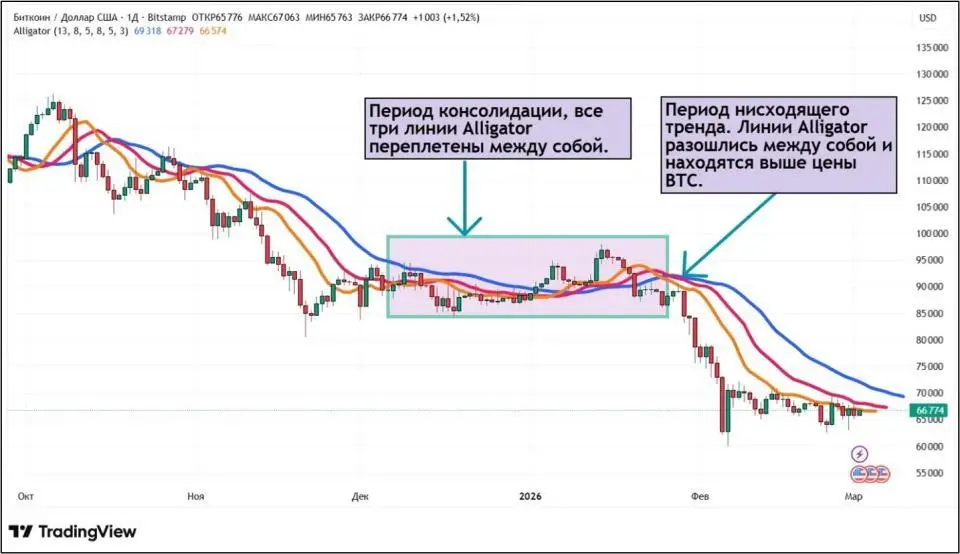
The metaphor reflects the logic of interpretation. When the three lines are intertwined, it is considered that the “alligator is sleeping”—the market is in a consolidation phase. The divergence of lines is interpreted as the beginning of a trend: the “mouth opens,” symbolizing the appearance of directional movement.
The direction of the trend is determined by the mutual arrangement of the lines and the price. In the classic interpretation, if the price is located above all three lines, an uptrend is considered, and if below—a downtrend.
As an example, consider the daily chart of Bitcoin on the Bitstamp exchange. From the beginning of December 2025 to the end of January 2026, the indicator lines were in a tight intertwining, which corresponded to the consolidation phase. At the end of January, they diverged, after which a directional downward movement formed.
Source: tradingview.com
Despite its visual clarity and popularity, Alligator is a trend-following indicator and can generate a significant number of false signals in sideways markets. Using the tool in isolation without confirmation from other technical or fundamental analysis methods increases the risk of erroneous decisions.
Conclusion
In crypto trading, there are both traditional technical analysis tools and unconventional indicators. Some of them, such as lunar cycles, are indeed used by traders, while others exist more as jokes or memes. In most cases, these methods do not have sufficient empirical basis and are not recognized by the academic community. Their application requires caution and an understanding of limitations. If such indicators are considered within the framework of practical trading, it is advisable to use them only as an auxiliary element—in combination with more formalized tools of technical and fundamental analysis.
This material and the information contained therein do not constitute individual or other investment advice. The opinion of the editorial board may not coincide with the opinions of analytical portals and experts.
