Disclaimer: Information found on CryptoreNews is those of writers quoted. It does not represent the opinions of CryptoreNews on whether to sell, buy or hold any investments. You are advised to conduct your own research before making any investment decisions. Use provided information at your own risk.
CryptoreNews covers fintech, blockchain and Bitcoin bringing you the latest crypto news and analyses on the future of money.

Fractals in Cryptocurrency Trading: Understanding the Indicator’s Functionality, 2026/03/24 10:00:05


Opinion According to the fundamental principles of technical analysis, price movements tend to repeat themselves—not necessarily in magnitude, but in shape. Based on this concept, analyst Bill Williams developed the Fractals indicator, which is also utilized in the cryptocurrency market.
What are Fractals
Fractals are structures in which individual components replicate the shape of the whole. Examples can be found in nature: tree canopies, snowflakes, and mountain ranges. Williams hypothesized that similar patterns also manifest in market data. The term was first introduced into technical analysis in the book “Trading Chaos: Increasing Profits with Technical Analysis,” published in 1995. In trading, a fractal is a graphical model indicating a local maximum or minimum price.
When a Fractal Appears on the Chart
Related Posts
A fractal is formed based on five consecutive candles. The main condition is an extremum on the central, third candle:
-
for an upward fractal—the highest value among the five candles;
-
for a downward fractal—the lowest value.
The signal is confirmed only after the closure of the fifth candle. On the chart, fractals are marked with arrows: up for local maxima, down for minima.
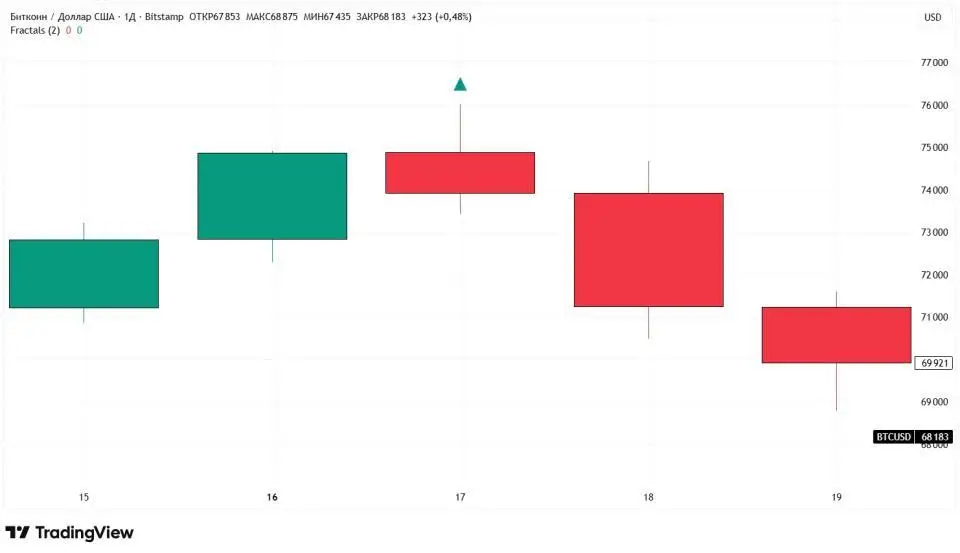
For example, on the Bitcoin daily chart (Bitstamp) from March 15 to 19, 2026, the third candle showed the highest maximum ($76,013), leading to the formation of an upward fractal.
Source: tradingview.com
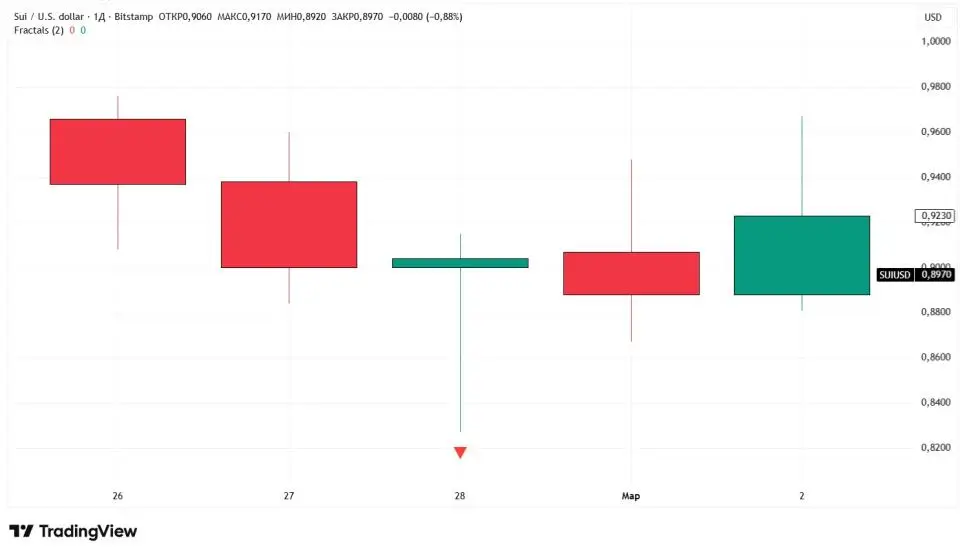
The reverse situation was observed on the Sui chart on February 28: the minimum price ($0.827) was lower than the values of adjacent candles, leading to the formation of a downward fractal.
Source: tradingview.com
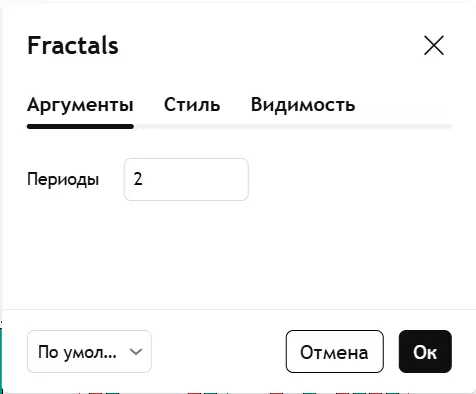
Indicator parameters can be adjusted. In TradingView, the “Periods” parameter is set to two by default, meaning two candles on each side of the central one. Increasing this value reduces the number of signals.
Source: tradingview.com
How to Use Fractals in Trading
Fractals are used to identify levels:
-
upward fractals—potential resistance levels;
-
downward fractals—support levels.
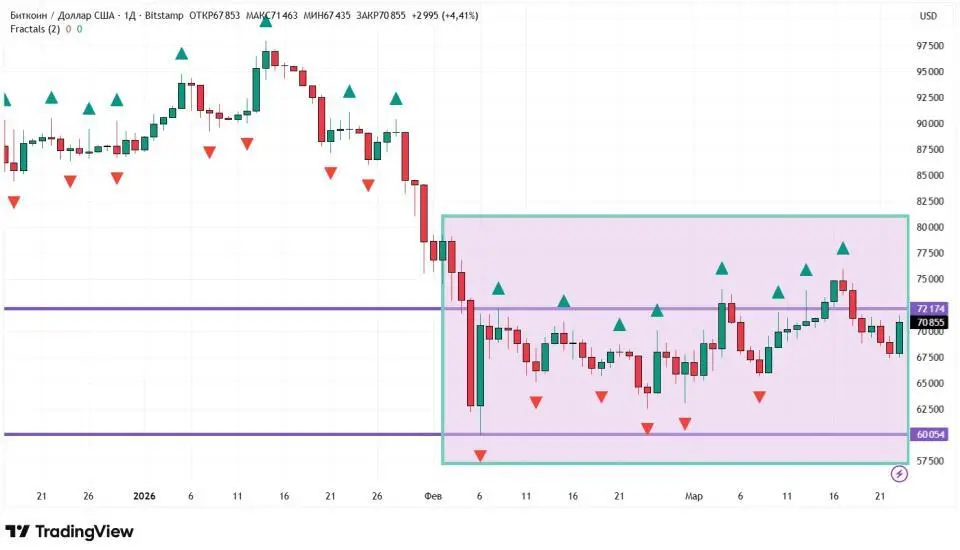
One of the main approaches is placing orders above resistance levels or below support levels. However, in practice, this method is rarely used. The reason is the high number of false signals. Fractals form frequently, leading to an excessive number of trades and increased risk. On the Bitcoin chart in February–March 2026, such signals appeared regularly but did not yield stable results when used independently.
Source: tradingview.com
Combination with Other Indicators
Bill Williams recommended using fractals in conjunction with the Alligator indicator, which helps identify the trend:
-
when a clear trend is present, fractal signals can be useful;
-
during sideways movement (when Alligator lines cross each other and the price), signals should be ignored.
For example, in February–March 2026, the combination of indicators allowed traders to avoid trades due to the lack of a trend.
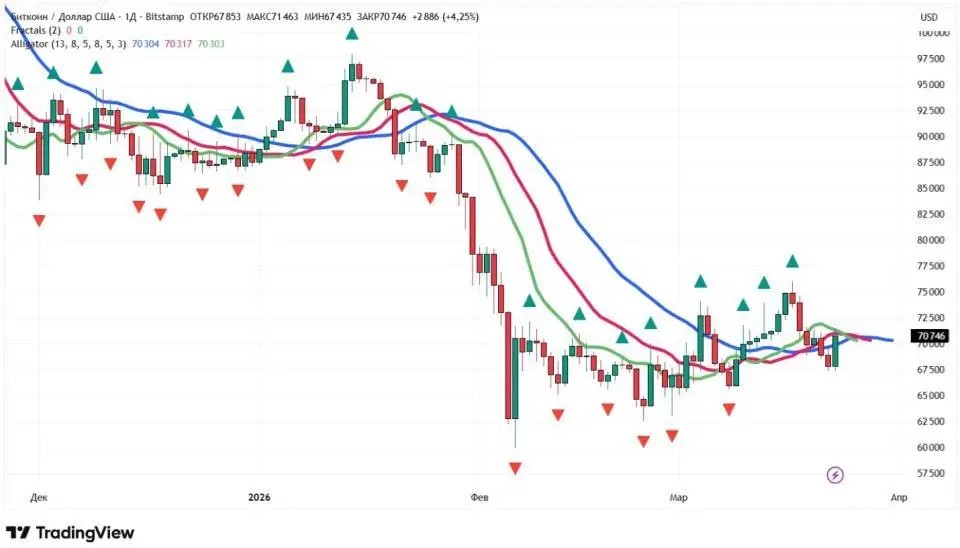
Source: tradingview.com
Conversely, at the end of January 2026, a downtrend formed: the price was below the Alligator lines, which were diverging. A breakout of the fractal level provided a signal to open short positions. Over the following eight days, the move amounted to up to 29%.
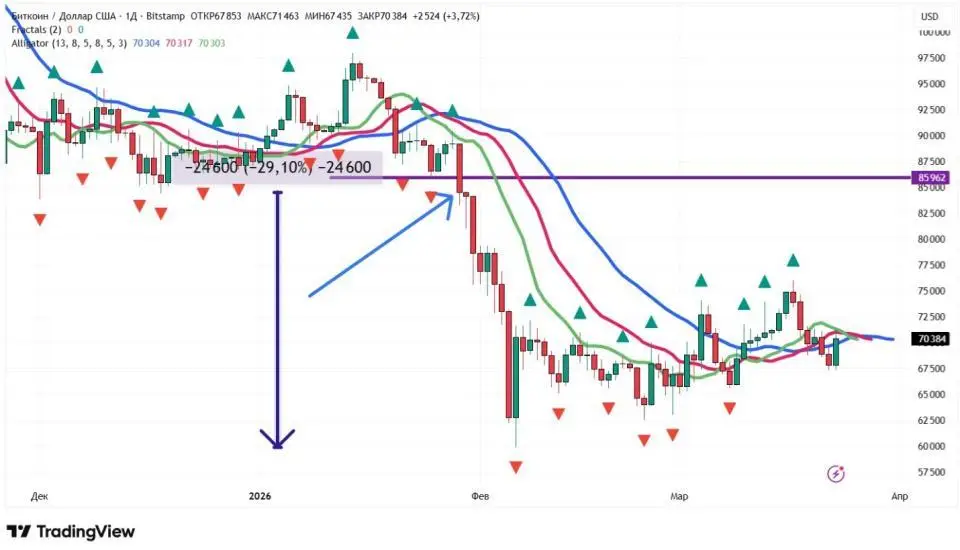
Source: tradingview.com
A similar approach worked on the upward trend of Solana in March 2024: after breaking the fractal level, the price rose by up to 45% over 11 days.
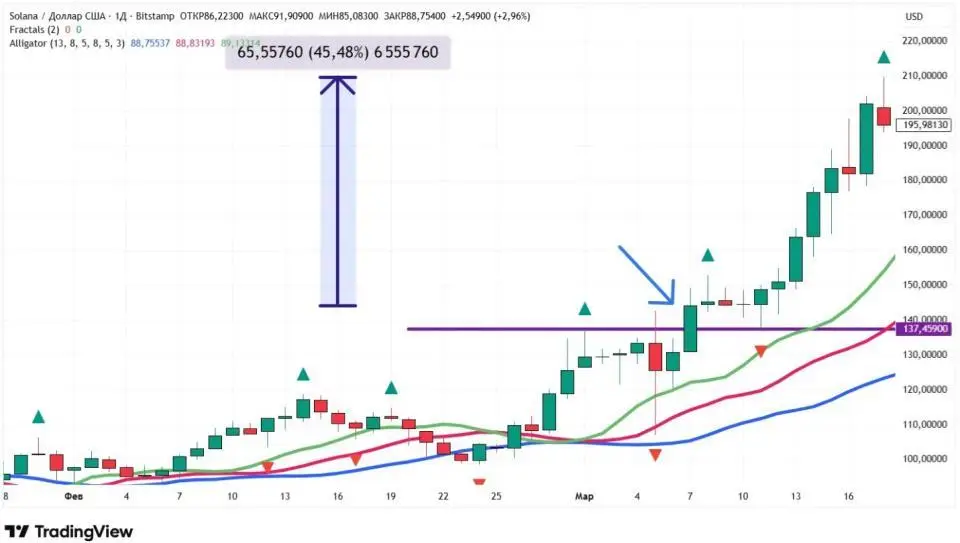
Source: tradingview.com
Fractals are also used in combination with other tools:
-
RSI;
-
moving averages;
-
Bollinger Bands.
Disadvantages of Fractals
The main disadvantage is the high number of false signals. Without additional filters, the indicator demonstrates low efficiency.
Additionally, fractals:
-
perform poorly in sideways markets;
-
form with a delay, as they require the completion of five candles;
-
are difficult to interpret without additional tools.
Conclusion
Fractals are a technical analysis tool for identifying local support and resistance levels. Their use in isolation is limited due to the high proportion of false signals. In practice, the indicator is applied in combination with other analysis methods, allowing traders to filter signals and determine the trend direction.
This material and the information contained herein do not constitute individual or other investment advice. The editorial opinion may not coincide with the views of analytical portals and experts.
