Disclaimer: Information found on CryptoreNews is those of writers quoted. It does not represent the opinions of CryptoreNews on whether to sell, buy or hold any investments. You are advised to conduct your own research before making any investment decisions. Use provided information at your own risk.
CryptoreNews covers fintech, blockchain and Bitcoin bringing you the latest crypto news and analyses on the future of money.

Center of Gravity Indicator in Crypto Trading: Calculation, Signals, and Limitations, 2026/02/12 12:55:57

Opinion Technical analysis indicators often lag behind price changes. For volatile assets such as cryptocurrencies, this can reduce the effectiveness of signals. The Center of Gravity (CG) is presented as an oscillator that can reduce this time lag. Let us examine the principles of its operation and features of use.
The Influence of Physics on Technical Analysis
The Center of Gravity (CG) indicator, translated as “center of gravity,” was developed by electrical engineer and technical analyst John Ehlers in his book Cybernetic Analysis for Stocks and Futures: Cutting-Edge DSP Technology to Improve Your Trading.
The indicator’s concept is based on an analogy with the physical concept of center of gravity. Ehlers described an experiment with a 12-inch ruler: without additional weight, its center of gravity was in the middle, but adding a paperclip shifted it toward the heavier side. By analogy, the author suggested that one could calculate the “center of gravity” of price movement, which would shift as the market structure transformed.
The indicator’s name reflects this idea—tracking the shift in price balance within a selected period.
Indicator Calculation
The CG calculation resembles a weighted average formula but has a fundamental difference: the denominator uses the sum of prices, not the sum of weights. The formula is as follows:
CG = ∑(Priceᵢ × (Weightᵢ + 1)) / ∑ Priceᵢ
where:
Priceᵢ — price values of the asset for the corresponding periods;
Weightᵢ — weights assigned to these values.
Related Posts
Adding one to the weight (Weightᵢ + 1) is necessary to prevent the first term from becoming zero, since classical counting starts from zero. To smooth the oscillator, Ehlers also inverted the indicator’s sign, which allowed synchronizing its behavior with price dynamics and minimizing time lag.
The choice of weights remains a flexible parameter. Ehlers experimented with various options, including values from the RSI and Stochastic oscillators. In his opinion, the best results were provided by the squares of the difference between two adjacent prices. Weights should be selected individually so that the indicator remains adaptive to changing market conditions.
Another important parameter is the length of the calculation period. It determines over what time interval the calculation is performed. Ehlers recommended basing this on half of the dominant market cycle. A period that is too long makes the indicator inert, while a period that is too short increases the number of false signals.
In most trading platforms, the standard length value is 10 periods. Input data can be various types of prices: median (average of the high and low for the period), open, close, high, or low price. Ehlers most often used the median price.
The CG signal line is usually calculated as a simple moving average of the indicator itself. The trader determines its parameters independently. As an alternative, Ehlers proposed using the CG value shifted by one bar as a lagging signal line.
Trading Signals
Ehlers initially identified one main signal—the crossing of the Center of Gravity line with the signal line. A cross from below was interpreted as a bullish signal, and a cross from above as a bearish one.
Over time, traders have expanded the list of indicator interpretations. The following signals are also used additionally:
-
reaching extreme values, indicating potential overbought and oversold zones;
-
divergence—a discrepancy between price dynamics and CG. If price forms new highs but the indicator does not, this is considered a bearish signal. If price makes new lows but CG shows weakening downward momentum, a bullish divergence forms.
Graphical Representation of COG
Center of Gravity is displayed as an oscillator—a broken line oscillating around the zero level. Depending on the platform, the visual design may vary.
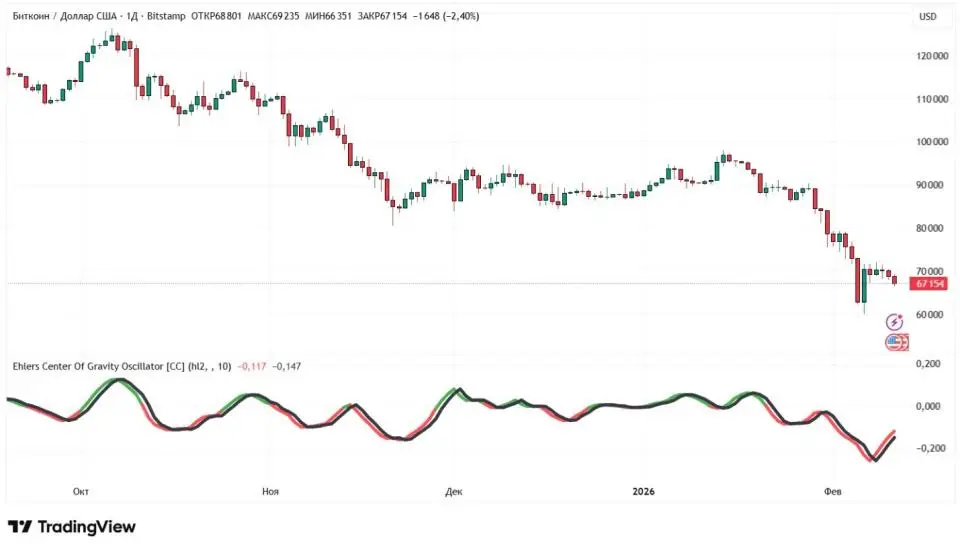
For example, on the TradingView service, the indicator is represented as a line that changes color depending on its position relative to the zero mark: above zero it is displayed in one color, below in another. The signal line is plotted separately and used to determine intersection points.
Source: tradingview.com
On the provided chart, Center of Gravity is applied to the daily timeframe of Bitcoin from the Bitstamp exchange. As of early February 2026, the indicator reached its lowest values in a long period, corresponding to an oversold zone. Additionally, the CG crossed the signal line from below, which is interpreted as a bullish signal within this methodology.
In TradingView, the standard calculation period length is 10. On a daily timeframe, this means analyzing the last ten trading days. The parameter can be changed according to the user’s trading strategy.
Pros and Cons of CG
The key advantage of CG is considered to be minimal time lag compared to traditional moving averages. The indicator reacts to price changes quickly enough and can be used to identify momentum shifts early. Furthermore, it is visually clear and allows flexible parameter tuning for various trading strategies.
At the same time, the wide range of tuning options requires careful parameter selection. For different instruments, including highly volatile cryptocurrencies, weight and calculation period length values can vary significantly. Incorrect calibration can lead to an increase in the number of false signals.
Although the indicator’s calculation is automated in trading platforms, correct tuning requires an understanding of its mathematical basis. Without this, parameter adaptation may be merely formal.
Another limitation is related to CG’s behavior during sideways market movement. In the absence of a clear trend, the indicator may demonstrate reduced efficiency. In practical trading, its signals are advisable to confirm with other technical and fundamental analysis tools.
Conclusion
Center of Gravity is an oscillator with minimal time lag, designed to track the shift in price momentum. Its effectiveness depends on the correct selection of weight and calculation period length parameters. In trading practice, CG is advisable to use in conjunction with other analysis tools to increase signal reliability.
This material and the information contained herein do not constitute individual or other investment advice. The editorial opinion may not coincide with the opinions of analytical portals and experts.
