Disclaimer: Information found on CryptoreNews is those of writers quoted. It does not represent the opinions of CryptoreNews on whether to sell, buy or hold any investments. You are advised to conduct your own research before making any investment decisions. Use provided information at your own risk.
CryptoreNews covers fintech, blockchain and Bitcoin bringing you the latest crypto news and analyses on the future of money.


Military actions by the United States, Israel, and their allies in the Middle East did not cause significant negative sentiment among crypto investors. On the contrary, the market even showed growth. For investors, the worst scenario is not bad news, but uncertainty. What can be expected next?
Related Posts
Bitcoin
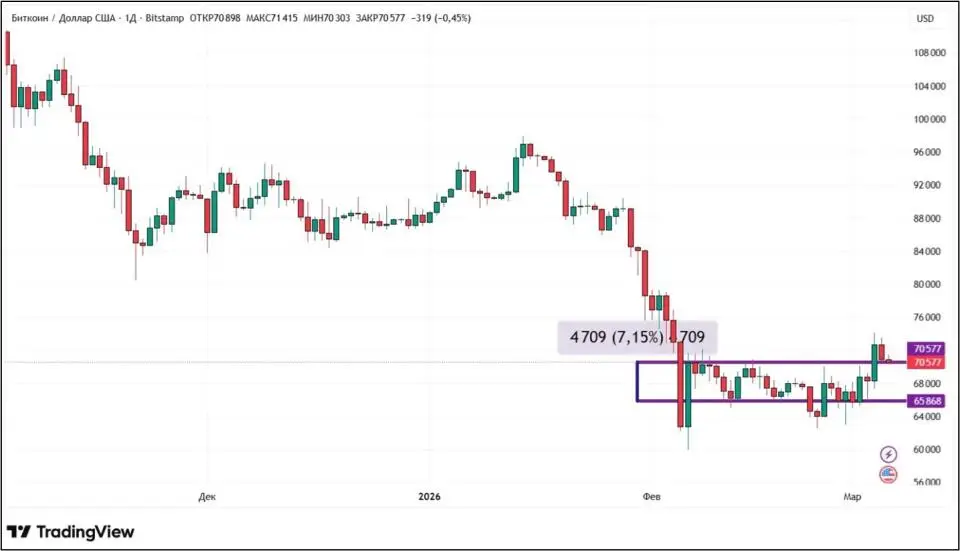
From February 27 to March 6, 2026, Bitcoin increased by 7.15%. The largest cryptocurrency by market capitalization once again surpassed the important psychological level of $70,000. Despite the positive dynamics, the number of trading sessions with growth was fewer than those with declines: three versus four.
Source: tradingview.com
The escalation of the situation in the Middle East was one of the key events of the week influencing Bitcoin. Initially, there was a drop to $63,000, but it was quickly compensated. Nevertheless, speaking of a bullish trend is premature. According to Julio Moreno, head of the research department at the analytical platform CryptoQuant:
“Bitcoin is still in a bear market despite the recent growth. Fundamental and technical indicators still point to the dominance of a downward trend. In this context, it is best to interpret the last growth as a ‘relief rally’ (bounce) within a bear market.”
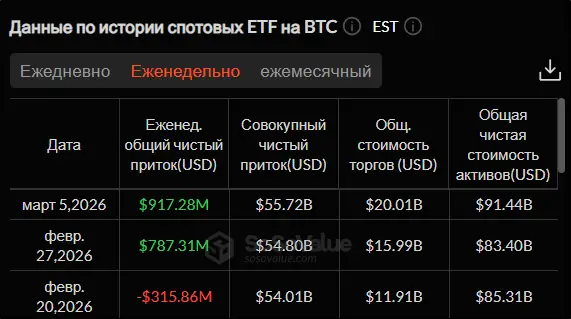
Spot Bitcoin ETFs have shown positive dynamics for the second consecutive period. The inflow of funds into exchange-traded funds over four trading days amounted to $917.28 million. The majority of this sum, $803.41 million, fell on the BlackRock iShares Bitcoin Trust (IBIT) product.
Source: sosovalue.com
There are also positive changes for Bitcoin on the regulatory front. Indiana Governor Mike Braun signed Executive Order 1042 (Bill 1042) on March 3, which allows investing part of pension savings in cryptocurrency and/or related ETFs. The governor retained the right to determine the size of distributed funds that can be invested in digital assets or financial products based on them. If the order is implemented, state residents will be able to invest pension savings in cryptocurrency by July 1, 2027.
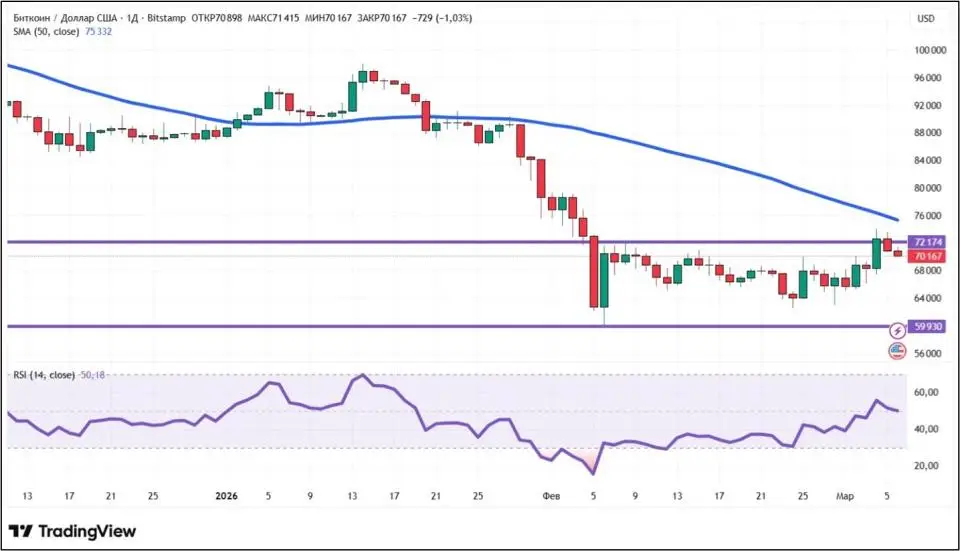
From a technical analysis perspective, Bitcoin’s trend remains downward. The price is below the 50-day moving average (marked in blue). A positive signal for buyers (bulls) was the RSI rising above 50. Nevertheless, this is only a weak consolation. Bitcoin has still not managed to hold above the resistance level of $72,174. The closing of trades above this mark on Wednesday, March 4, turned out to be a false breakout. The support level is located slightly below $60,000.
Source: tradingview.com
The Fear and Greed Index increased by five points compared to last week. Its current value is 18. This indicates the dominance of extreme fear among crypto investors.
Ethereum
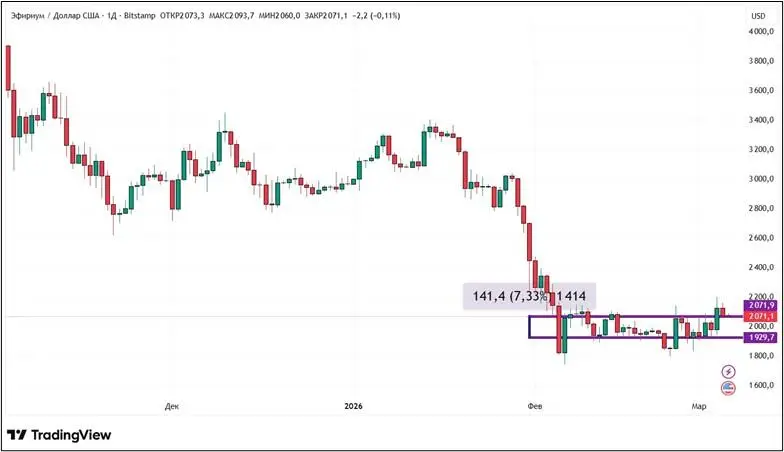
Ether, like Bitcoin, increased by more than 7% from February 27 to March 6. This allowed ETH to secure above $2,000. An interesting feature of the past seven days: trading sessions of growth and decline alternated. There were four of the former and three of the latter.
Source: tradingview.com
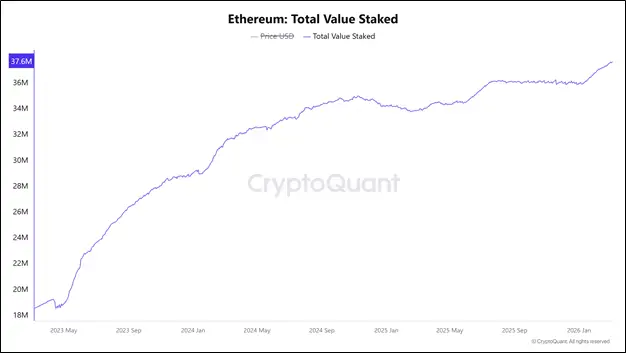
One of the factors for Ether’s growth could be the February statistics on ETH withdrawals from crypto exchanges. According to the analytical platform CryptoQuant, $31.6 million worth of ETH was withdrawn from centralized exchanges (CEX). This is the highest figure since November. The top three leaders in ETH outflow include: Binance — 14.45 million, OKX — 3.83 million, and Kraken — 1.04 million. Often, a high outflow of cryptocurrency from centralized exchanges indicates long-term faith in growth or the transfer of funds to other assets. In the case of Ether, it is also worth noting the popularity of staking, which has been attracting investors lately. At the beginning of March, 37.6 million ETH were in staking.
Source: cryptoquant.com
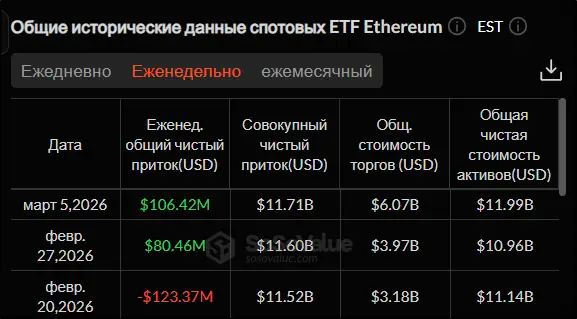
Spot Ethereum ETFs showed the best weekly dynamics since mid-January. The inflow of funds over four full trading sessions amounted to $106.42 million. The iShares Ethereum Trust (ETHA) from BlackRock was the most popular among investors, receiving an additional $138.02 million.
Source: sosovalue.com
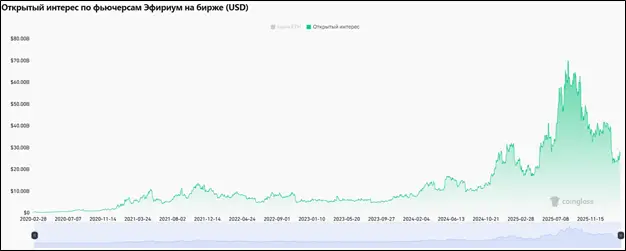
Among the positive factors, one should note a slight increase in activity in the ETH derivatives market. Open interest in futures increased by $0.89 billion to $26.83 billion. If counting from the February minimums, the increase is $3.94 billion, which is equivalent to 17.2%.
Source: www.coinglass.com
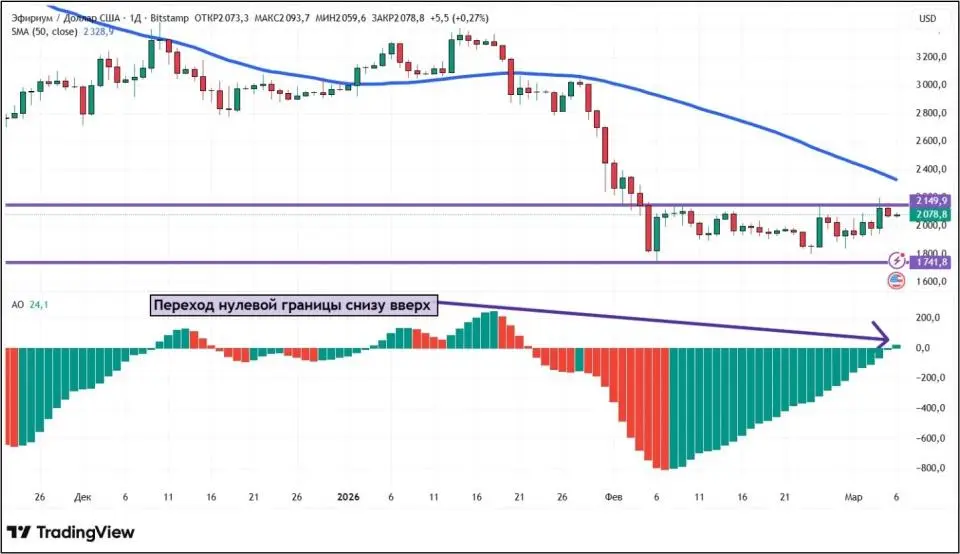
From a technical analysis perspective, Ethereum’s trend remains downward. This is confirmed by the fact that the price is located below the 50-day moving average (marked in blue). The miraculous oscillator sent a bullish signal when it crossed the zero level from bottom to top (marked with a purple arrow). Support and resistance levels on the daily chart have remained unchanged compared to last week: $1,741.8 and $2,149.9, respectively.
Source: tradingview.com
Solana
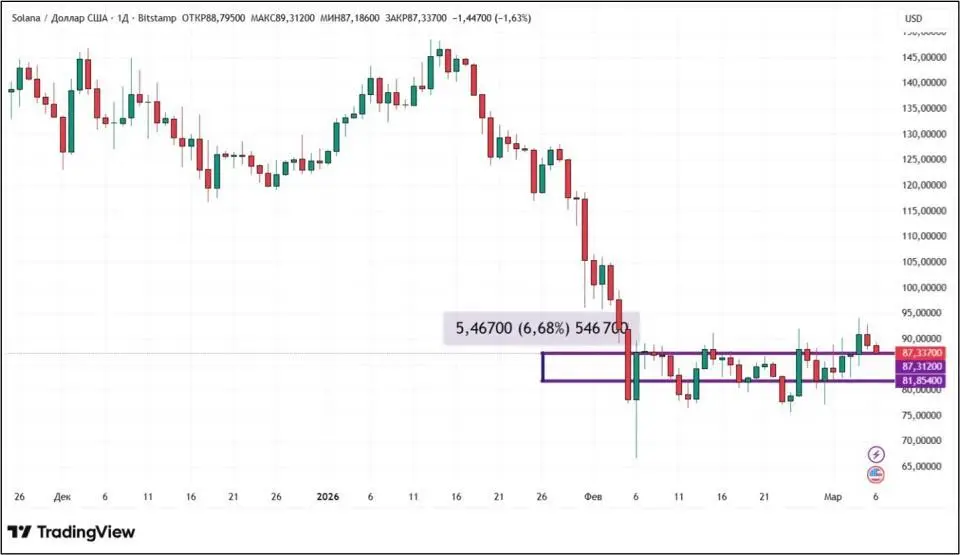
The cost of Solana increased by 6.68% from February 27 to March 6. For the second week in a row, SOL has demonstrated positive dynamics. On March 4 and 5, this cryptocurrency was able to approach $95 for the first time in a month and a half. However, it failed to hold at this level.
Source: tradingview.com
In February, Solana showed significant growth in the number of transactions on the network. According to DeFi Dev Corp (formerly Janover), 3.4 billion transfers were made on the cryptocurrency’s blockchain. This is 11% more than in January. By this indicator, Solana surpassed its closest competitor, BNB Chain, by eight times.
Moreover, the second month of the year turned out to be breakthrough for the cryptocurrency in the stablecoin market. According to investment company Grayscale, the volume of stable token transfers on the Solana blockchain in February reached $650 billion, more than doubling the previous record set in October. It is obvious that demand for this cryptocurrency’s infrastructure has reached record levels.
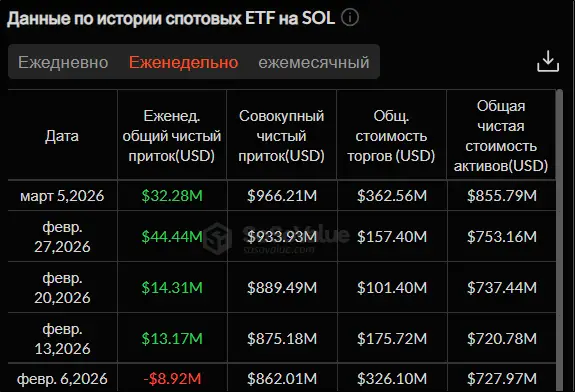
Spot Solana ETFs have been recording fund inflows for four consecutive weeks. This time, it amounted to $32.28 million. The Bitwise Solana Staking ETF (BSOL) from Bitwise was the most popular among investors, receiving an additional $35.08 million.
Source: sosovalue.com
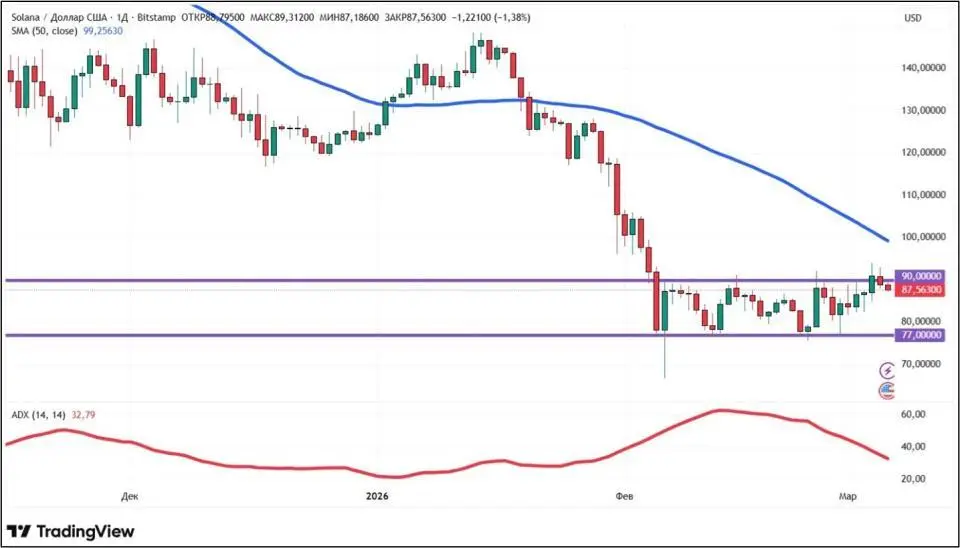
From a technical analysis perspective, Solana’s trend remains downward. This is confirmed by the fact that the SOL price is below the 50-day moving average (marked in blue). Nevertheless, pressure from sellers is gradually weakening, as evidenced by the decrease in the ADX indicator, which characterizes trend strength. The nearest support and resistance levels on the daily chart are located around the marks of $77 and $90, respectively.
Source: tradingview.com
Conclusion
The beginning of spring turned out to be favorable for leading cryptocurrencies. Bitcoin, Ethereum, and Solana showed weekly growth of 6–7%. The shock caused by the escalation of the situation in the Middle East turned out to be short-term and did not have a decisive influence on the dynamics of digital assets. However, the overall long-term trend remains downward.
This material and the information contained therein do not constitute individual or other investment advice. The editorial opinion may not coincide with the opinions of analytical portals and experts.
