Disclaimer: Information found on CryptoreNews is those of writers quoted. It does not represent the opinions of CryptoreNews on whether to sell, buy or hold any investments. You are advised to conduct your own research before making any investment decisions. Use provided information at your own risk.
CryptoreNews covers fintech, blockchain and Bitcoin bringing you the latest crypto news and analyses on the future of money.
Bitcoin (BTC) has successfully maintained its position above the $26,000 mark, despite the S&P 500 dropping to a three-month low and the US dollar index (DXY) reaching a new year-to-date peak. This is a somewhat encouraging indication as it reflects a lack of intense selling at lower price points.
Bitcoin continues to be confined within a range, and the lack of directional price movement has left traders hesitant. According to recent analysis from on-chain analytics platform CryptoQuant, Bitcoin’s daily spot exchange transactions peaked at over 600,000 in March but fell to between 8,000 and 15,000 last week. The low liquidity could result in significant price fluctuations in either direction, prompting traders to exercise caution and await confirmations instead of acting on every intraday breakout.
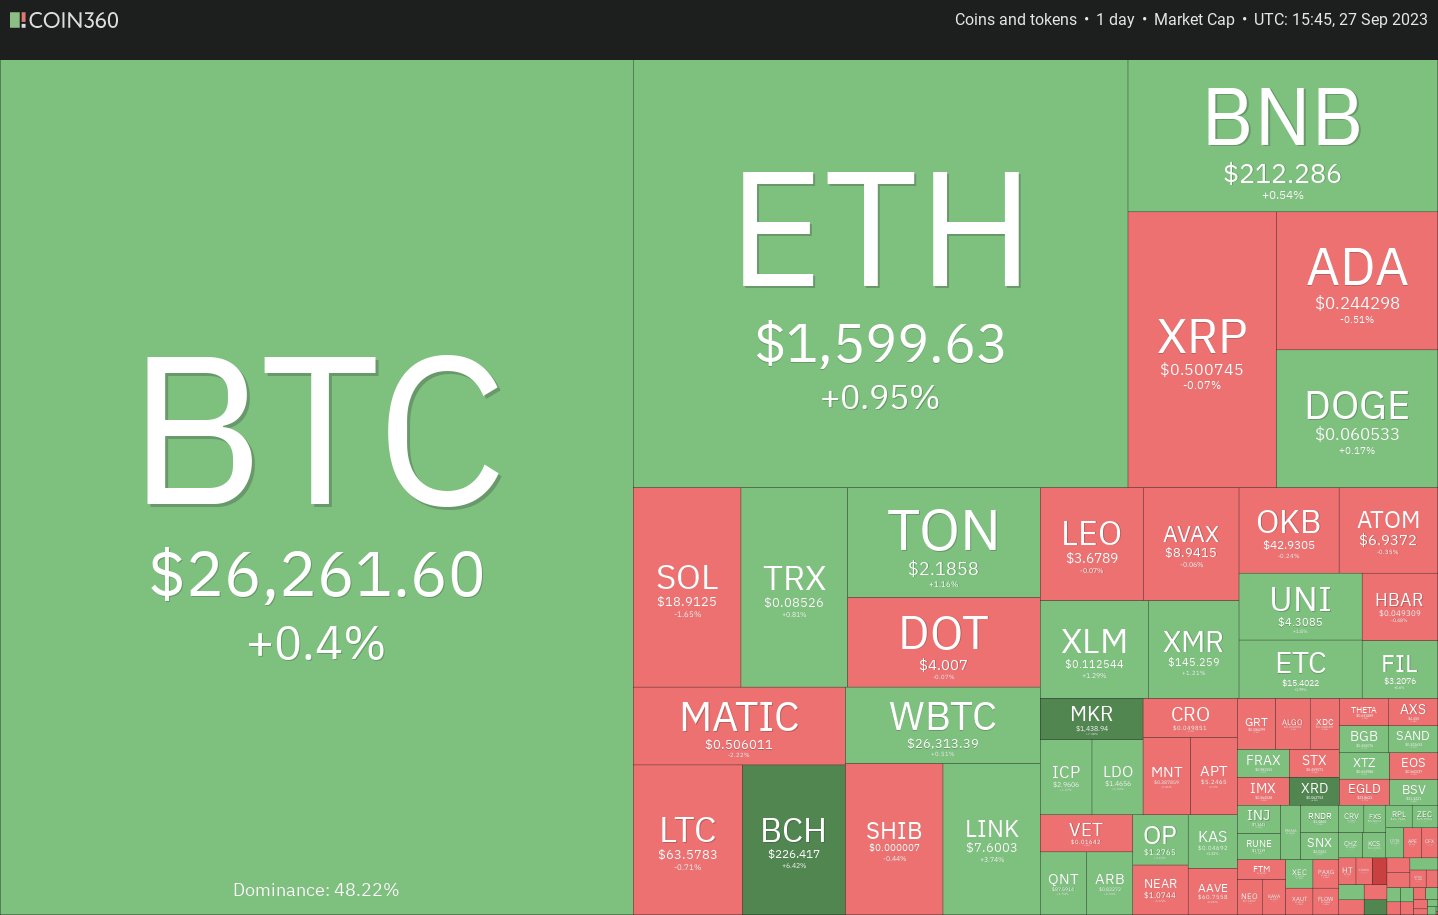 Daily cryptocurrency market performance. Source: Coin360
The short-term price movement remains ambiguous, yet this has not dissuaded long-term investors from increasing their Bitcoin holdings. MicroStrategy co-founder and executive chairman Michael Saylor announced on X (formerly Twitter) that the company has purchased 5,445 Bitcoin at an average price of $27,053 each.
Is it possible for Bitcoin and certain altcoins to initiate a short-term upward movement? Let’s analyze the charts of the top 10 cryptocurrencies to explore this.
Bitcoin price analysis
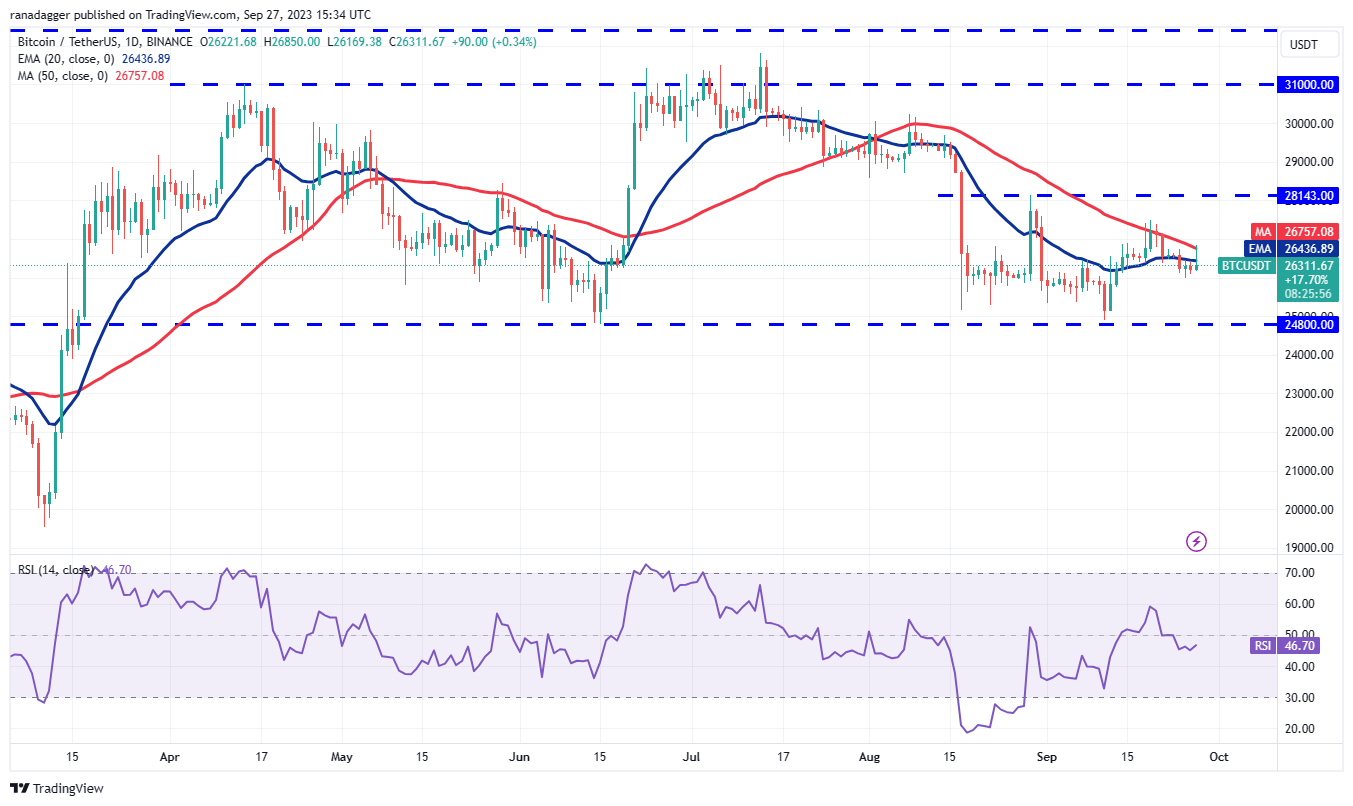
Bitcoin is experiencing a challenging contest between the bulls and the bears near the 20-day exponential moving average ($26,436). The bulls managed to push the price above the 20-day EMA on Sep. 27, but they were unable to surpass the 50-day simple moving average ($26,757).
 BTC/USDT daily chart. Source: TradingView
This suggests that the bears are still active and are selling during rallies towards the 50-day SMA. For the bears to pave the way for a potential decline to $24,800, they must pull the price below $25,990. This level is expected to draw significant buying interest from the bulls.
On the upside, a break and close above the 50-day SMA will be the first indication of strength. The BTC/USDT pair could then rise to $27,500 and subsequently face resistance at $28,143, which the bears are anticipated to defend vigorously.
Ether price analysis
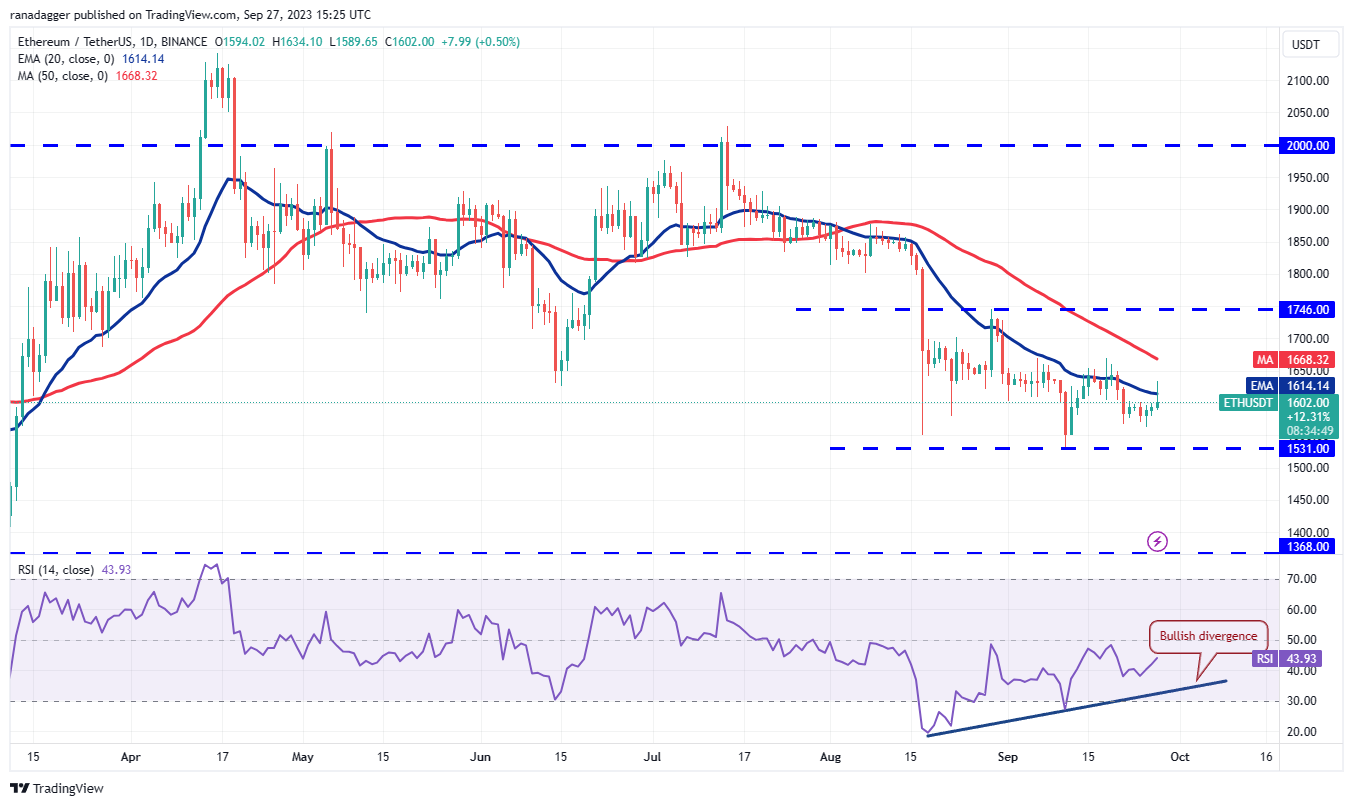
Ether (ETH) is attempting to initiate a recovery. The price exceeded the 20-day EMA ($1,614) on Sep. 27, but the bulls were unable to maintain the intraday surge. This indicates that higher levels continue to attract selling pressure.
 ETH/USDT daily chart. Source: TradingView
The bullish divergence observed on the relative strength index (RSI) favors the buyers. If they can keep the price above the 20-day EMA, the ETH/USDT pair may first rise to the 50-day SMA ($1,668) and then attempt to rally towards the overhead resistance at $1,746.
Conversely, if the price remains below the 20-day EMA, it will indicate that the bears are in control. The sellers will then aim to pull the price below the crucial support at $1,531. If successful, the pair may decline to $1,368.
BNB price analysis
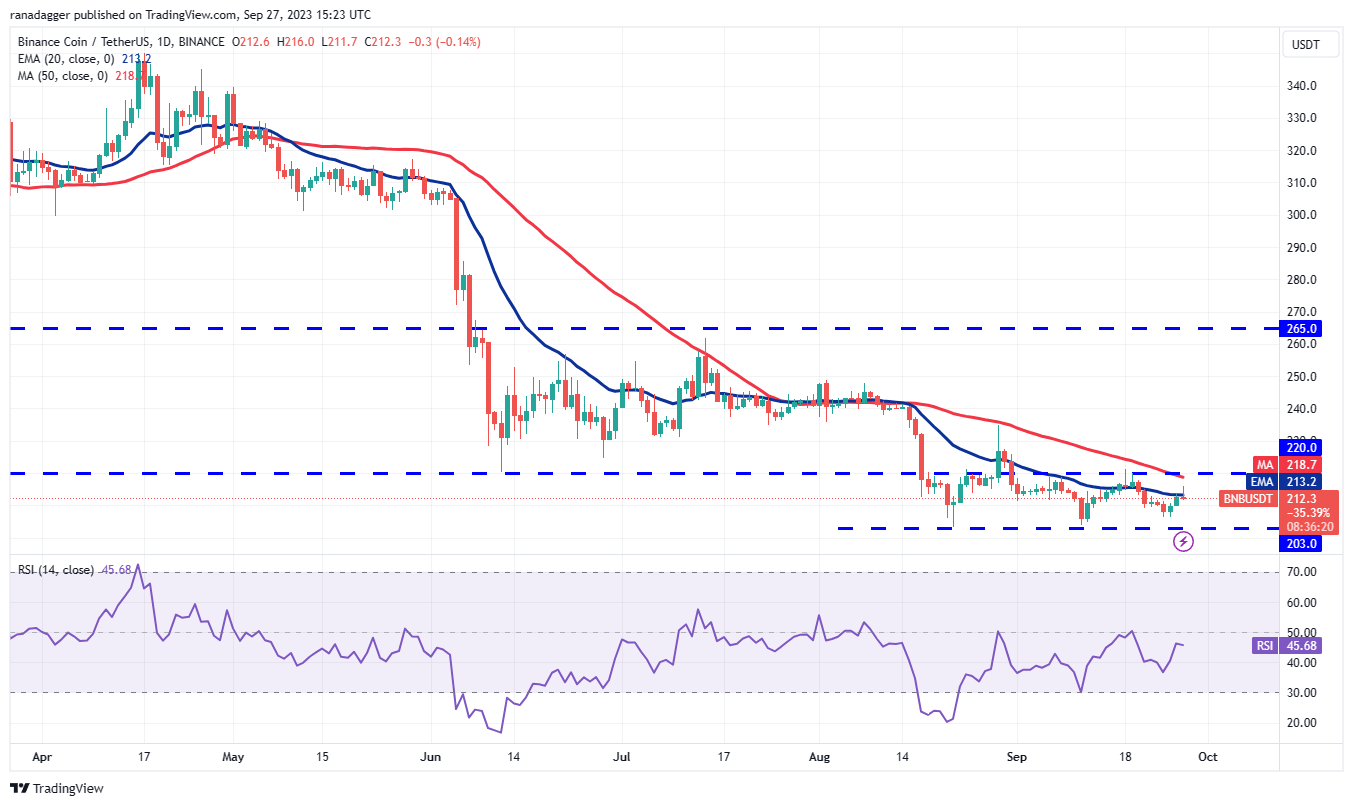
BNB (BNB) is currently trading below the breakdown level of $220, but a positive aspect is that the bulls have prevented the price from dropping below $203.
 BNB/USDT daily chart. Source: TradingView
The 20-day EMA ($213) is flattening, and the RSI is just below the midpoint, indicating a balance between supply and demand. This balance will shift in favor of the bulls if they can push the price above $220. The BNB/USDT pair could then rise to $235.
On the other hand, if the price continues to decline and breaks below $203, it will signal that the bears have taken control. The pair may then begin the next phase of the downtrend towards the strong support at $183.
XRP price analysis
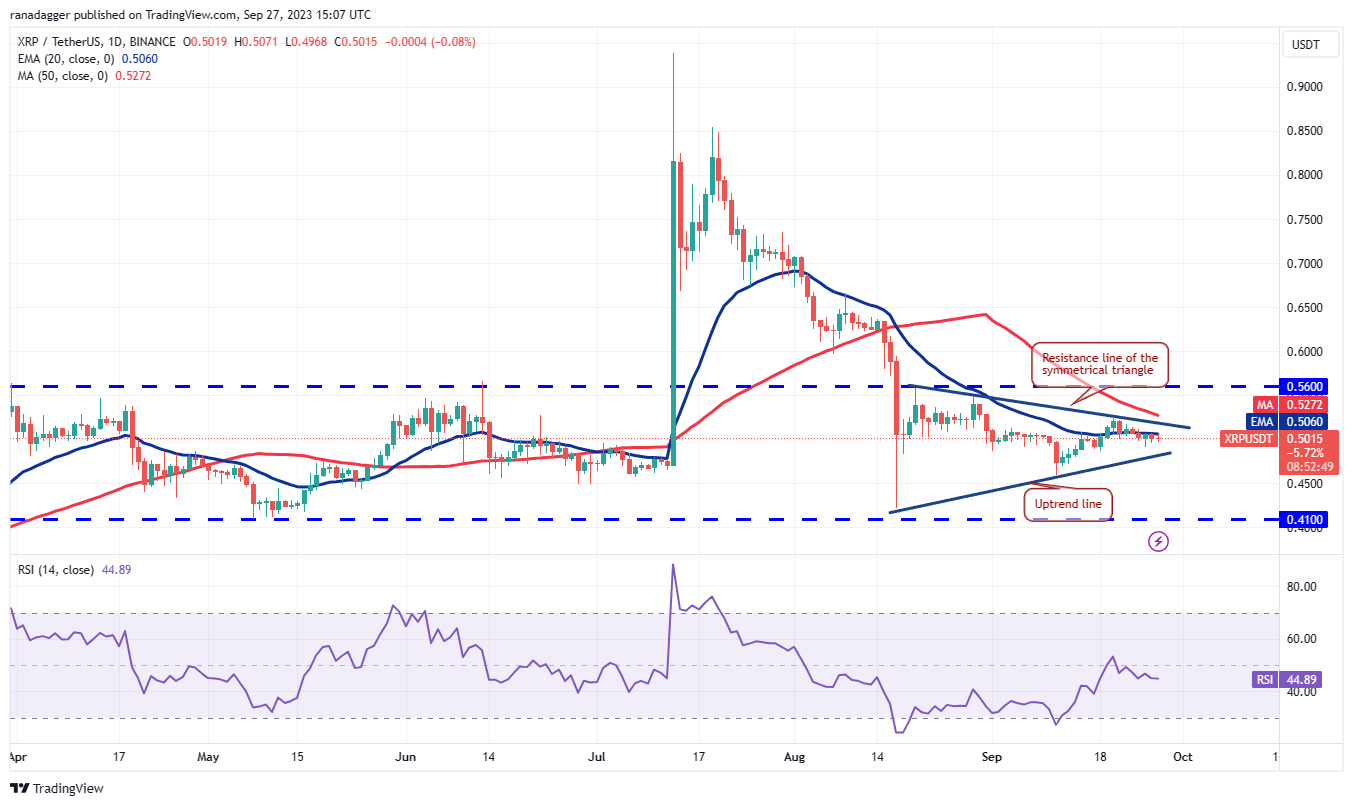
Buyers attempted to push XRP (XRP) above the 20-day EMA ($0.50) on Sep. 25, but the bears maintained their position.
 XRP/USDT daily chart. Source: TradingView
The recent price action has formed a symmetrical triangle pattern, indicating uncertainty between the bulls and the bears.
Sellers will attempt to gain the upper hand by dragging the price below the uptrend line. If they succeed, the XRP/USDT pair may fall to $0.46 and then to $0.41.
In contrast, if the price reverses and breaks above the resistance line, it will suggest that the bulls are trying to take control. The pair may then rise to the overhead resistance at $0.56.
Cardano price analysis
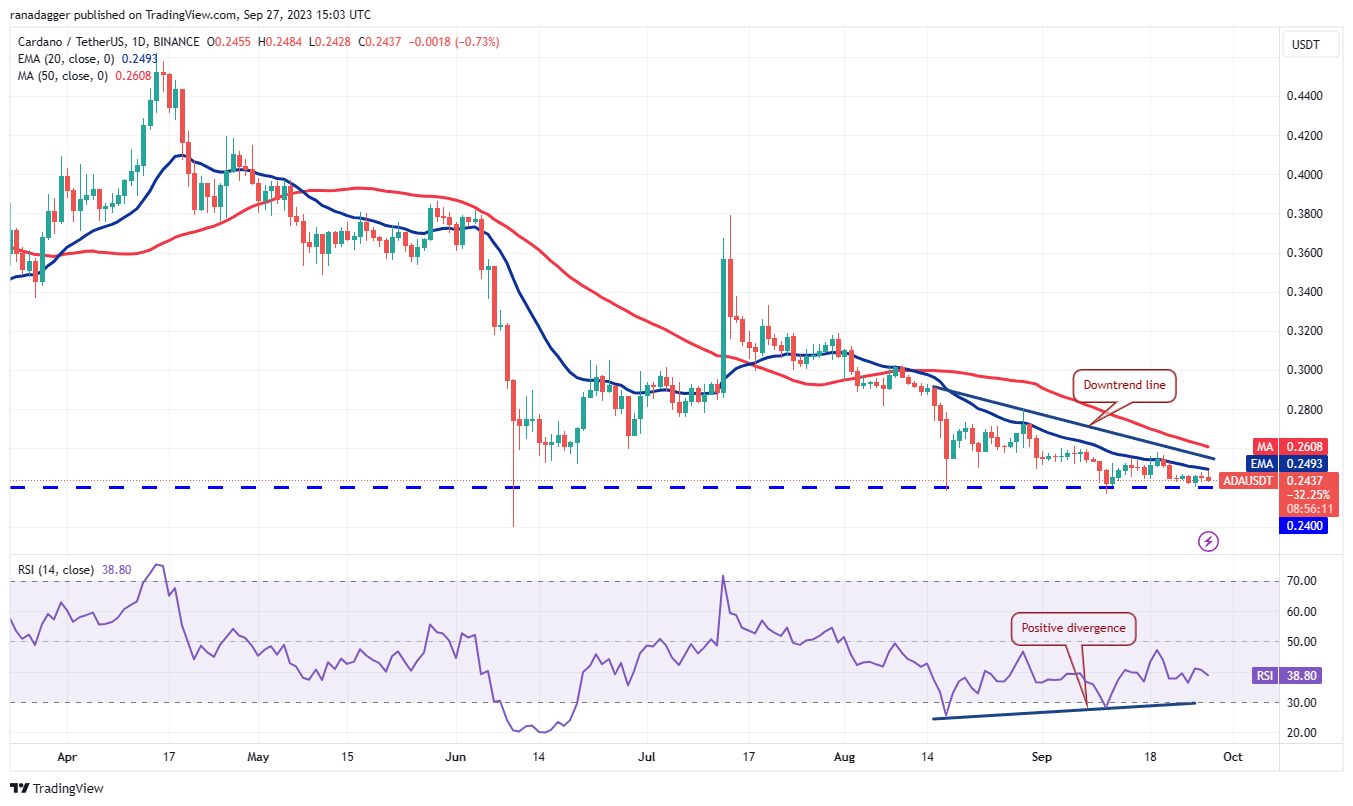
Cardano (ADA) rebounded from the crucial support at $0.24 on Sep. 25, but the bulls are finding it challenging to push the price above the 20-day EMA. This could lead to further selling.
 ADA/USDT daily chart. Source: TradingView
Related Posts
The $0.24 level is likely to see a fierce contest between the bulls and the bears. If the support at $0.24 fails, the ADA/USDT pair will complete a bearish descending triangle pattern. The pair may then initiate a downward movement to $0.22 and subsequently to the target of $0.19.
Conversely, if the price rises and breaks above the downtrend line, it will invalidate the bearish setup. The pair may then begin an upward movement towards $0.29.
Dogecoin price analysis
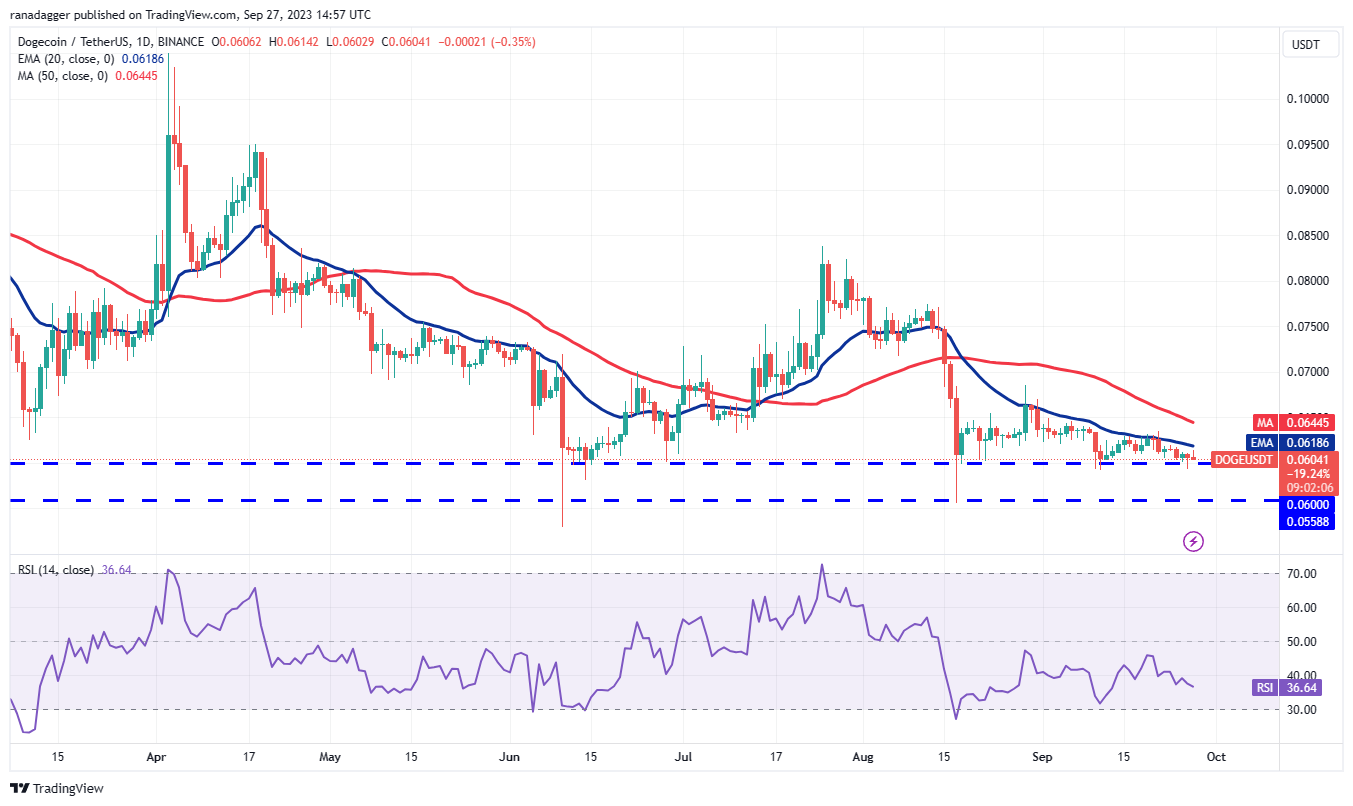
The bears pushed Dogecoin (DOGE) below the $0.06 support on Sep. 26, but the long tail on the candlestick indicates buying interest at lower levels.
 DOGE/USDT daily chart. Source: TradingView
However, the gradually declining 20-day EMA ($0.06) and the RSI in negative territory suggest that bears remain in control. Sellers will make another attempt to push the price below $0.06. If they succeed, the DOGE/USDT pair may drop to the next significant support at $0.055.
Alternatively, if the price rebounds from the current level and rises above the 20-day EMA, it will indicate that the bulls are making a comeback. The pair could first rally to $0.07 and then aim for $0.08.
Solana price analysis
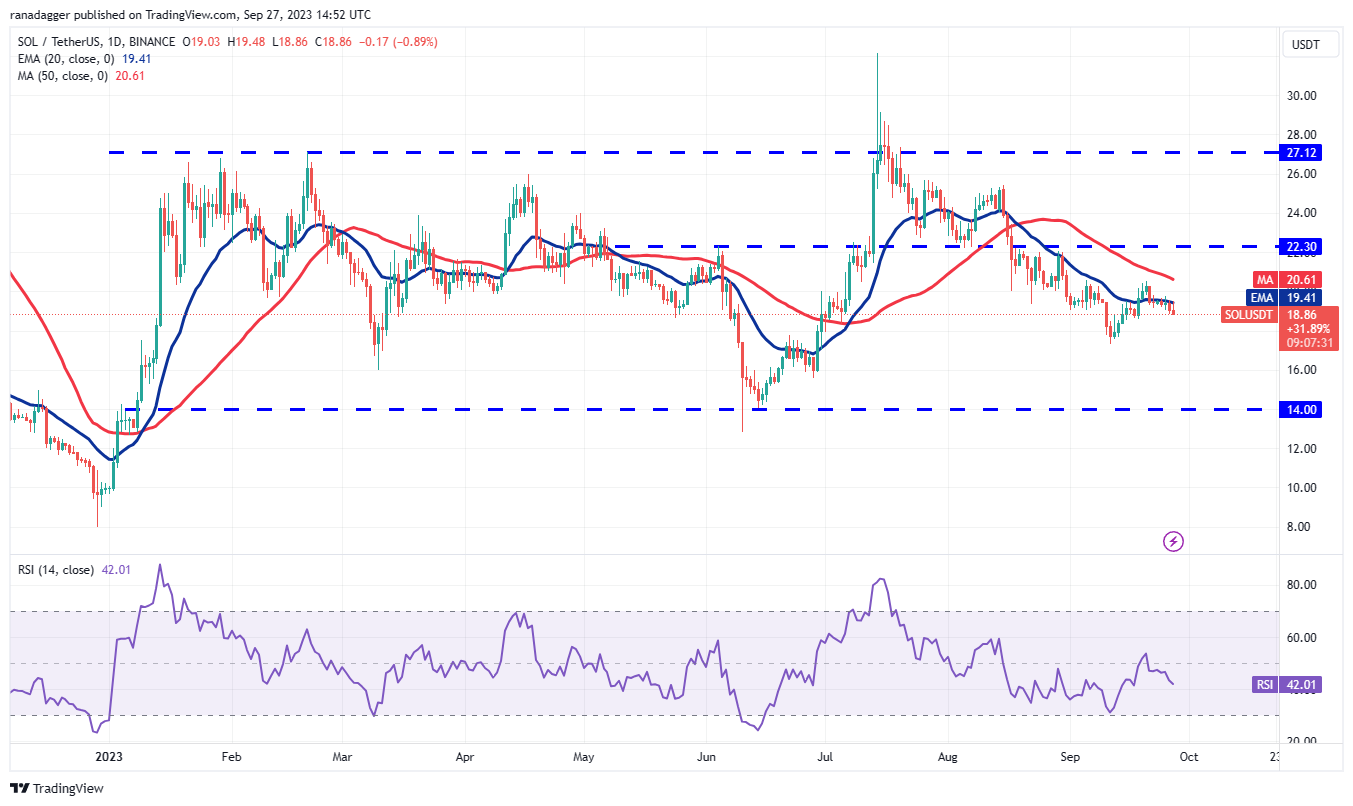
The inability of the bulls to drive Solana (SOL) above the 20-day EMA ($19.42) in recent days indicates that the bears are vigorously defending this level.
 SOL/USDT daily chart. Source: TradingView
The price has retreated from the 20-day EMA, and the bears will attempt to capitalize on their advantage by pulling the SOL/USDT pair below the nearest support at $18.50. If this level breaks, selling pressure could increase, with the next target likely being $17.33.
Conversely, if the price bounces off $18.50, it will suggest buying on dips. The bulls will then try once more to push the price above the moving averages. If successful, the pair may surge to $22.30.
Related: Bitcoin price to $30K in October, says analyst as BTC price climbs 2%
Toncoin price analysis
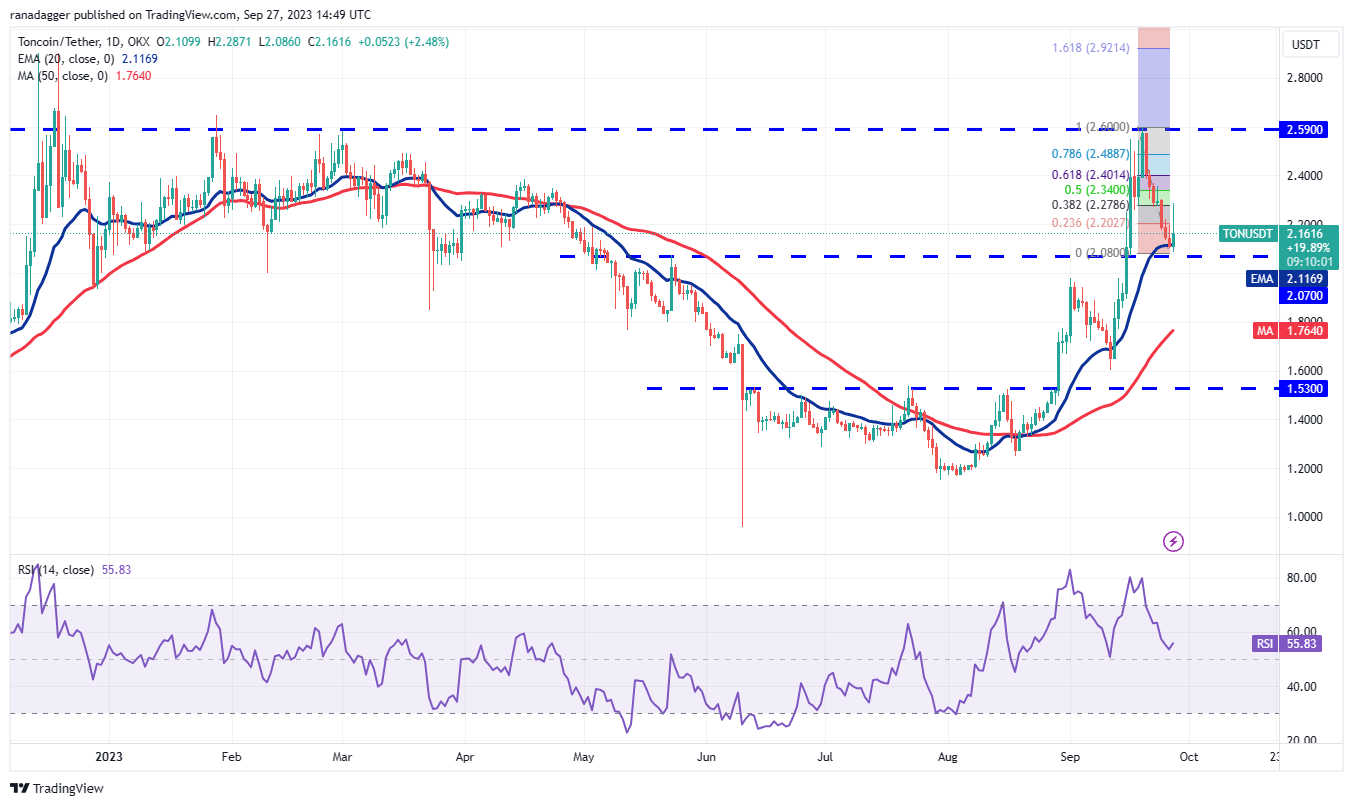
Toncoin (TON) has fallen to the 20-day EMA ($2.11), which is a crucial level to monitor. In an uptrend, buyers typically purchase dips to the 20-day EMA.
 TON/USDT daily chart. Source: TradingView
In this instance, the bulls bought the dip to the 20-day EMA on Sep. 27, but the long wick on the candlestick indicates that the bears are selling at higher levels. If buyers can maintain the price above the 20-day EMA, the TON/USDT pair will attempt a rally to the 61.8% Fibonacci retracement level of $2.40.
Meanwhile, sellers are likely to have other intentions. They will aim to pull the price below $2.07 and extend the correction to the next major support at the 50-day SMA ($1.76).
Polkadot price analysis
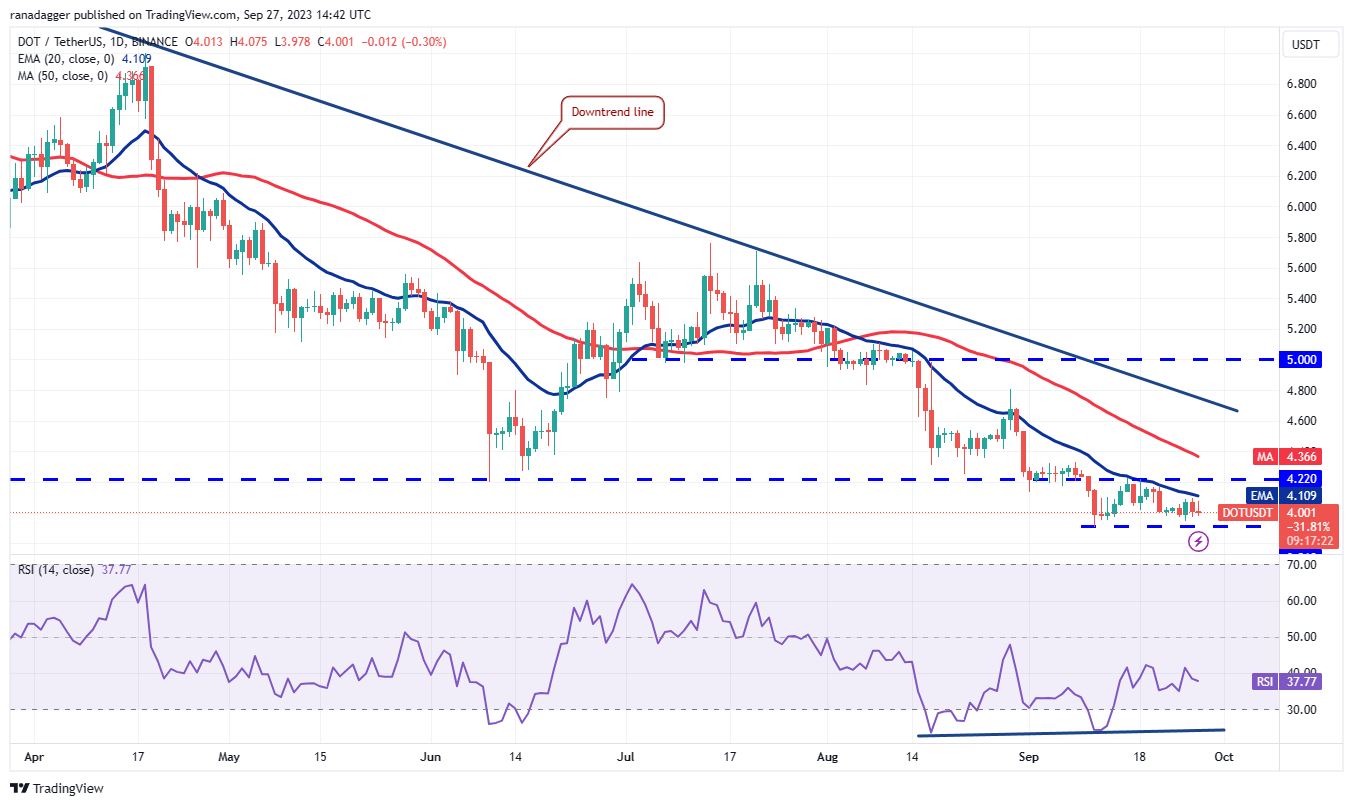
Polkadot (DOT) has remained below the 20-day EMA ($4.10) for several days, indicating that the bears are strongly defending this level.
 DOT/USDT daily chart. Source: TradingView
The RSI is showing signs of a potential bullish divergence, but buyers must overcome the overhead resistance at $4.22 to alleviate the selling pressure. If they fail to do so, the risk of a further decline persists.
If the DOT/USDT pair continues to drop and falls below the immediate support at $3.91, it will indicate the beginning of the next phase of the downtrend. The next support on the downside is at $3.58.
Polygon price analysis
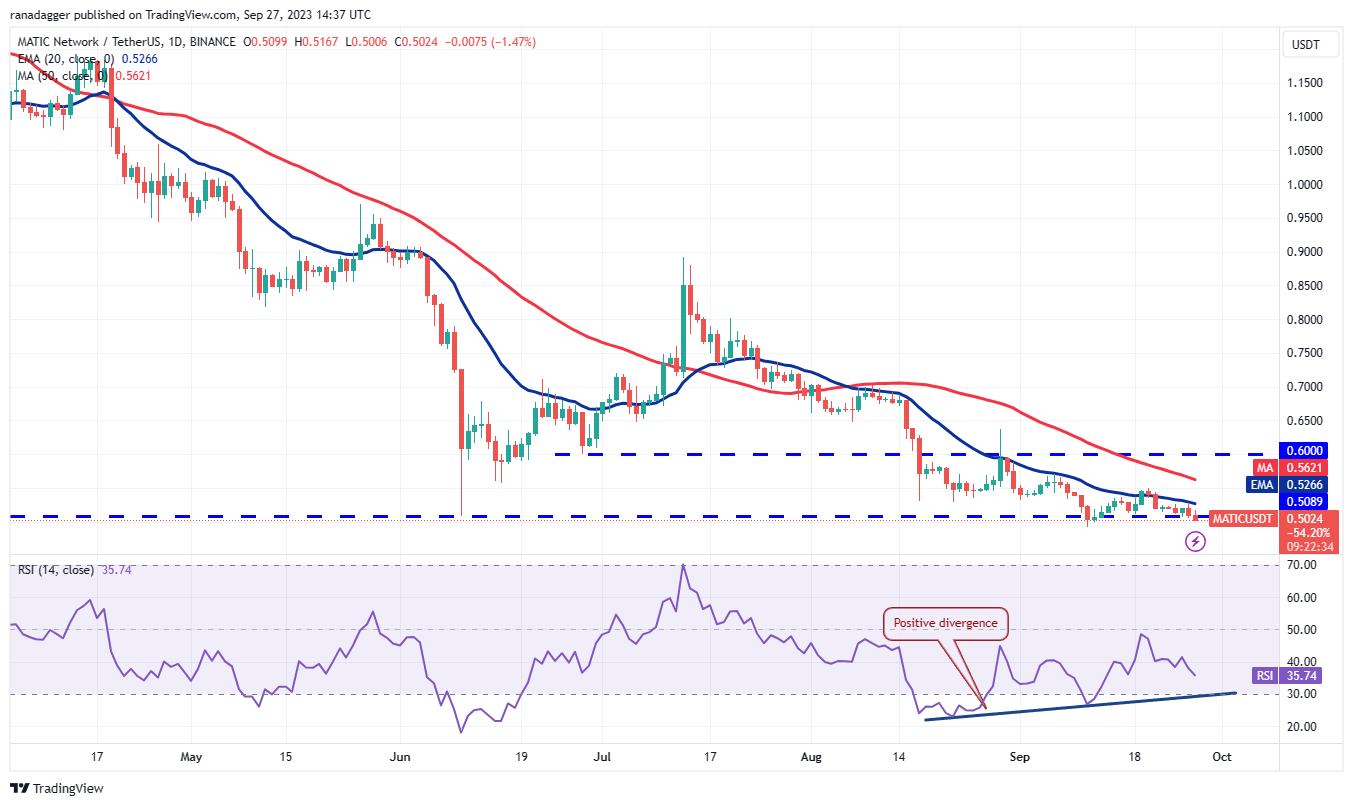
Polygon (MATIC) rebounded from the critical support at $0.51 on Sep 25, but the bulls were unable to push the price above the 20-day EMA ($0.53).
 MATIC/USDT daily chart. Source: TradingView
This indicates that the sentiment remains negative, with traders selling during rallies. The bears will attempt to drive the price below the Sep. 11 intraday low of $0.49. A breakdown of this support will signal the continuation of the downtrend.
A slight glimmer of hope for the bulls is that the RSI is forming a bullish divergence. Buyers will need to push and maintain the price above the 20-day EMA to indicate the start of a sustained recovery. The MATIC/USDT pair could then rise to the 50-day SMA ($0.56).
This article does not contain investment advice or recommendations. Every investment and trading move involves risk, and readers should conduct their own research when making a decision.