Disclaimer: Information found on CryptoreNews is those of writers quoted. It does not represent the opinions of CryptoreNews on whether to sell, buy or hold any investments. You are advised to conduct your own research before making any investment decisions. Use provided information at your own risk.
CryptoreNews covers fintech, blockchain and Bitcoin bringing you the latest crypto news and analyses on the future of money.
The volatility of Bitcoin has escalated in recent days. The price surged on Aug. 29 following Grayscale’s success against the United States Securities and Exchange Commission (SEC). However, this excitement was fleeting, as the price retraced all recent gains after the SEC announced a delay in its decision regarding all seven spot Bitcoin (BTC) exchange-traded fund (ETF) applications.
Recent developments concerning Bitcoin ETFs have been a significant catalyst for market movements in the last few days. Bloomberg ETF analysts remain optimistic about the likelihood of the ETFs receiving approval from the regulator in 2023. In a post on X (formerly Twitter) dated Aug. 30, Bloomberg senior ETF analyst Eric Balchunas raised the approval probability of a spot Bitcoin ETF from 65% to 75%.
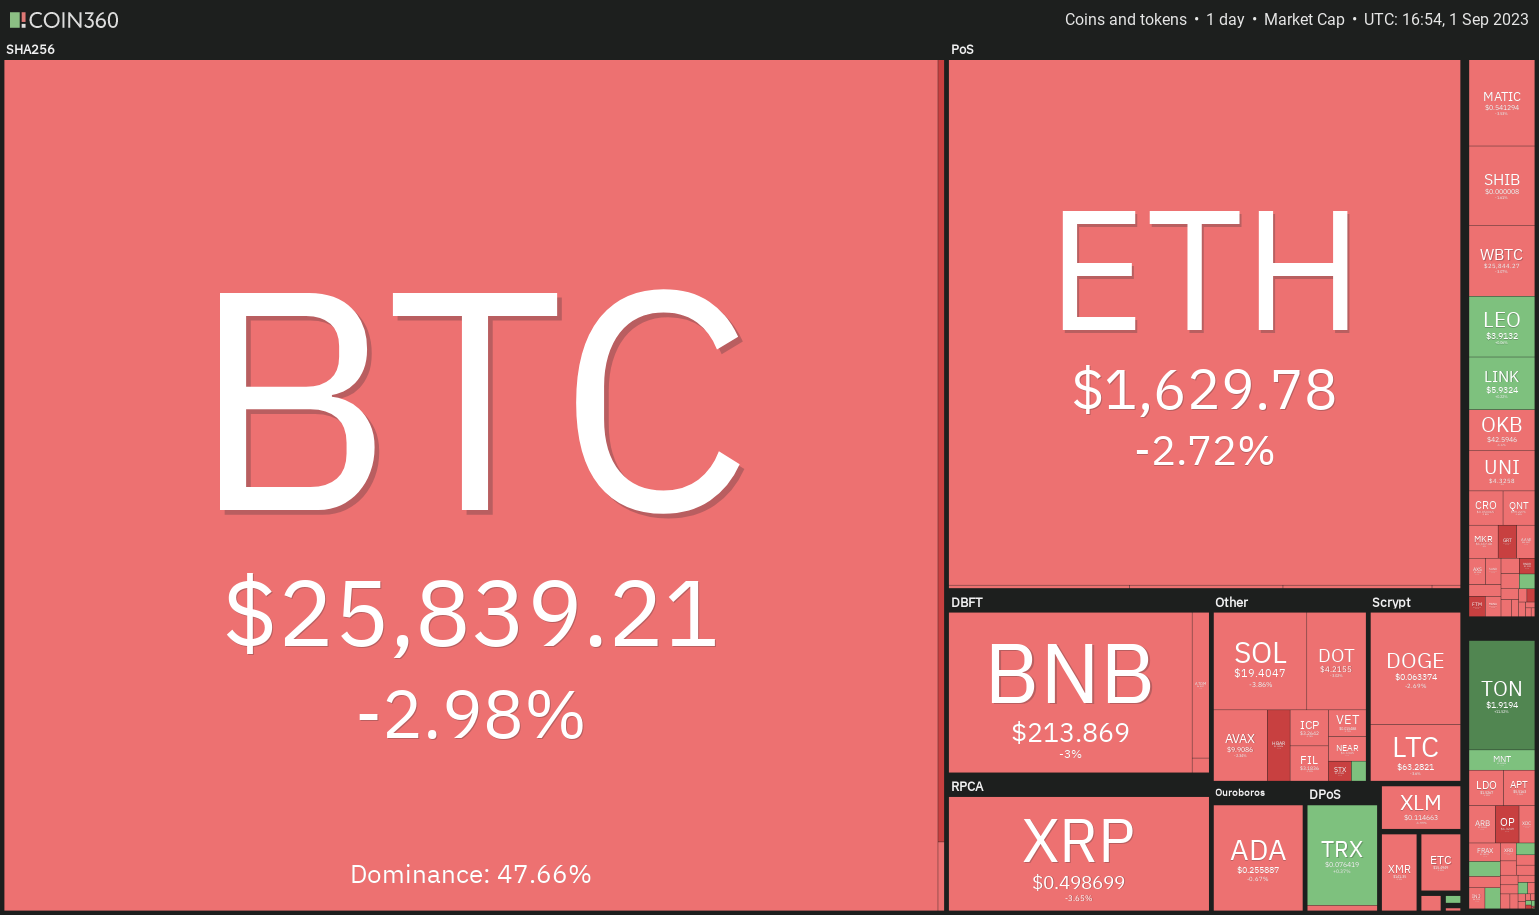 Daily cryptocurrency market performance. Source: Coin360
In the short term, bulls are facing significant challenges, as September has historically favored bearish trends. Data from CoinGlass indicates that Bitcoin has experienced negative returns in September for the last six years. Will this trend persist in 2023?
The weakness in Bitcoin is impacting several prominent altcoins, which have approached their critical support levels. Will the downturn continue, or is a rebound imminent? Let’s analyze the charts of the top 10 cryptocurrencies to determine the outlook.
Bitcoin price analysis
The bulls were unable to maintain the 20-day exponential moving average (EMA) of $26,947 on Aug. 31. This triggered a sell-off that pushed Bitcoin below the breakout level of $26,833.
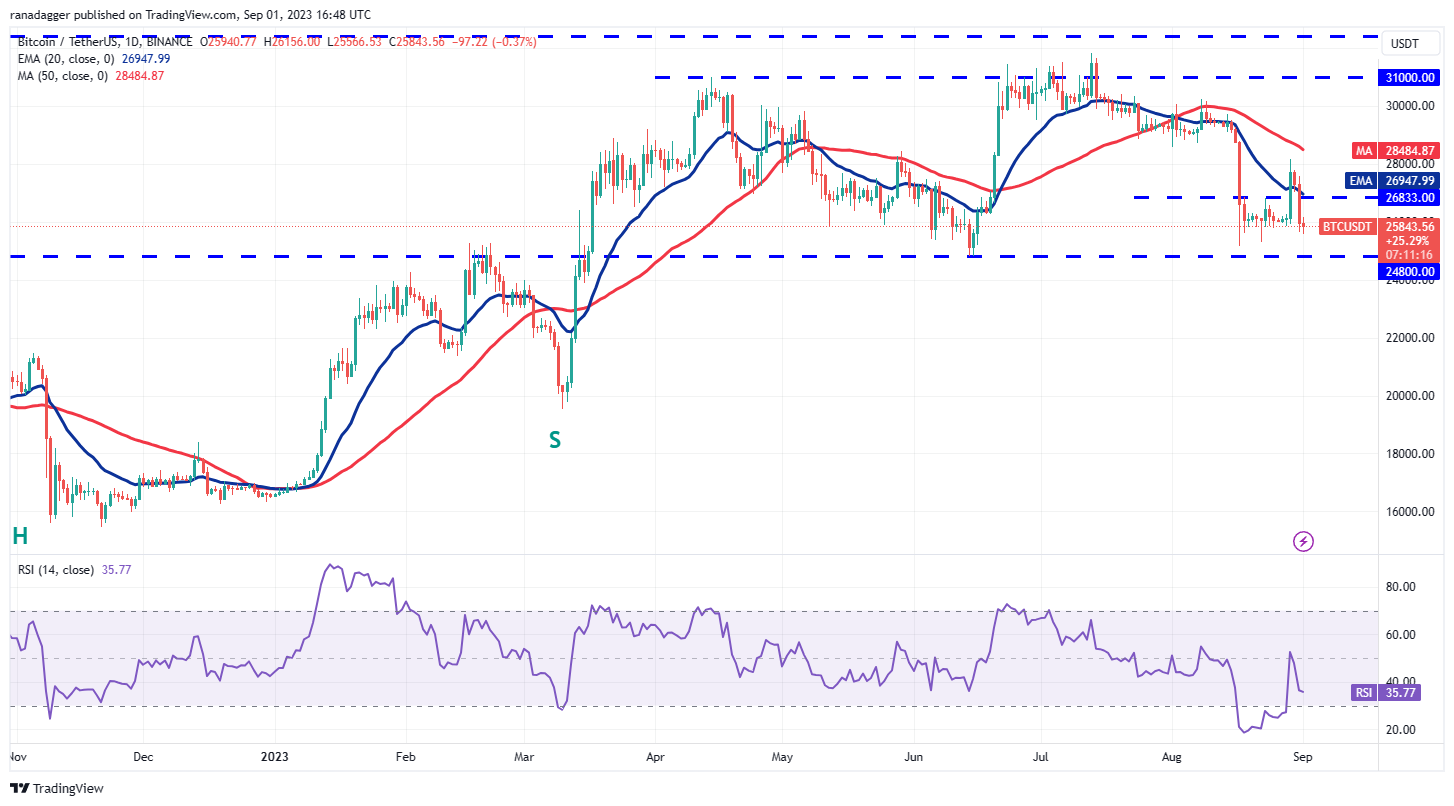 BTC/USDT daily chart. Source: TradingView
The recent price movements indicate that the BTC/USDT pair has been fluctuating within a broad range between $24,800 and $31,000. Typically, traders buy during dips to the support of the range and sell near the resistance. The same behavior is anticipated from the bulls at $24,800.
If bears aim to take control, they must push and maintain the price below $24,800. Should this occur, the pair may extend its decline to $19,500. There is minor support at $24,000, but it may not hold for an extended period.
Ether price analysis
Ether’s (ETH) bounce off the strong support at $1,626 lost momentum at $1,745 on Aug. 29. This suggests that bears remain active at elevated levels.
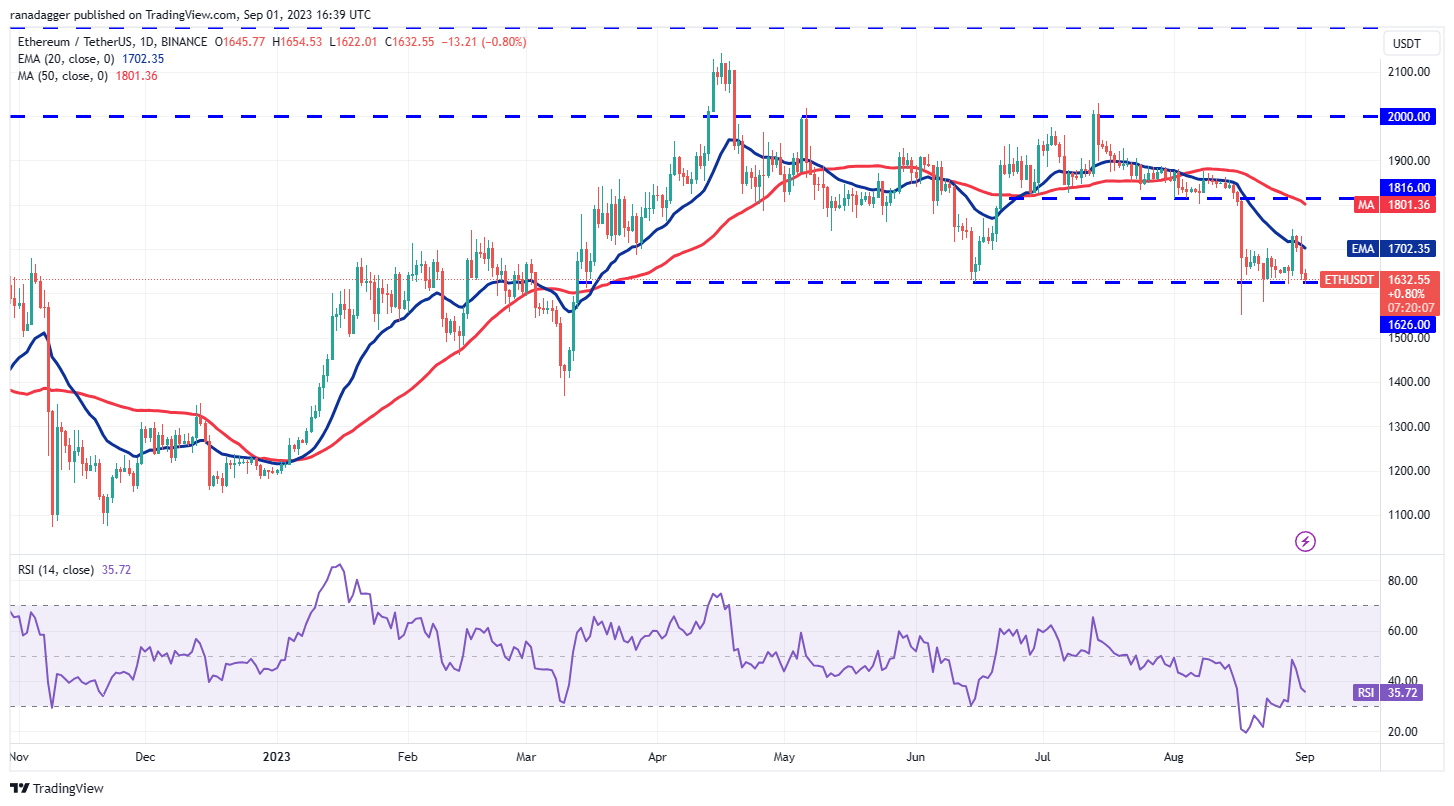 ETH/USDT daily chart. Source: TradingView
The bears will attempt to capitalize on their advantage by driving the price below the $1,626 to $1,550 support zone. If successful, it will indicate the beginning of a new downtrend. The ETH/USDT pair could then plunge to the next significant support at $1,368.
Conversely, if the price rebounds sharply from the current level, it will suggest that the bulls are vigorously defending the support. This could propel the price to the 20-day EMA ($1,702) and subsequently to $1,745, which may act as resistance.
BNB price analysis
BNB’s (BNB) recovery stalled at the 50-day simple moving average (SMA) of $234 on Aug. 29, and the bears pulled the price below the crucial support at $220 on Aug. 31.
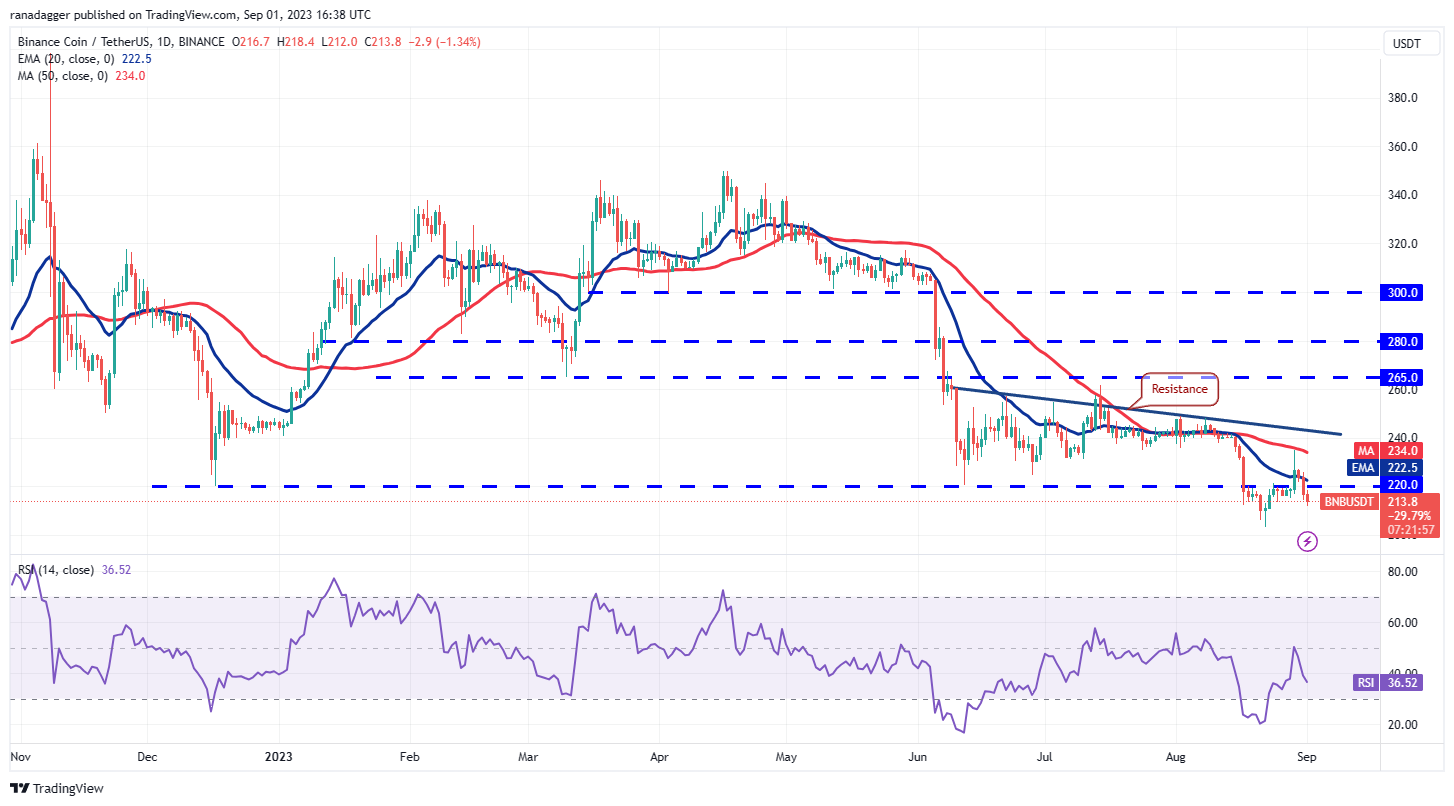 BNB/USDT daily chart. Source: TradingView
The moving averages are trending downward, and the relative strength index (RSI) is in the negative zone, indicating that bears have the upper hand. The bears will aim to drive the price down to the psychological support at $200. If this level fails, the BNB/USDT pair could reach the next major support at $183.
If bulls wish to initiate a relief rally, they must push the price back above the 20-day EMA ($222). The pair could then rise to the 50-day SMA and subsequently to the resistance line.
XRP price analysis
The long tail on XRP’s (XRP) Aug. 31 candlestick indicates that the bulls are attempting to defend the support at $0.50. However, the price action on Sep. 1 shows that the bears are maintaining their pressure.
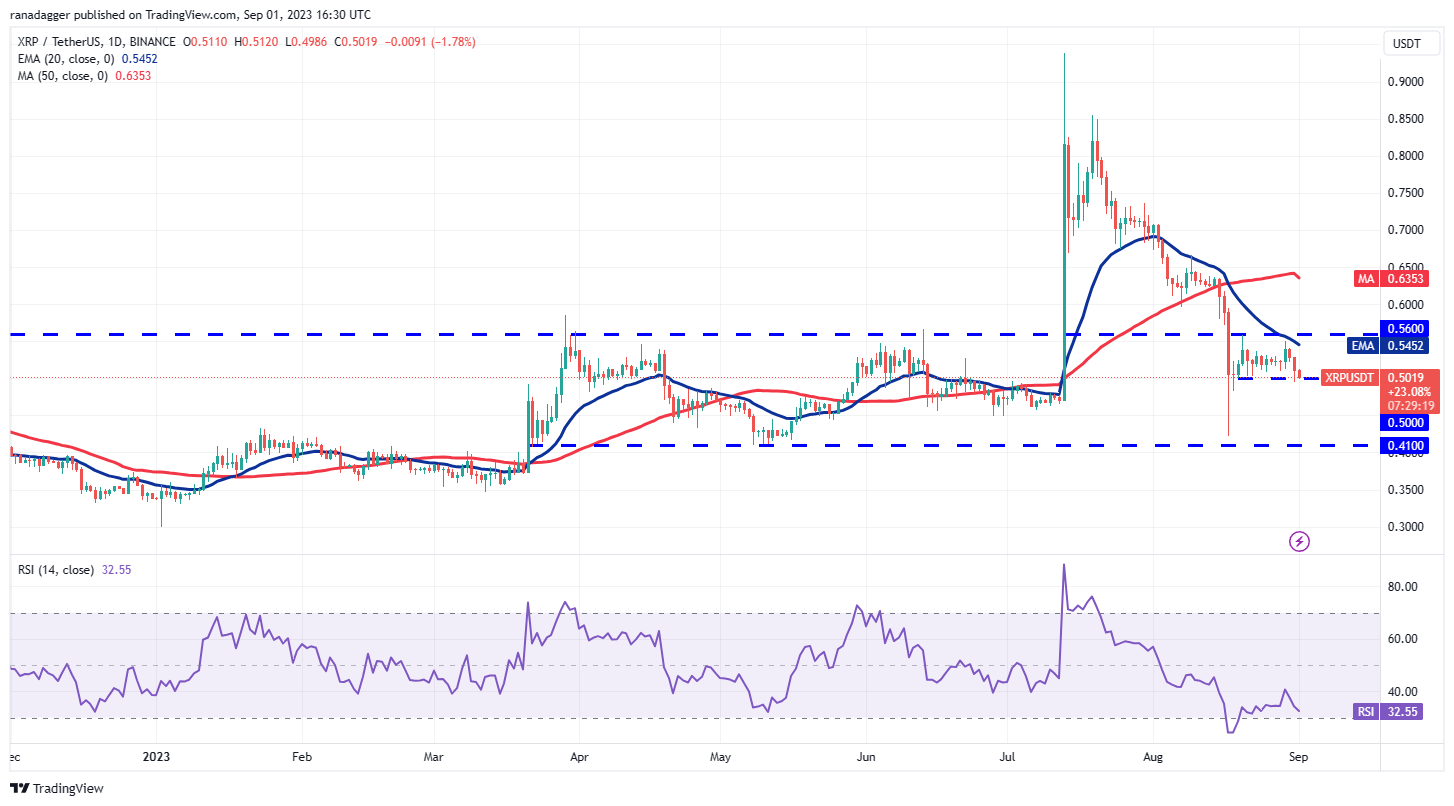 XRP/USDT daily chart. Source: TradingView
If the price drops below $0.50, it will suggest that bears have regained control. This could initiate a downward move to the significant support at $0.41. The bulls are likely to defend this level vigorously. A rebound from the support could keep the XRP/USDT pair range-bound between $0.41 and $0.56 for a while longer.
If the price bounces off $0.50, it will indicate that the pair may attempt a rally to $0.56. The bulls will need to overcome this barrier to initiate a new upward movement to $0.63 and then to $0.73.
Cardano price analysis
Cardano (ADA) has been trading within a range of $0.24 to $0.28 for several days. The bulls pushed the price above this range on Aug. 29 but were unable to maintain the higher levels.
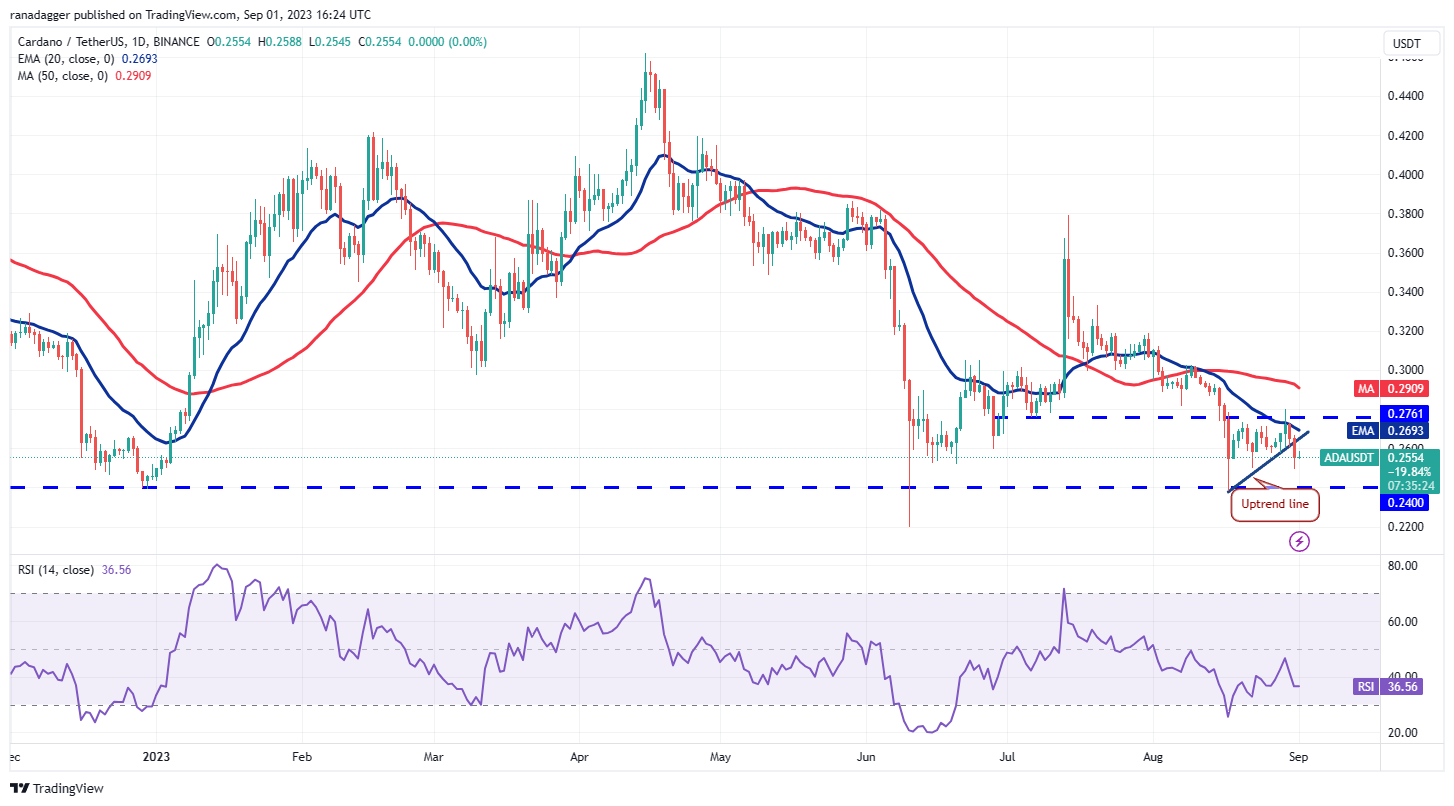 ADA/USDT daily chart. Source: TradingView
Related Posts
This may have prompted short-term bulls to exit their positions. The selling intensified, and the price fell below the uptrend line on Aug. 31. The bears will now attempt to push the ADA/USDT pair below the crucial support at $0.24.
If the price rebounds from $0.24, the pair may continue to consolidate within the range for a longer period. Conversely, if the price falls below $0.24, it will signal the start of a downward move to $0.22 and eventually to $0.20.
Dogecoin price analysis
The bulls are facing challenges in initiating a recovery in Dogecoin (DOGE), indicating that demand is waning at higher levels.
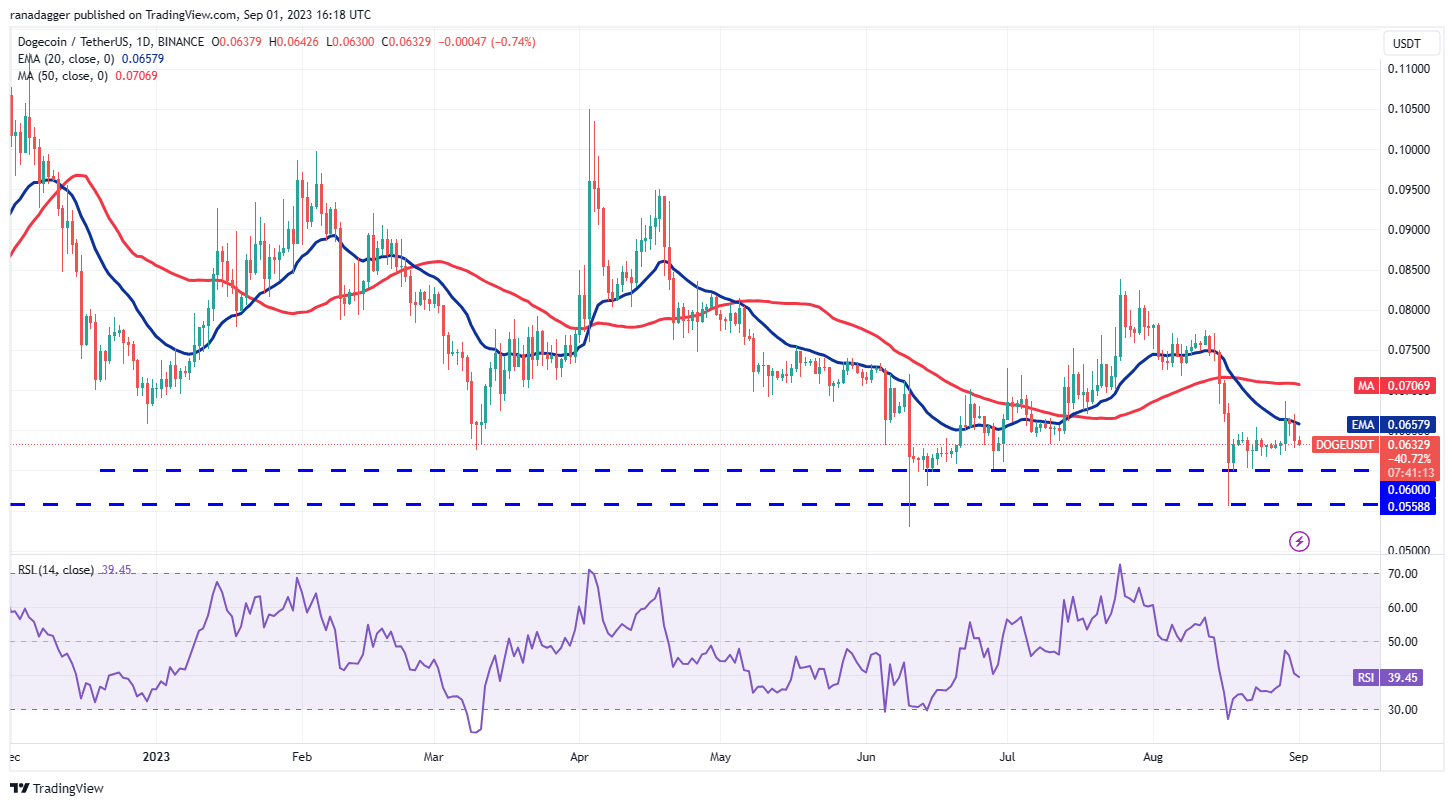 DOGE/USDT daily chart. Source: TradingView
The DOGE/USDT pair may decline to the solid support at $0.06. Buyers are expected to defend this level vigorously, as a breach below it could resume the downtrend. The pair could first drop to $0.055 and then to the final support near $0.05.
On the other hand, if the price rebounds from $0.06, it will indicate that the bulls are purchasing the dips at this level. The bulls will then attempt to overcome the obstacle at the 20-day EMA. If successful, the pair may rise to $0.08.
Solana price analysis
Solana (SOL) retraced from the 20-day EMA ($21.37) on Aug. 30, indicating that bears remain in control. The price has reached the critical support at $19.35.
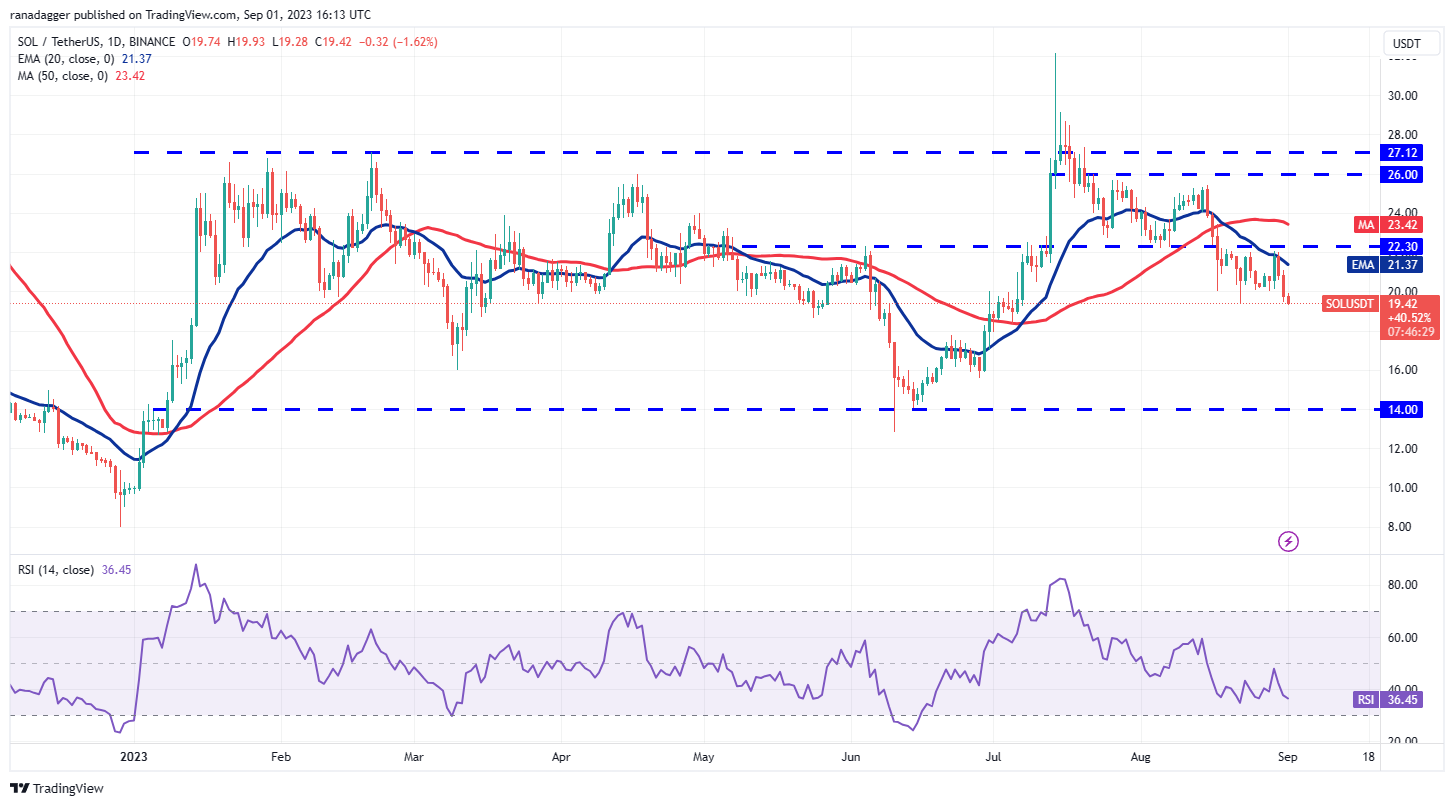 SOL/USDT daily chart. Source: TradingView
The 20-day EMA is trending downward, and the RSI is in the negative territory, suggesting that the path of least resistance is downward. If the $19.35 support fails, selling could escalate, and the SOL/USDT pair may drop to $18.
Time is running out for the bulls. To initiate a recovery, they must quickly push the price above the overhead resistance at $22.30. If they achieve this, the pair may surge toward $26. The 50-day SMA ($23.42) may present a challenge, but it is likely to be surpassed.
Related: Bitcoin lines up RSI showdown as BTC price slips toward new 2-week low
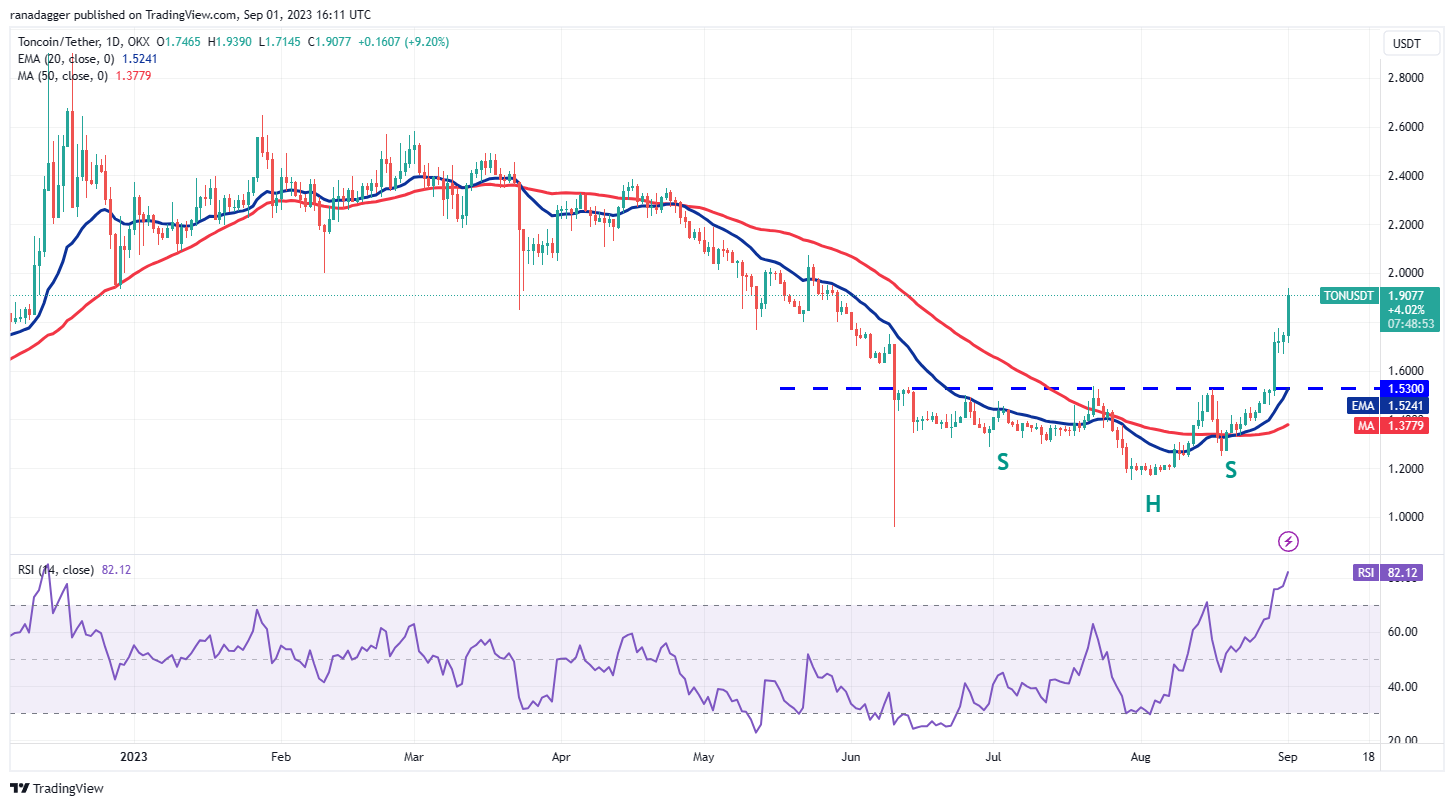
Toncoin price analysis
Toncoin (TON) is experiencing a robust uptrend. The bears attempted to halt the rally near $1.77, but the bulls did not relinquish much ground. This indicates that the bulls are not in a hurry to take profits.
 TON/USDT daily chart. Source: TradingView
Buying resumed on Sep. 1, and the TON/USDT pair reached the pattern target of $1.91. If buyers surpass this level, the uptrend may continue, potentially propelling the pair to $2.38. This level may see profit-taking by traders.
This bullish perspective will be invalidated if the price declines and breaks below $1.66. Such a move would suggest aggressive selling at higher levels, which could then drive the pair down to the breakout level of $1.53.
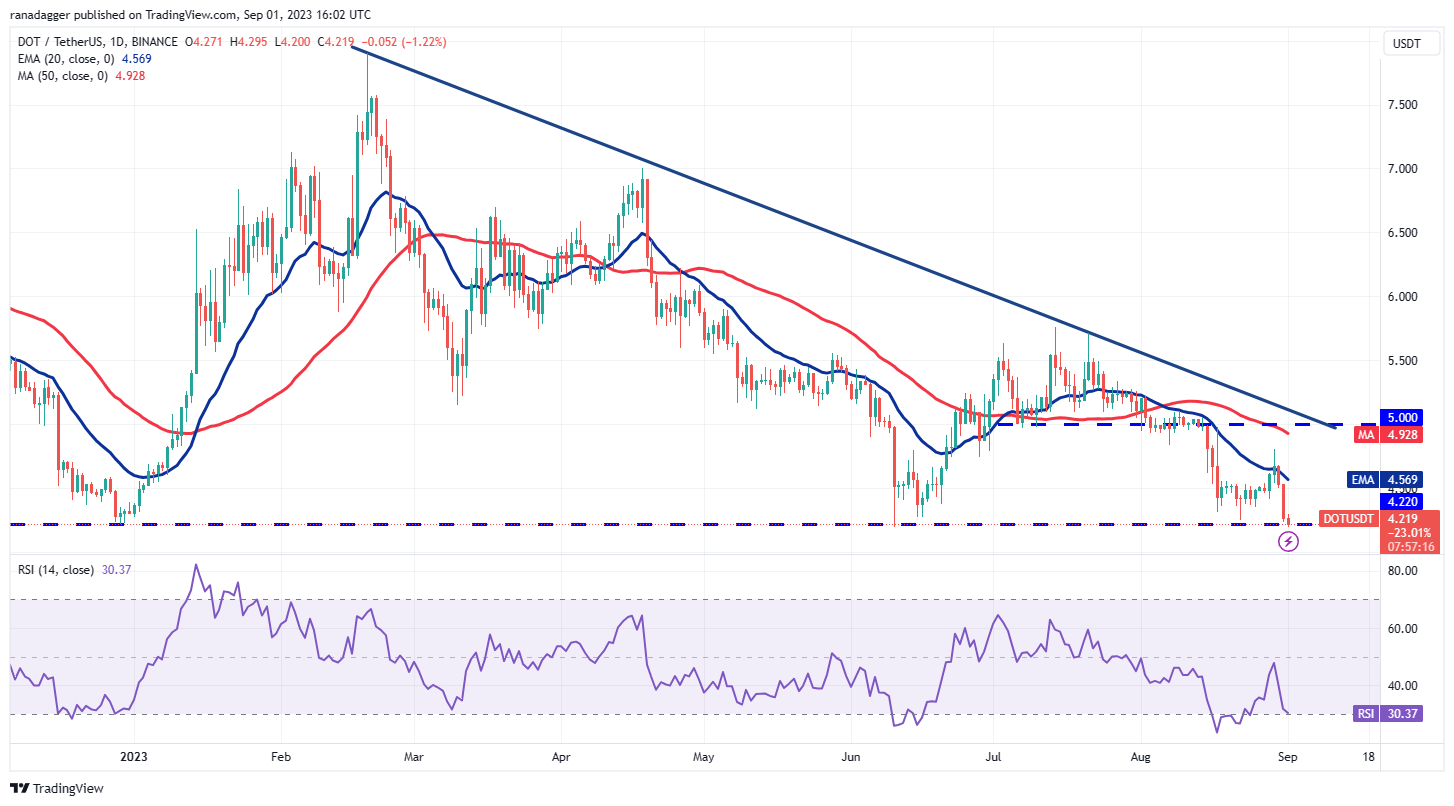
Polkadot price analysis
Polkadot (DOT) declined from the 20-day EMA ($4.56) on Aug. 30, indicating that sentiment remains negative and traders are selling during rallies.
 DOT/USDT daily chart. Source: TradingView
The selling intensified on Aug. 31, and the DOT/USDT pair fell to the critical support at $4.22. This level is likely to see a confrontation between bulls and bears. If the price drops below $4.22, the pair could initiate the next phase of the downtrend to $4.
Buyers have a clear task ahead. To mount a comeback, they must quickly push and sustain the price above the 20-day EMA. If they succeed, the pair could rise to the overhead resistance at $5.
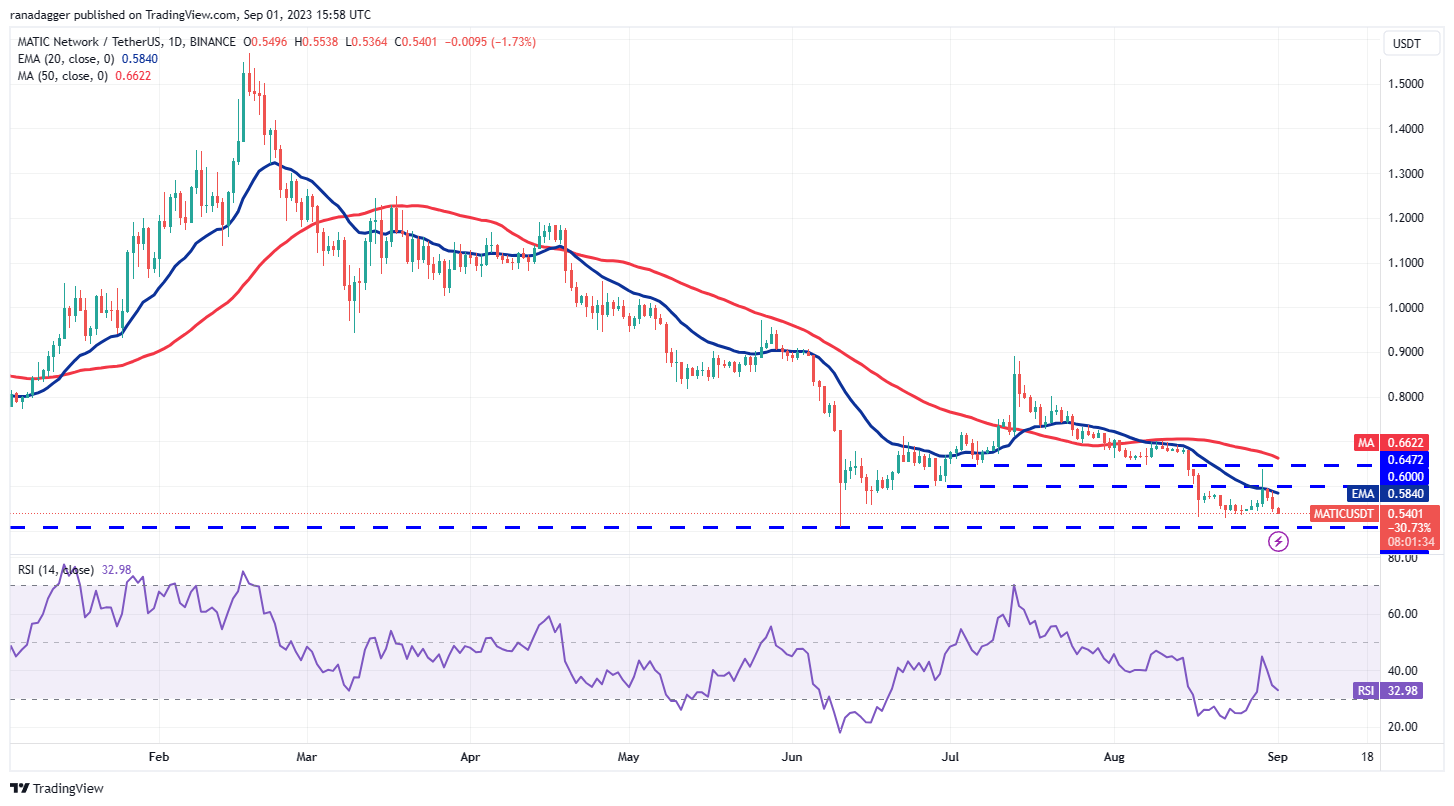
Polygon price analysis
Polygon’s (MATIC) inability to hold above the 20-day EMA ($0.58) on Aug. 29 may have prompted profit-taking from short-term traders. The bulls attempted to push the price back above the 20-day EMA on Aug. 30 and 31, but the bears maintained their position.
 MATIC/USDT daily chart. Source: TradingView
The bears will aim to strengthen their position by driving the price below the immediate support at $0.53. If they succeed, the MATIC/USDT pair may decline to the crucial support at $0.51.
If the price rebounds from the current level, it is likely to encounter selling at the 20-day EMA and again at the 50-day SMA ($0.66). Conversely, a drop below $0.51 could resume the downtrend, with the next support at $0.45.
This article does not contain investment advice or recommendations. Every investment and trading move involves risk, and readers should conduct their own research when making a decision.