Disclaimer: Information found on CryptoreNews is those of writers quoted. It does not represent the opinions of CryptoreNews on whether to sell, buy or hold any investments. You are advised to conduct your own research before making any investment decisions. Use provided information at your own risk.
CryptoreNews covers fintech, blockchain and Bitcoin bringing you the latest crypto news and analyses on the future of money.
Bitcoin has decreased by approximately 11% in August, falling just short of the 13.88% drop experienced in the same month of 2022, based on data from CoinGlass. The outlook for September also appears dim. Historical trends indicate that since 2017, Bitcoin (BTC) has consistently faced declines in September.
Mike McGlone, a senior macro strategist at Bloomberg Intelligence, holds an even more pessimistic view on Bitcoin. In an interview with Kitco News, McGlone cautioned that in the event of a “global economic reset,” Bitcoin could plummet to as low as $10,000.
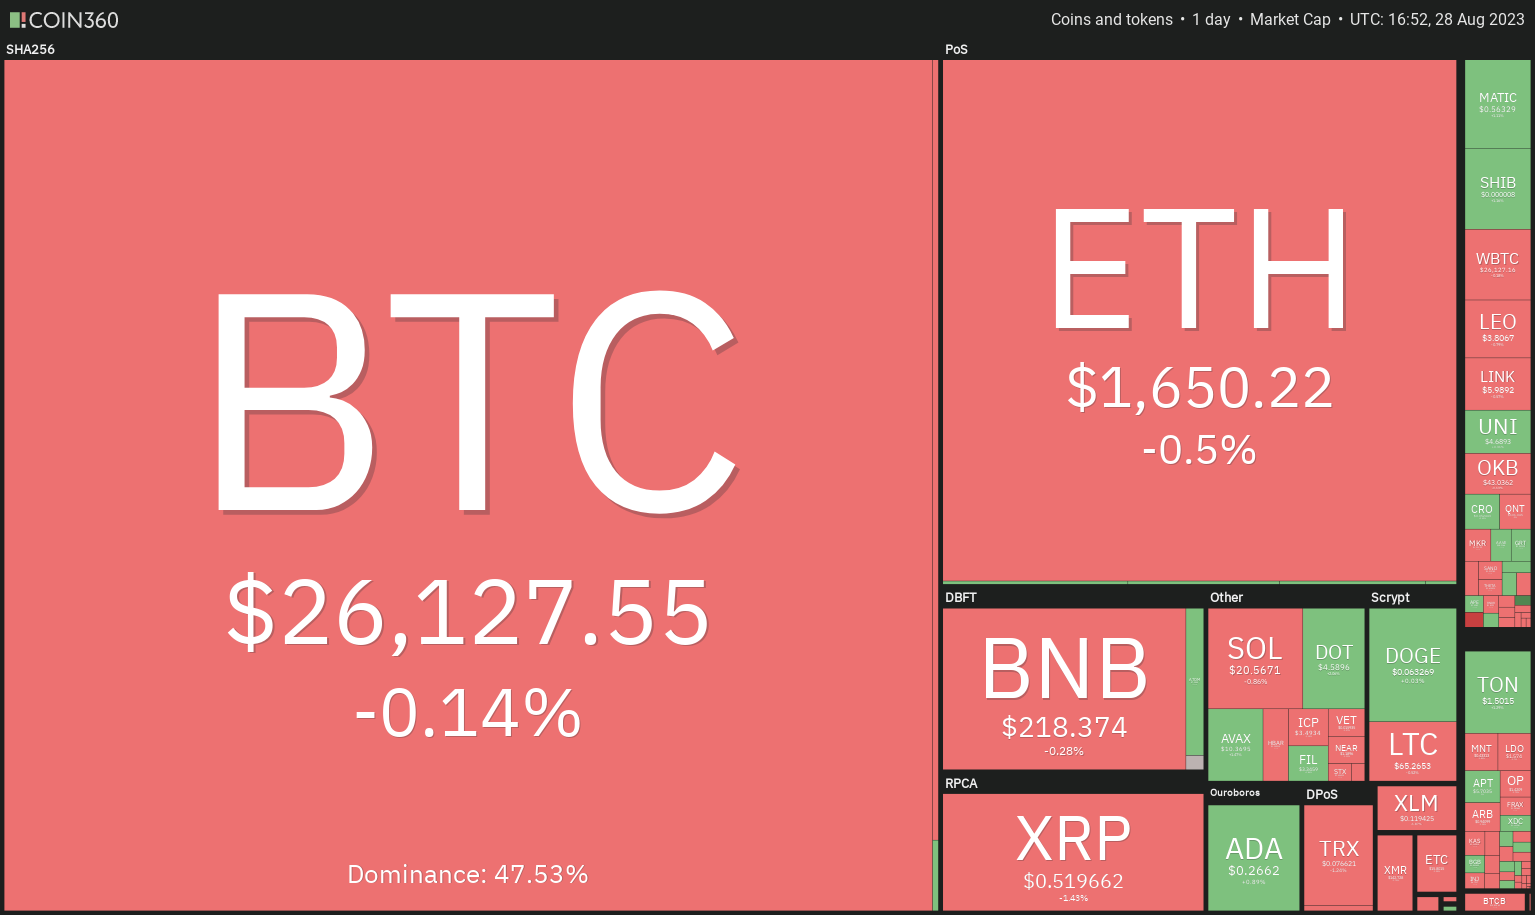 Daily cryptocurrency market performance. Source: Coin360
While analysts have presented both optimistic and pessimistic targets, it is advisable to wait for the price to break out of the existing range before making significant investments. Generally, following a period of low volatility, volatility tends to increase, but predicting the breakout’s direction is challenging.
Do Bitcoin and the major altcoins indicate potential breakout signs? What critical levels should be monitored? Let’s delve into the charts to explore.
S&P 500 Index price analysis
The S&P 500 Index (SPX) declined from the moving averages on Aug. 24, but the bears were unable to maintain the lower levels.
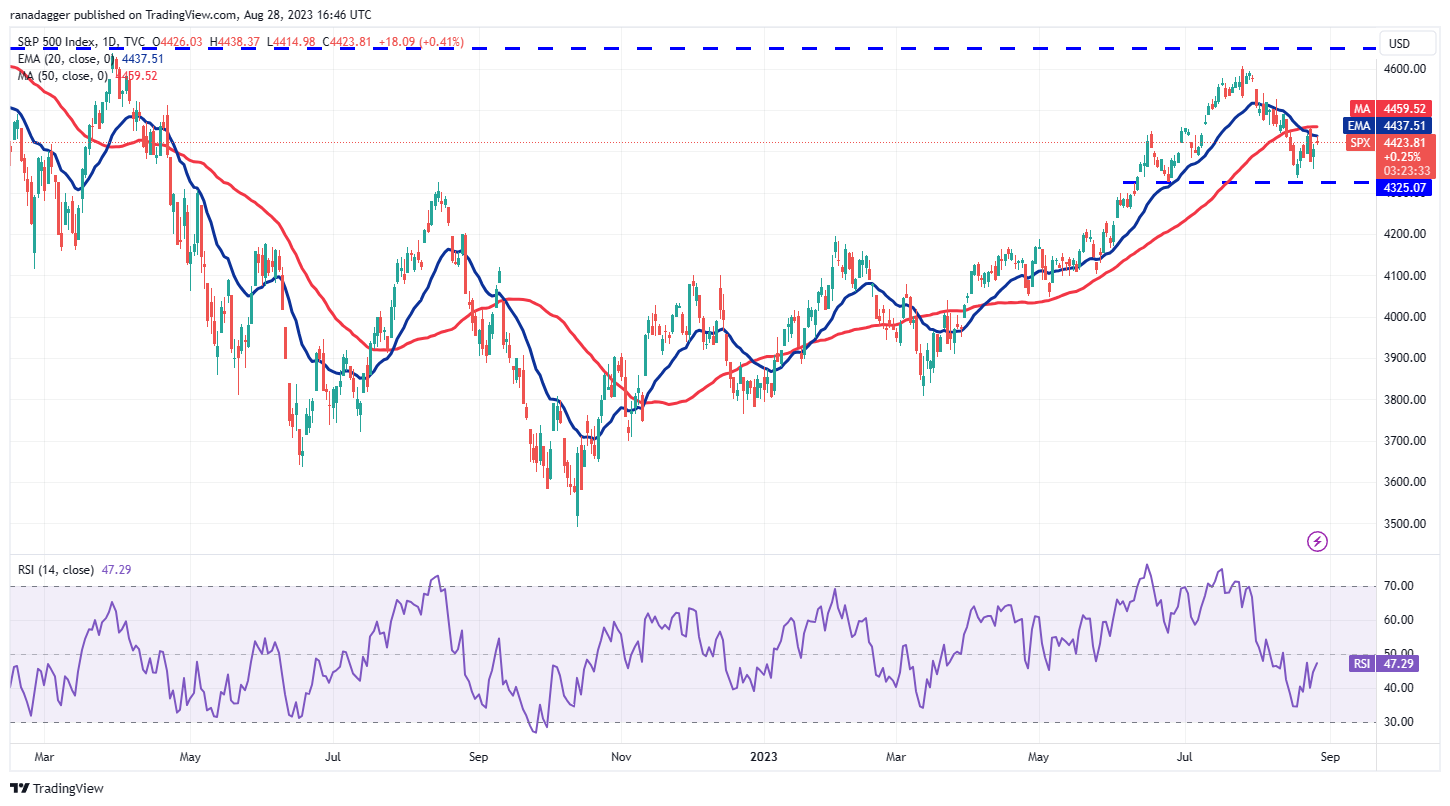 SPX daily chart. Source: TradingView
Following a recovery on Aug. 25, the bulls sustained their buying momentum and brought the index back to the moving averages. If buyers can surpass this obstacle, the index might rally to the resistance area between 4,607 and 4,650. This area is likely to see a fierce contest between the bulls and the bears.
If the price once again declines from the moving averages, it will indicate that bears are aggressively defending this level. The pair could then drop to the crucial support at 4,325. Should this level fail, the index will form a bearish head-and-shoulders pattern, potentially initiating a correction toward the target of 4,043.
U.S. Dollar Index price analysis
The bulls drove the U.S. Dollar Index (DXY) above the downtrend line on Aug. 22, suggesting that the current correction may soon conclude.
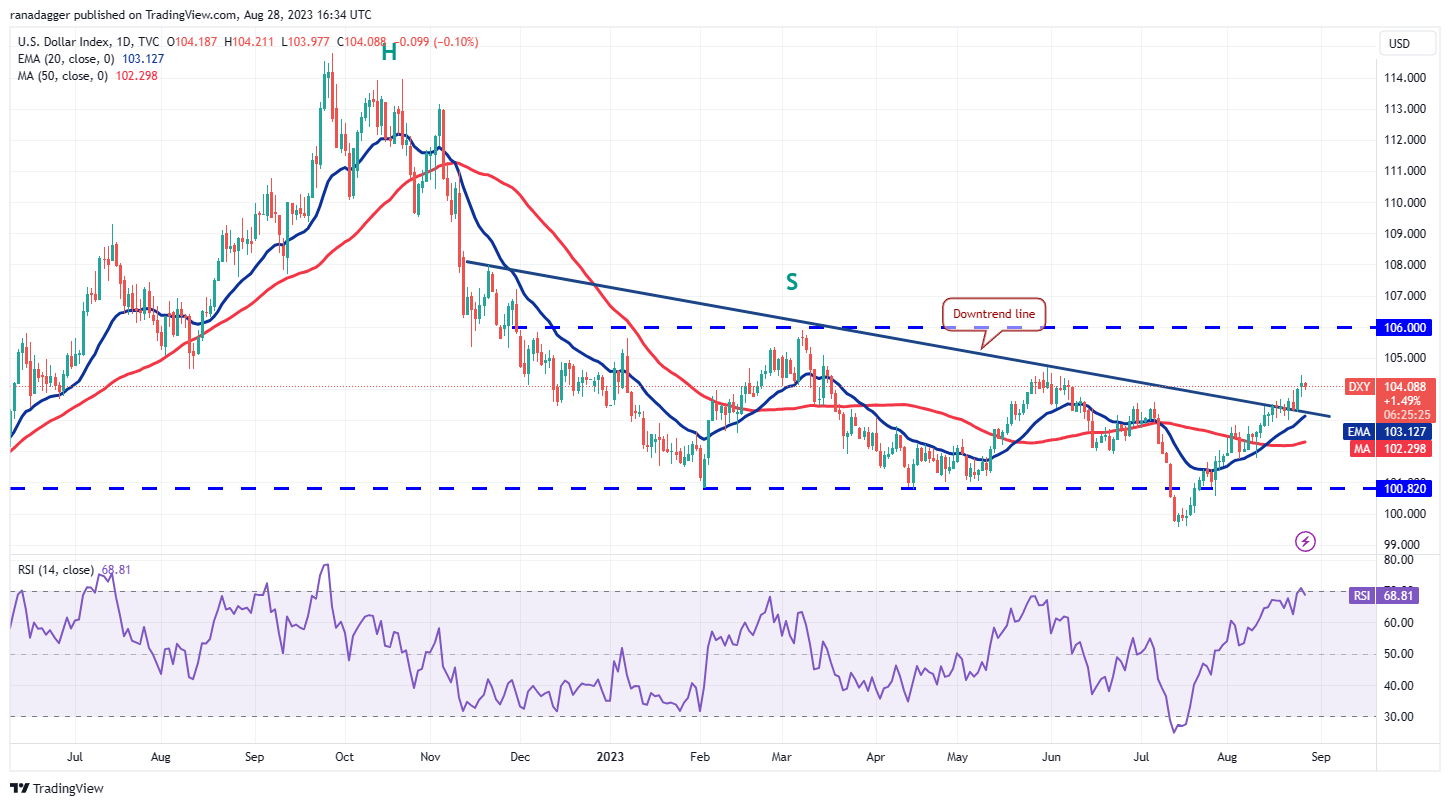 DXY daily chart. Source: TradingView
The bears attempted to pull the price back below this level on Aug. 23, but the bulls held firm. This indicates that the bulls have successfully converted the downtrend line into support.
The bulls will next aim to push the price to 106. The rising 20-day exponential moving average (EMA) at 103 and the relative strength index (RSI) nearing overbought levels suggest a favorable position for buyers.
If bears wish to make a comeback, they will need to swiftly pull the price back below the downtrend line. If successful, the index could slide to the 50-day simple moving average (SMA) of 102.
Bitcoin price analysis
Neither the bulls nor the bears are making significant moves as Bitcoin continues to trade within the range of $24,800 and $26,833.
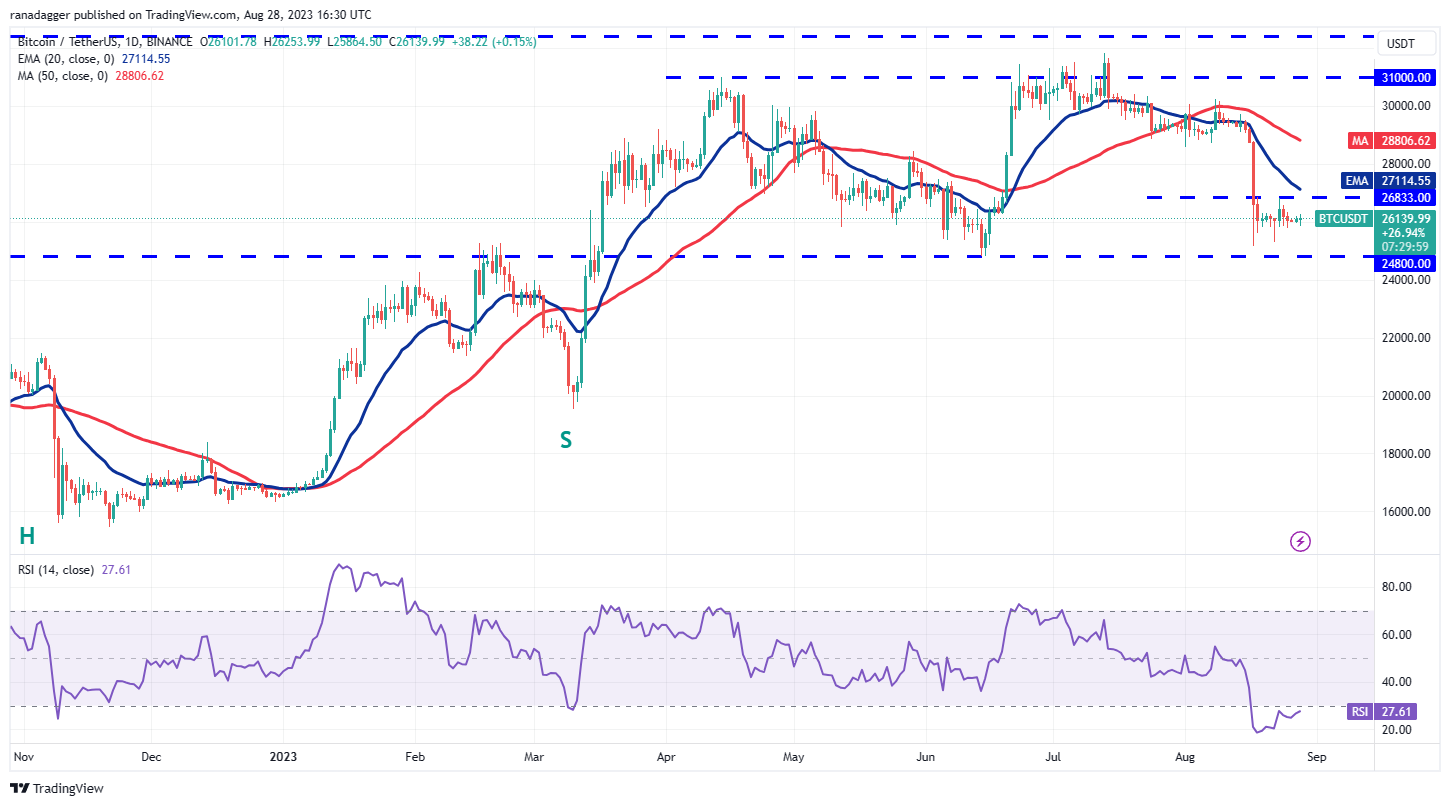 BTC/USDT daily chart. Source: TradingView
The declining moving averages and the RSI in the oversold territory indicate that bears are in control. However, sellers may struggle to continue the downward trajectory as the bulls are likely to defend the $24,800 level vigorously.
If the price rebounds from the support, it will suggest that the BTC/USDT pair may remain in consolidation for a while longer. On the upside, a break above $26,833 would be the first indication of strength, potentially pushing the price toward the 50-day SMA ($28,806) and eventually to $30,000.
Conversely, a break and close below the $24,800 support could trigger the next phase of the downtrend to $20,000.
Ether price analysis
Ether (ETH) has been hovering near the critical support level at $1,626, signifying that bears have maintained their selling pressure.
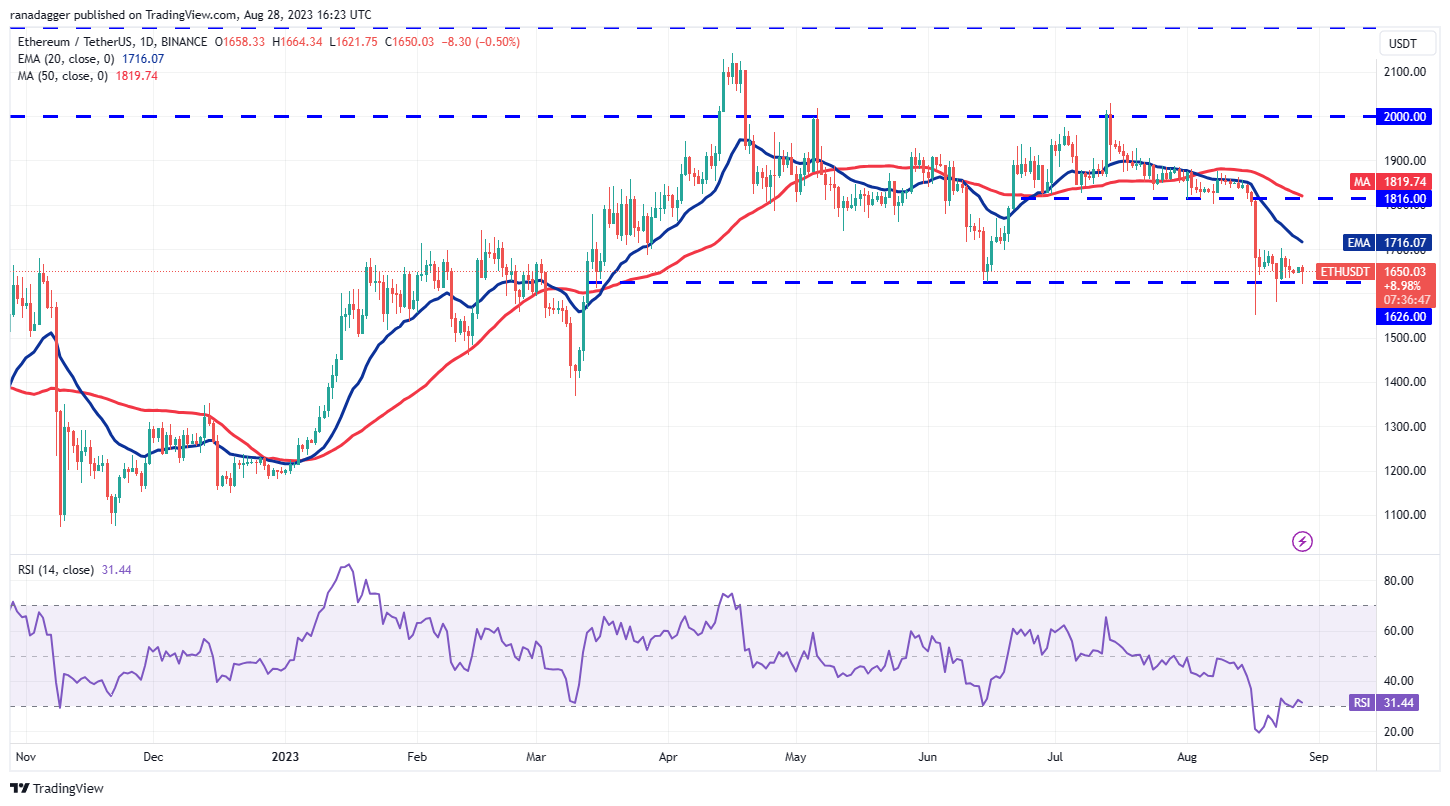 ETH/USDT daily chart. Source: TradingView
The bulls’ inability to initiate a robust rebound heightens the risk of a breakdown below $1,626. Should this occur, the ETH/USDT pair might plummet to $1,550, a level that could attract significant buying from the bulls.
If the price rebounds from this level but then fails at $1,626, it will indicate that bears have turned this level into resistance, potentially initiating a downtrend toward $1,368. The bulls need to push the price above the 20-day EMA ($1,716) to signal a recovery.
BNB price analysis
BNB’s (BNB) pullback is encountering selling pressure at the breakdown level of $220, indicating that bears are attempting to convert this level into resistance.
Related Posts
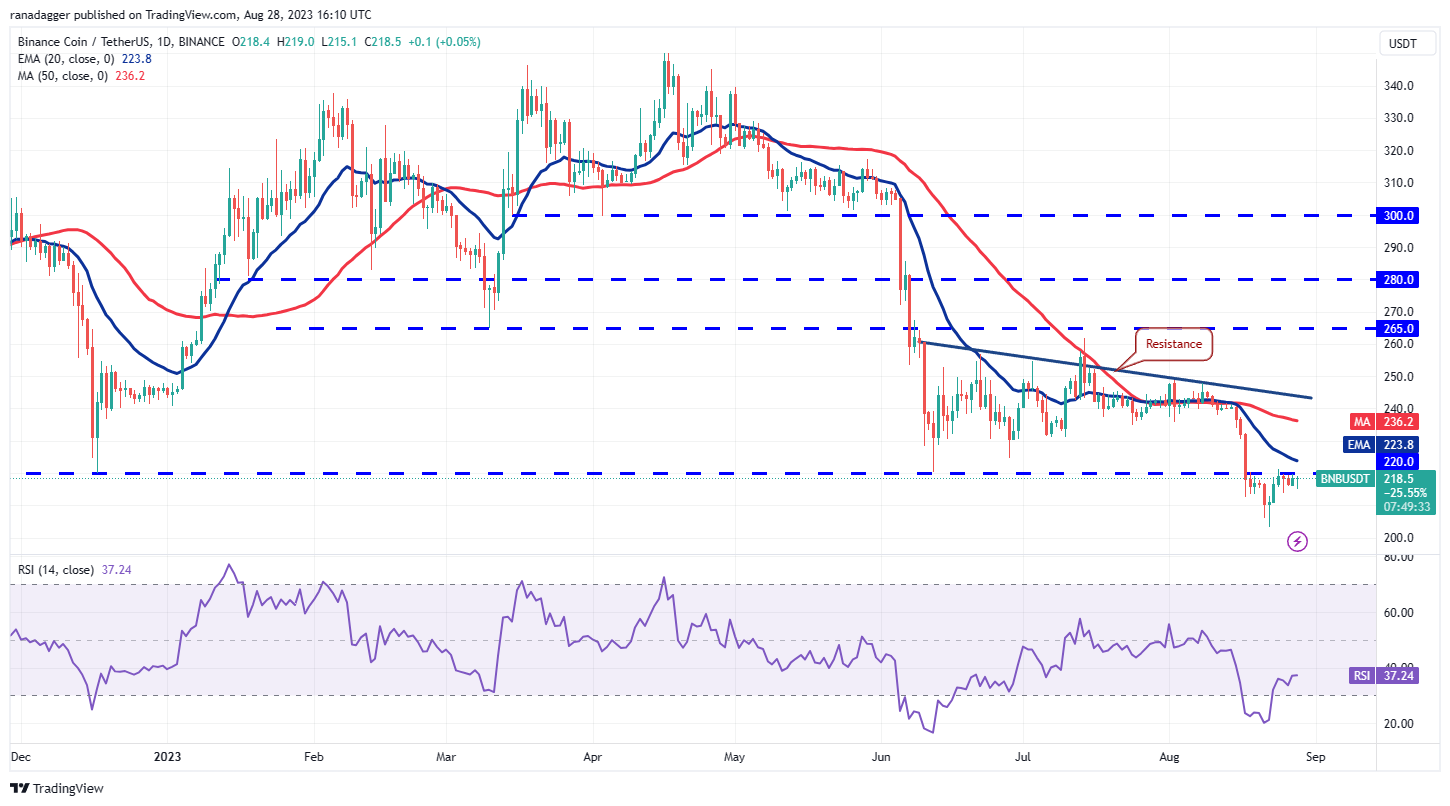 BNB/USDT daily chart. Source: TradingView
A minor positive development for the bulls is that they have not surrendered much ground from $220, suggesting that buyers are maintaining their pressure. To initiate a relief rally to the resistance line, bulls must overcome the barrier at the 20-day EMA ($223). This level may again face substantial selling from the bears.
The initial support on the downside is at $213. If this level fails, the BNB/USDT pair could fall to psychological support at $200. A breach below this level may extend the decline to the next significant support at $183.
XRP price analysis
The bulls’ inability to push XRP (XRP) to the overhead resistance at $0.56 indicates a lack of demand at higher levels.
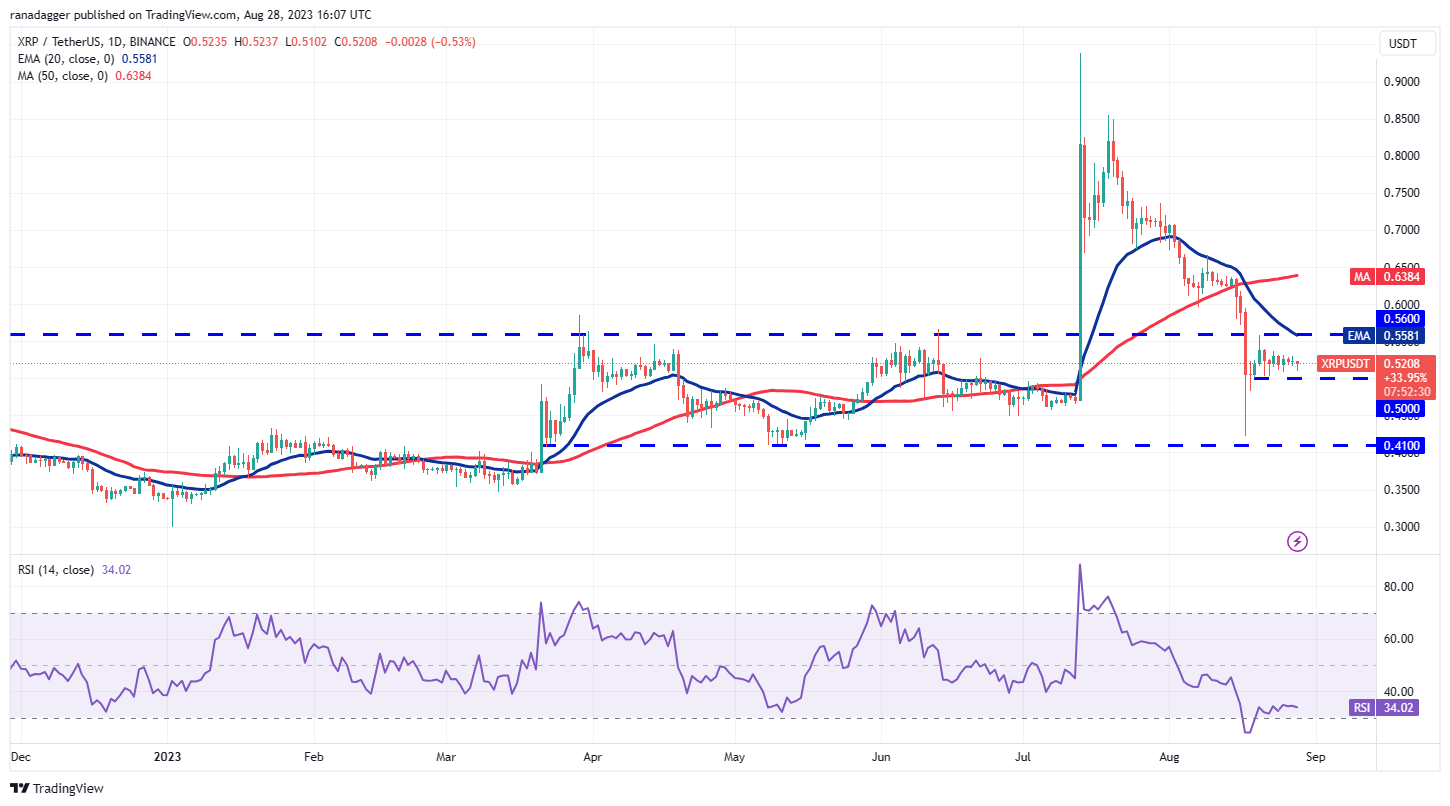 XRP/USDT daily chart. Source: TradingView
The weak rebound from $0.50 may provoke aggressive selling by the bears. If the $0.50 support is breached, the XRP/USDT pair could decline to the critical support level at $0.41, which could see strong buying from the bulls. If the price rebounds from this support, it will suggest that the pair may oscillate between $0.41 and $0.56 for a few more days.
In contrast, if the price rises and breaks above $0.56, it will indicate the commencement of a sustained recovery, potentially allowing the pair to ascend to the 50-day SMA ($0.64).
Cardano price analysis
Cardano (ADA) has been fluctuating within the tight range of $0.24 and $0.28 over the past few days, indicating that bulls are purchasing near the support while bears are selling at the resistance.
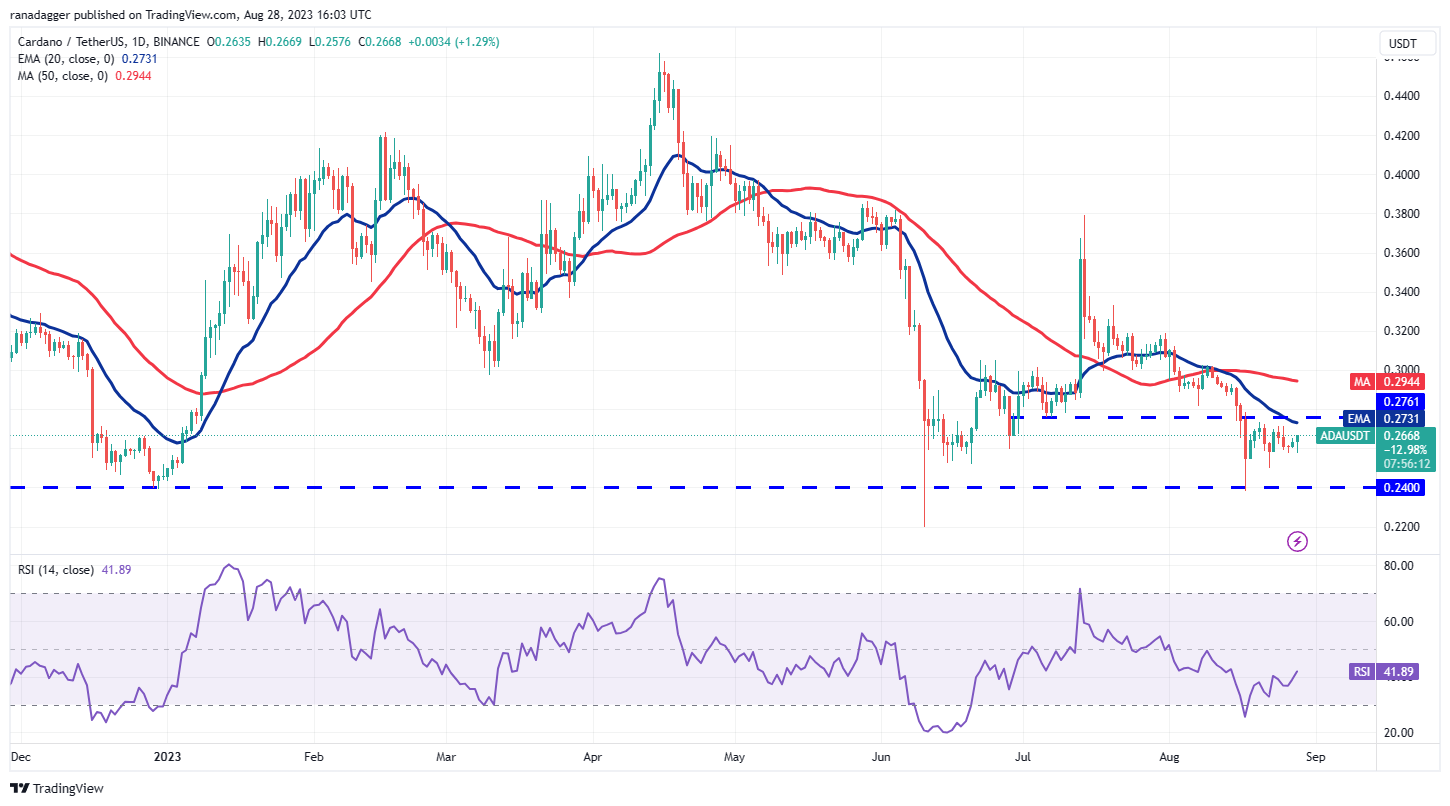 ADA/USDT daily chart. Source: TradingView
If buyers manage to push the price above the overhead resistance at $0.28, the ADA/USDT pair could initiate a rally towards the 50-day SMA ($0.29). This level may act as a barrier, but if surpassed, the pair could surge to $0.34.
However, the bears are likely to have different plans. They will attempt to defend the overhead resistance and drag the price down to the range support at $0.24. If this level breaks, the pair may tumble to $0.22 and eventually to $0.20.
Related: Bitcoin traders pinpoint support levels as BTC price taps $26.2K
Dogecoin price analysis
Dogecoin (DOGE) has been trading between the strong support at $0.06 and the 20-day EMA ($0.07) in recent days.
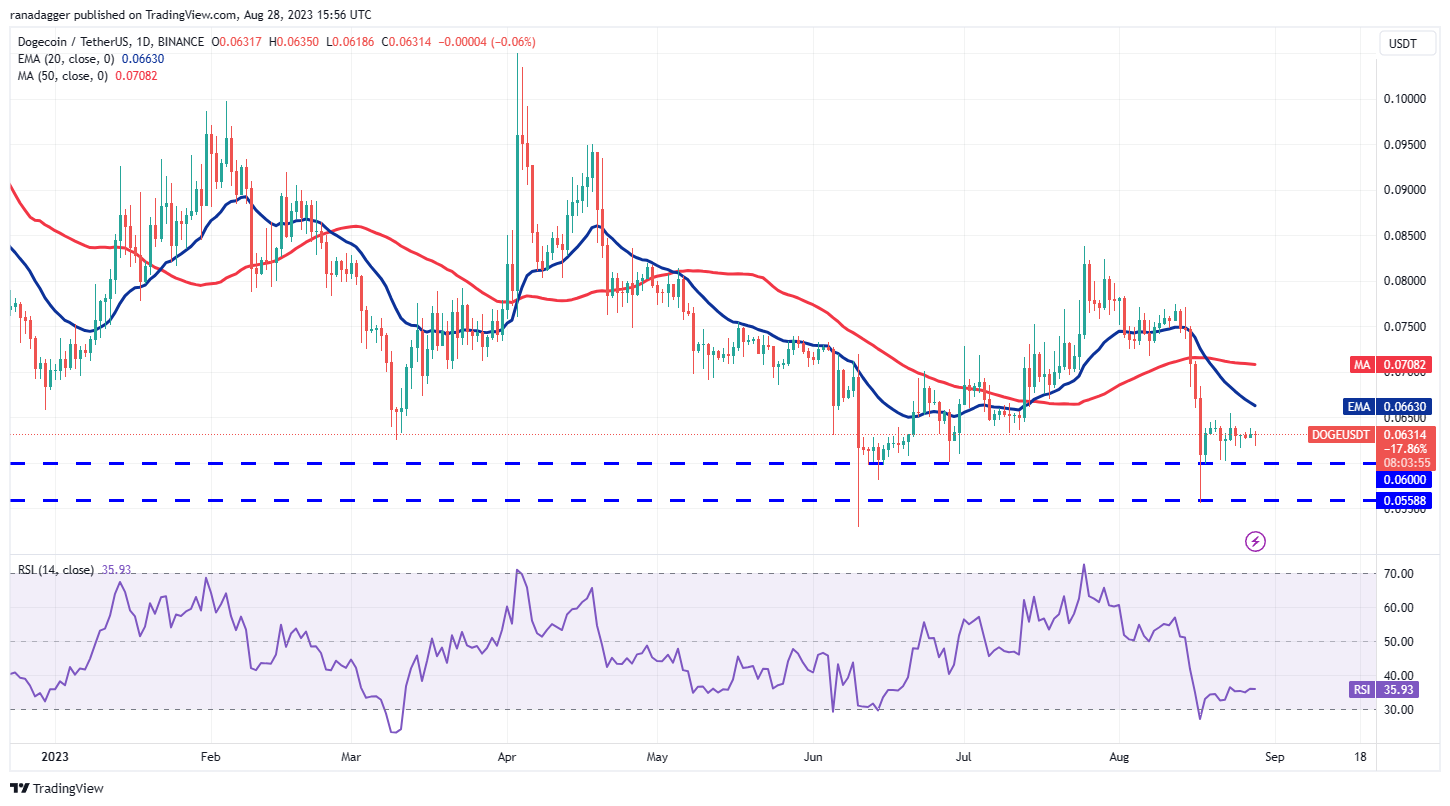 DOGE/USDT daily chart. Source: TradingView
The 20-day EMA is declining, and the RSI is in the negative zone, suggesting that bears have the advantage. Sellers will aim to push the price below $0.06 to further strengthen their position.
The time is critical for the bulls. If they wish to initiate a recovery, they must quickly propel the price above the 20-day EMA. If they succeed, the DOGE/USDT pair could rise to the 50-day SMA ($0.07) and subsequently jump to $0.08.
Solana price analysis
Solana (SOL) has been gradually declining, indicating that bears are ready to capitalize on every minor relief rally.
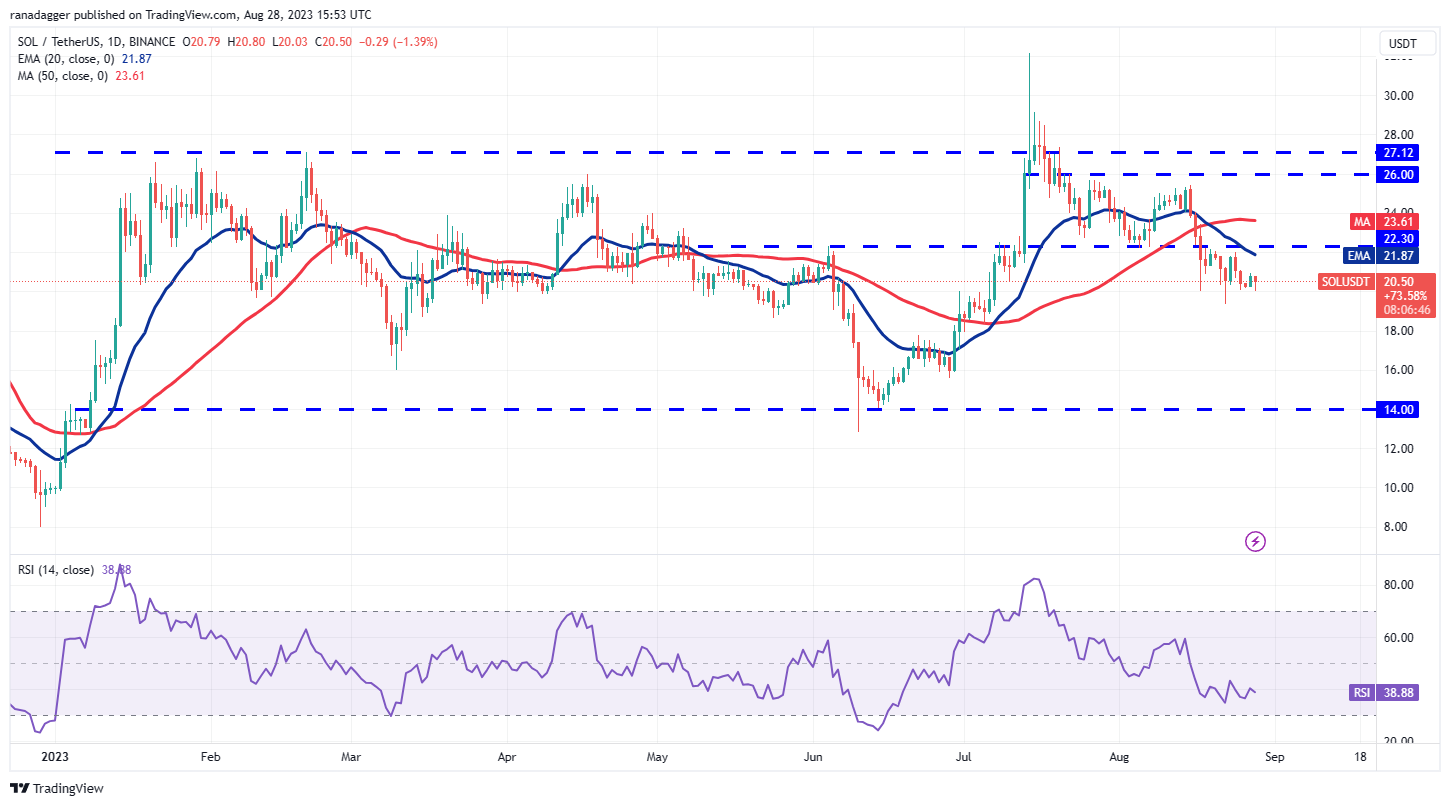 SOL/USDT daily chart. Source: TradingView
The SOL/USDT pair could decrease to the Aug. 22 intraday low of $19.35. If that level fails, selling could escalate, and the pair may plummet to $18 and eventually to the next significant support at $15.60.
Conversely, if the price rebounds and breaks above $22.30, it will indicate strong buying interest at lower levels. The pair may first rise to the 50-day SMA ($23.61) and subsequently to the strong resistance at $26.
Polkadot price analysis
The bulls are attempting to push Polkadot (DOT) above the overhead resistance at the 20-day EMA ($4.64), but they are likely to face significant resistance from the bears.
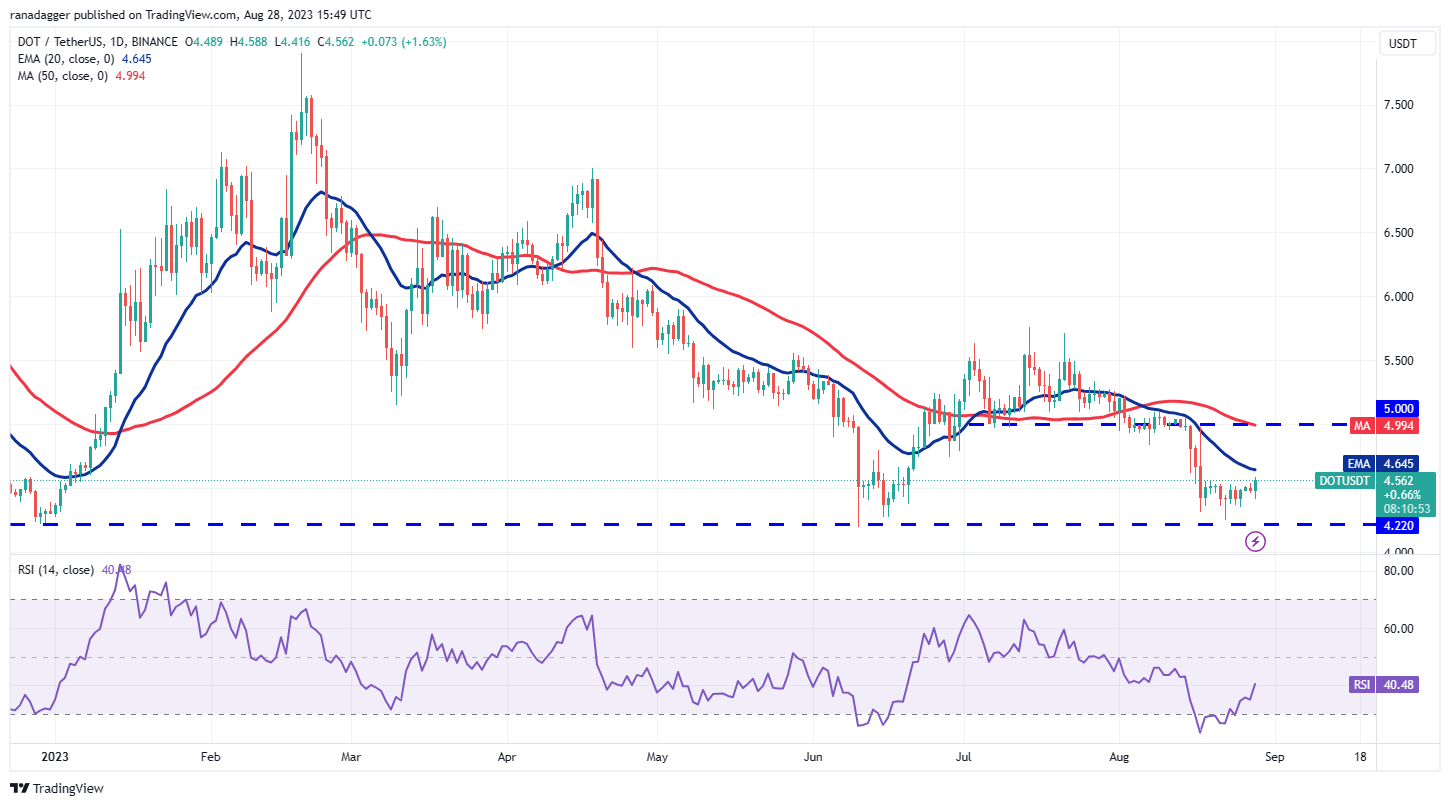 DOT/USDT daily chart. Source: TradingView
If the price declines from the 20-day EMA, it will indicate that the sentiment remains negative and that traders are selling on rallies. This could heighten the chances of a retest of the critical support at $4.22. If this support gives way, the DOT/USDT pair may fall to $4 and later to $3.88.
On the flip side, if buyers manage to push the price above the 20-day EMA, it will signify the beginning of a stronger relief rally towards the breakdown level of $5, which may again attract selling from the bears.
This article does not contain investment advice or recommendations. Every investment and trading move involves risk, and readers should conduct their own research when making a decision.