Disclaimer: Information found on CryptoreNews is those of writers quoted. It does not represent the opinions of CryptoreNews on whether to sell, buy or hold any investments. You are advised to conduct your own research before making any investment decisions. Use provided information at your own risk.
CryptoreNews covers fintech, blockchain and Bitcoin bringing you the latest crypto news and analyses on the future of money.
Bitcoin continues to perplex investors with its narrow-range consolidation, providing no indication of a potential breakout direction. Generally, the longer the consolidation period, the more significant the eventual breakout. As a result, traders should remain vigilant to capitalize on the breakout when it occurs.
A slight advantage for the bulls is their retention of a substantial portion of the gains achieved in 2023. This suggests a lack of urgency among the bulls to realize profits, as they expect the upward trend to continue.
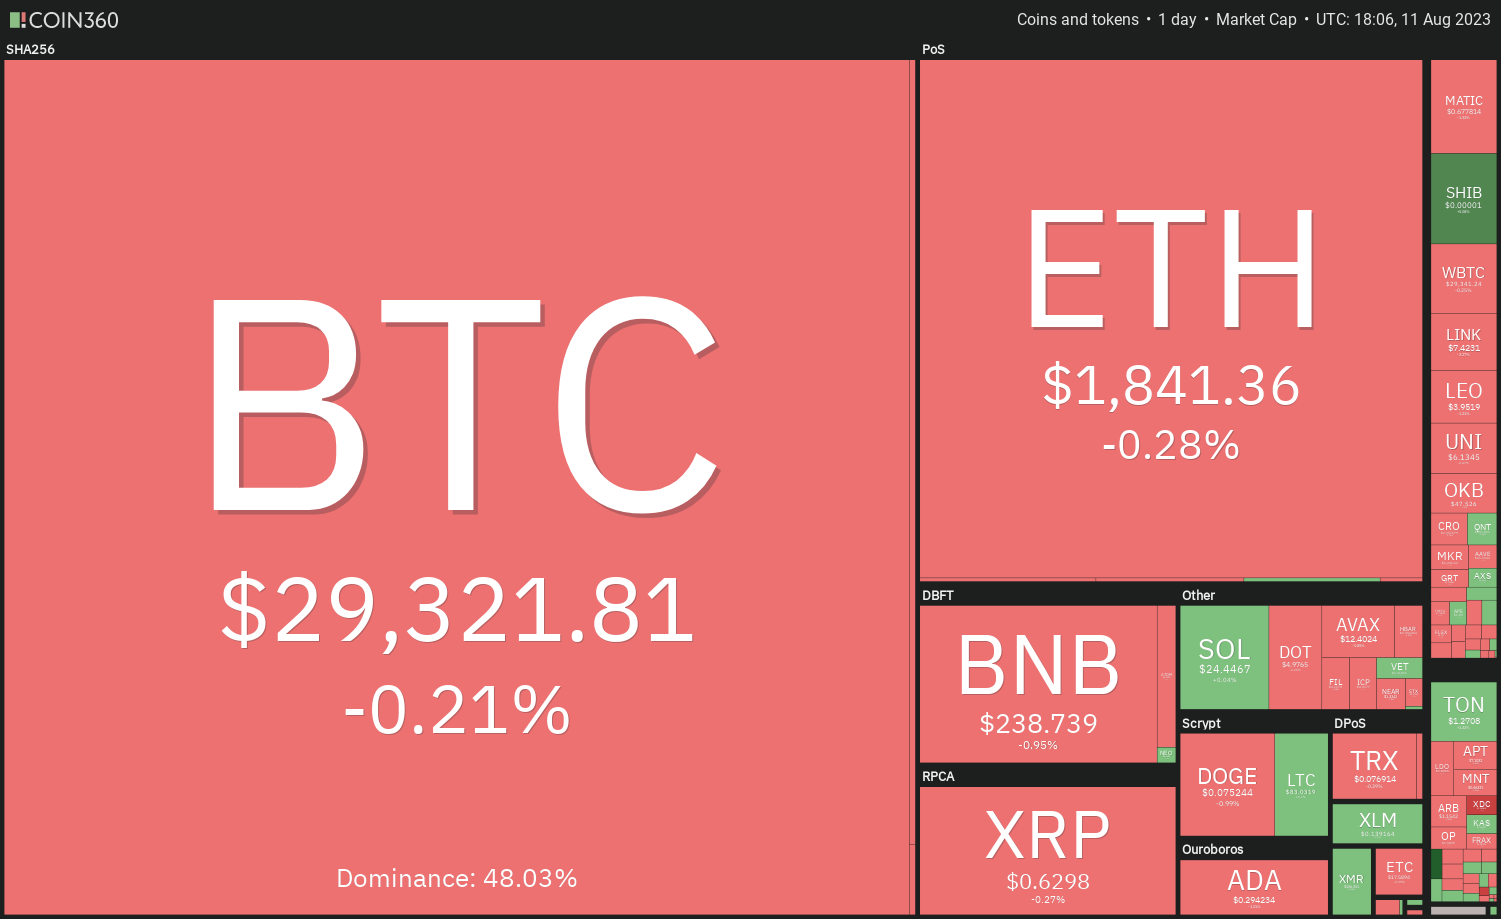 Daily cryptocurrency market performance. Source: Coin360
Bloomberg’s senior exchange-traded fund (ETF) analyst Eric Balchunas noted that 15 of the top-performing equity ETFs in 2023 are related to cryptocurrencies, with exposure to crypto and blockchain.
Do Bitcoin (BTC) and select altcoins exhibit any indications of a potential breakout from their respective ranges? Let’s analyze the charts of the top 10 cryptocurrencies to determine.
Bitcoin price analysis
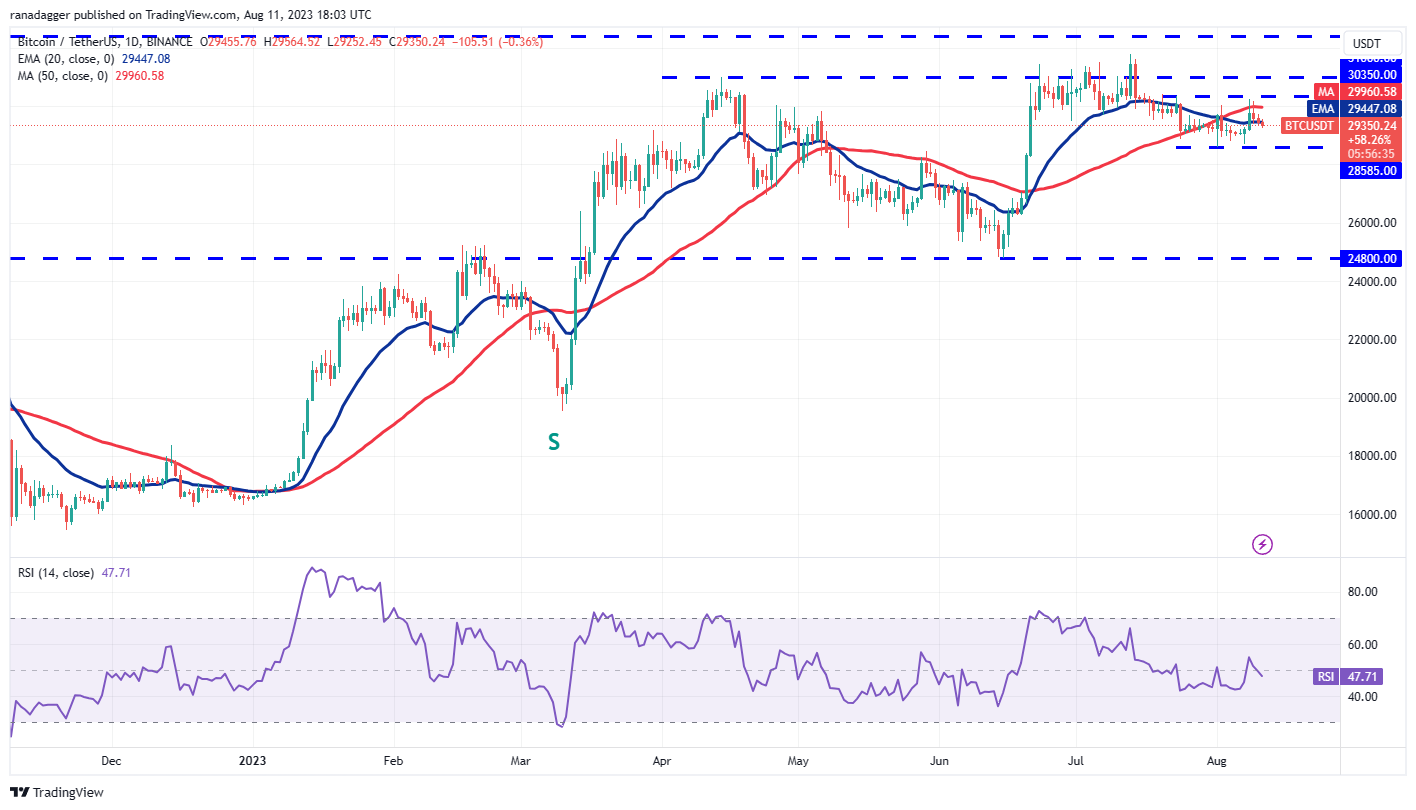
The bulls managed to push Bitcoin above the 50-day simple moving average (SMA) of $29,960 on August 8 and 9, but were unable to maintain those higher levels. This indicates that the bears are selling during rallies.
 BTC/USDT daily chart. Source: TradingView
The range in the BTC/USDT pair has further contracted, with prices oscillating between $28,585 and $30,350. Both moving averages have leveled off, and the relative strength index (RSI) is near the midpoint, indicating that consolidation may persist for a while longer.
When the price is confined within a range, predicting the breakout direction becomes challenging. Nevertheless, traders should be prepared for the onset of a trending movement soon.
If the price falls below $28,585, the pair may decline to $26,000 and subsequently to $24,800. In contrast, a break and close above $30,350 could drive the pair up to $32,400. This level is likely to be the final obstacle before the pair approaches $40,000.
Ether price analysis
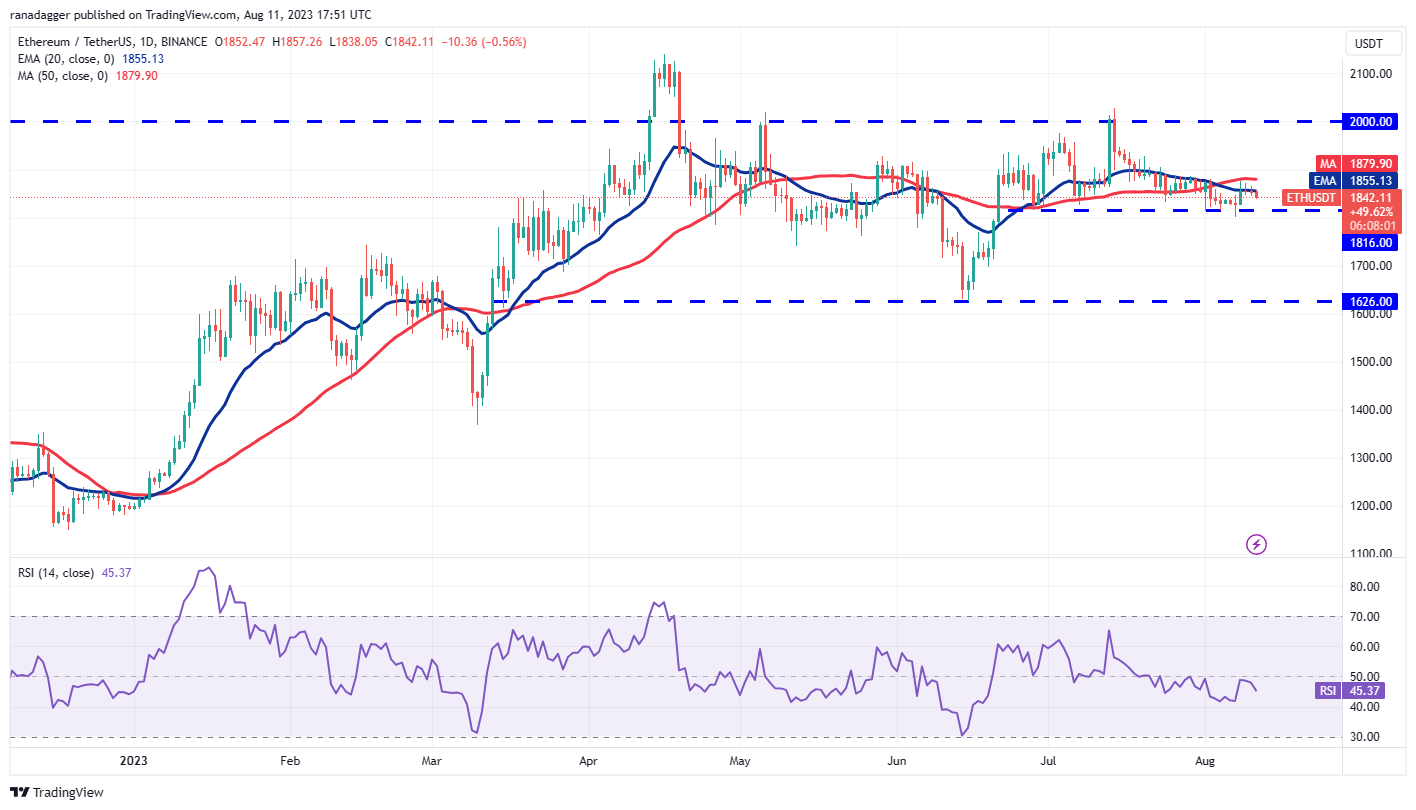
Ether (ETH) has been fluctuating between the 50-day SMA ($1,879) and the horizontal support at $1,816 for several days. This indicates indecision between the bulls and bears regarding the next directional move.
 ETH/USDT daily chart. Source: TradingView
The flat 20-day exponential moving average (EMA) at $1,855 and the RSI just below the midpoint do not provide a clear advantage to either the bulls or the bears. Sellers will need to pull the price below $1,816 to gain control, which could initiate a sell-off that may drive the ETH/USDT pair down to $1,700 and then to the crucial support at $1,626.
Conversely, if the price rises and breaks above the 50-day SMA, it could pave the way for a rally to the psychological resistance at $2,000.
BNB price analysis
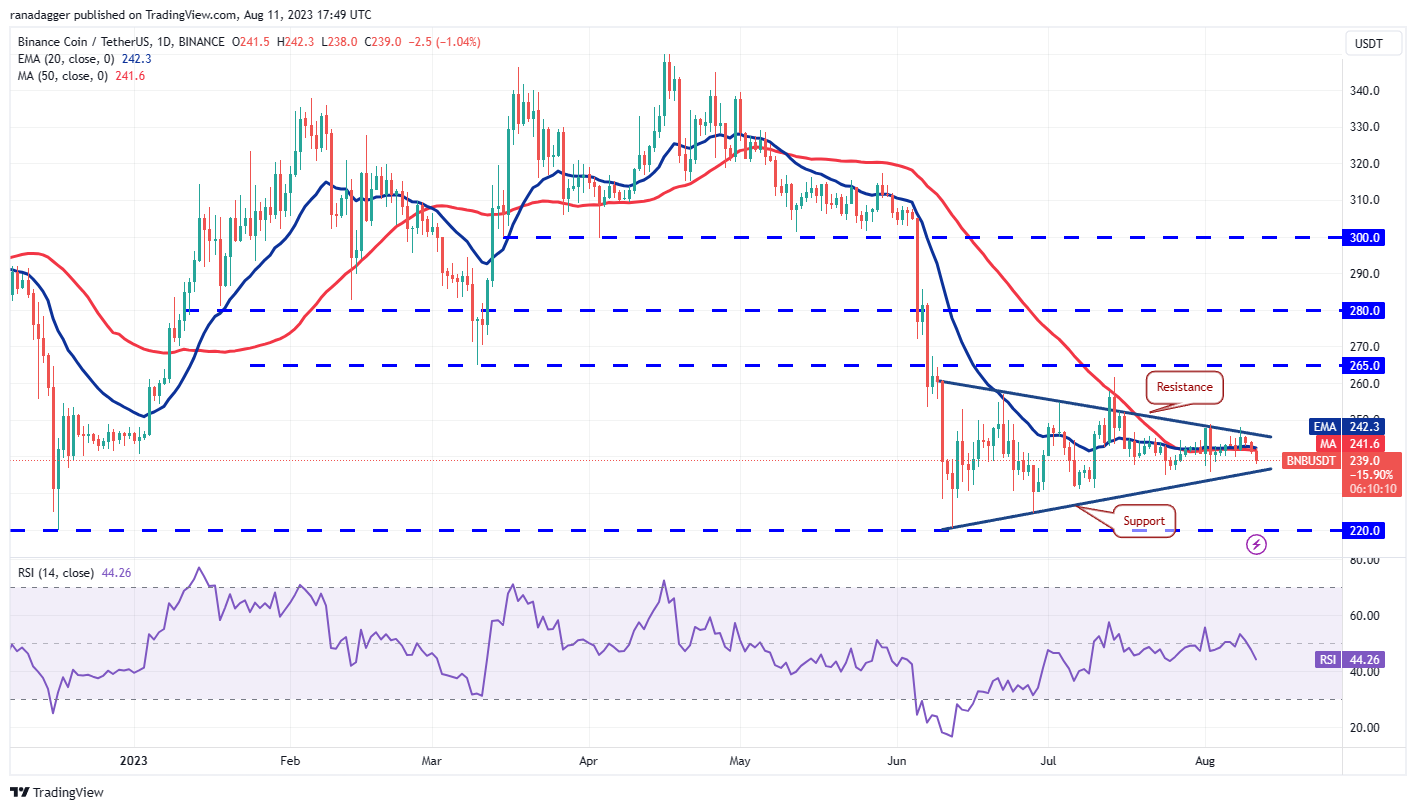
The inability to push BNB (BNB) above the resistance line of the triangle may have triggered selling, pulling the price below the moving averages.
 BNB/USDT daily chart. Source: TradingView
The BNB/USDT pair could decline to the support line of the triangle. This is a critical level to monitor, as a drop below it may initiate the next phase of the downward trend to $220. The bulls are likely to buy the dip at this level.
If the price rebounds from the support line, the pair may remain within the triangle for a while longer. Buyers will need to push the price above the resistance line to clear the way for a potential rally to $265.
XRP price analysis
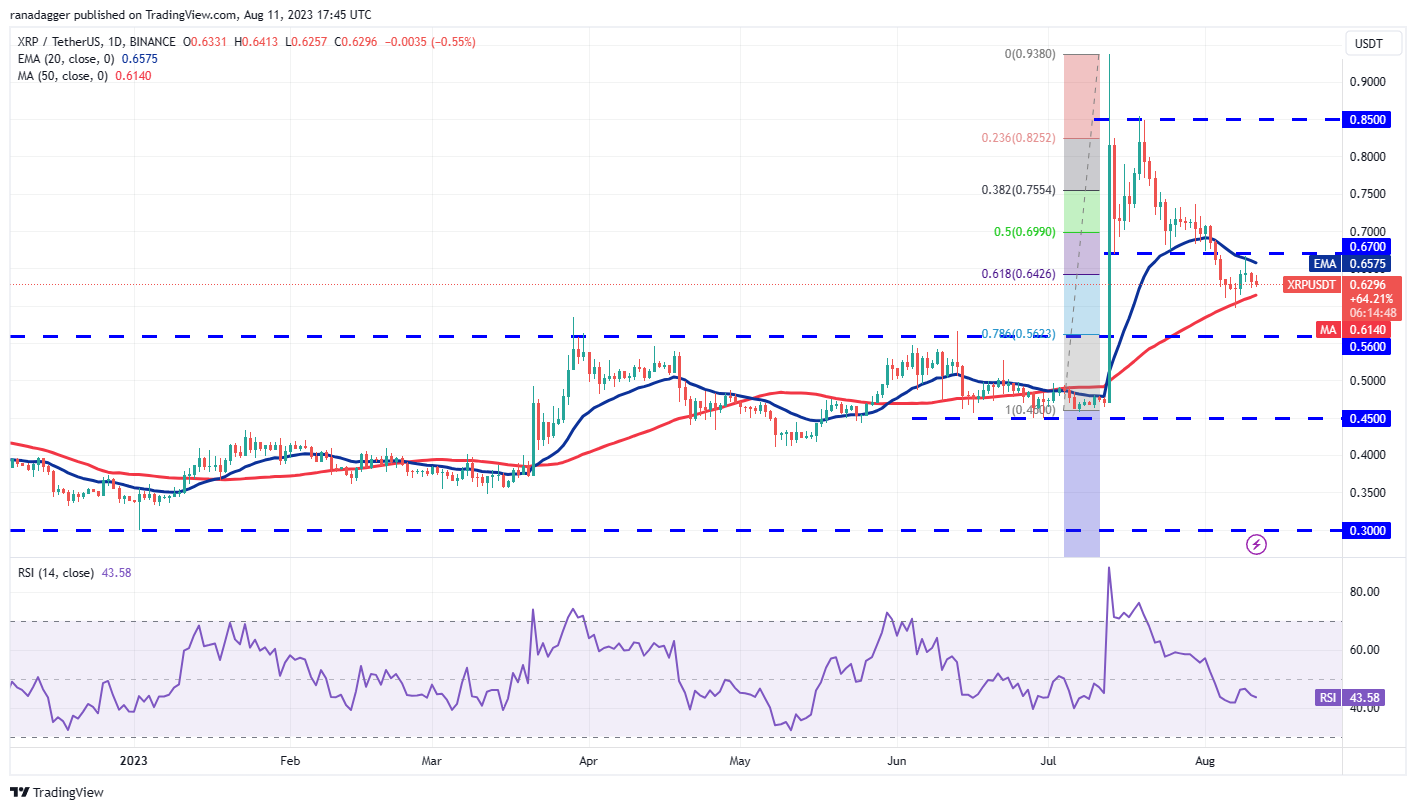
XRP (XRP) declined from the 20-day EMA ($0.65) on August 9, indicating that the bears are attempting to convert this level into resistance.
 XRP/USDT daily chart. Source: TradingView
The key support to monitor on the downside is the 50-day SMA ($0.61). If this level is breached, selling pressure could increase, and the XRP/USDT pair may plummet to the breakout level of $0.56.
Alternatively, if the price bounces off the 50-day SMA, the pair may oscillate between the moving averages for a while. A break and close above $0.67 would be the first indication of strength, potentially leading to a rally to $0.73.
Dogecoin price analysis
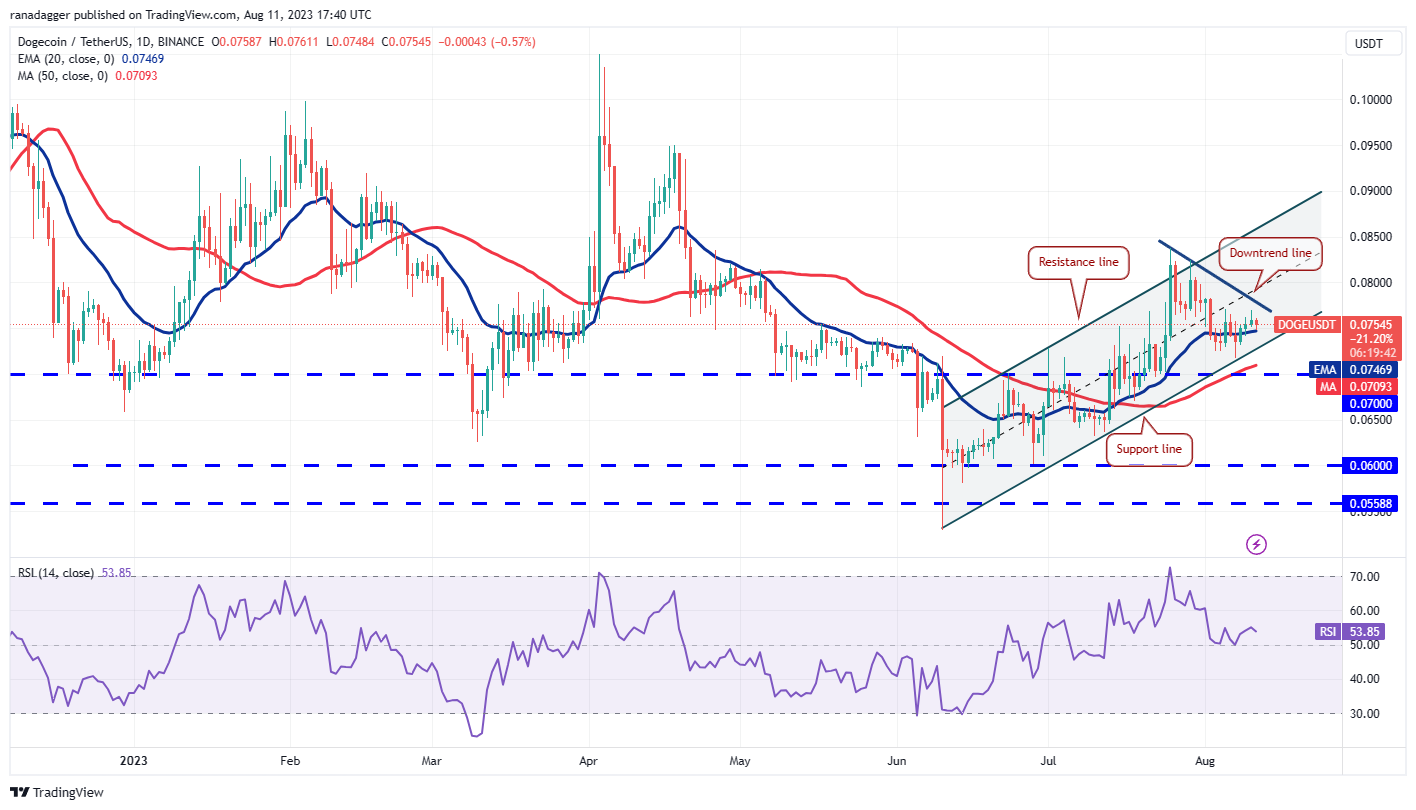
Dogecoin (DOGE) continues to trade within the ascending channel pattern, but the bulls are struggling to surpass the barrier at the downtrend line.
 DOGE/USDT daily chart. Source: TradingView
Related Posts
If the price falls below the 20-day EMA ($0.07), the support line of the channel will be at risk. Frequent retests of a support level within a short timeframe tend to weaken it. If the bears pull the price below the channel, the DOGE/USDT pair could decline to the breakout level of $0.07.
Another scenario is that the price rebounds from the 20-day EMA. If this occurs, the chances of a rally above the downtrend line increase, potentially initiating an upward movement to $0.08 and then to the resistance line of the channel.
Cardano price analysis
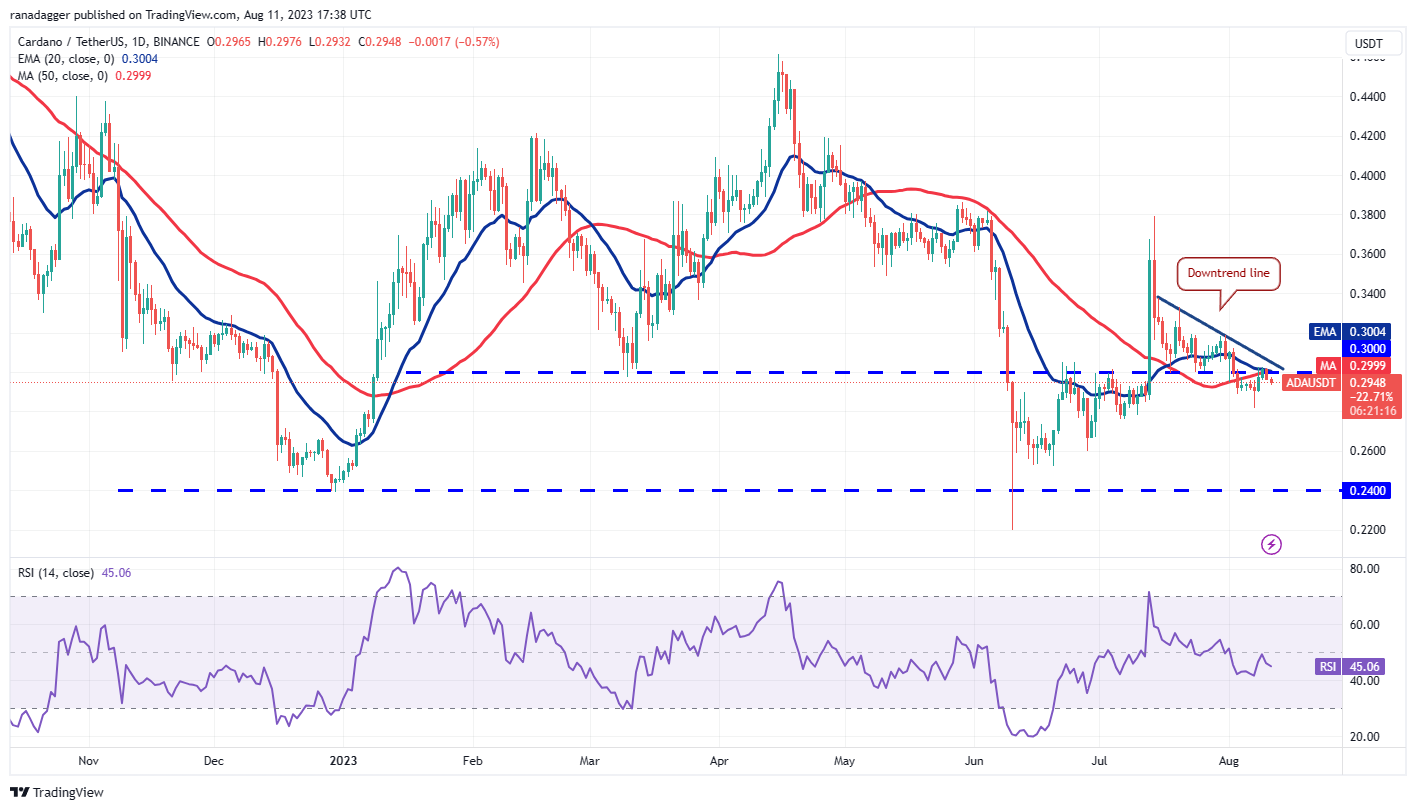
Cardano’s (ADA) recovery attempt faced resistance at the 20-day EMA ($0.30), indicating that the bears are still active and selling during rallies.
 ADA/USDT daily chart. Source: TradingView
The flat 20-day EMA and the RSI just below the midpoint do not provide a clear advantage to either the bulls or the bears. If buyers manage to push the price above the downtrend line, the ADA/USDT pair could rise to $0.32 and then to $0.34.
Conversely, if the price declines and breaks below $0.28, it will indicate that the bears have taken control. The pair could then fall to $0.26 and eventually to the critical support at $0.24. The bulls are expected to defend this level vigorously.
Solana price analysis
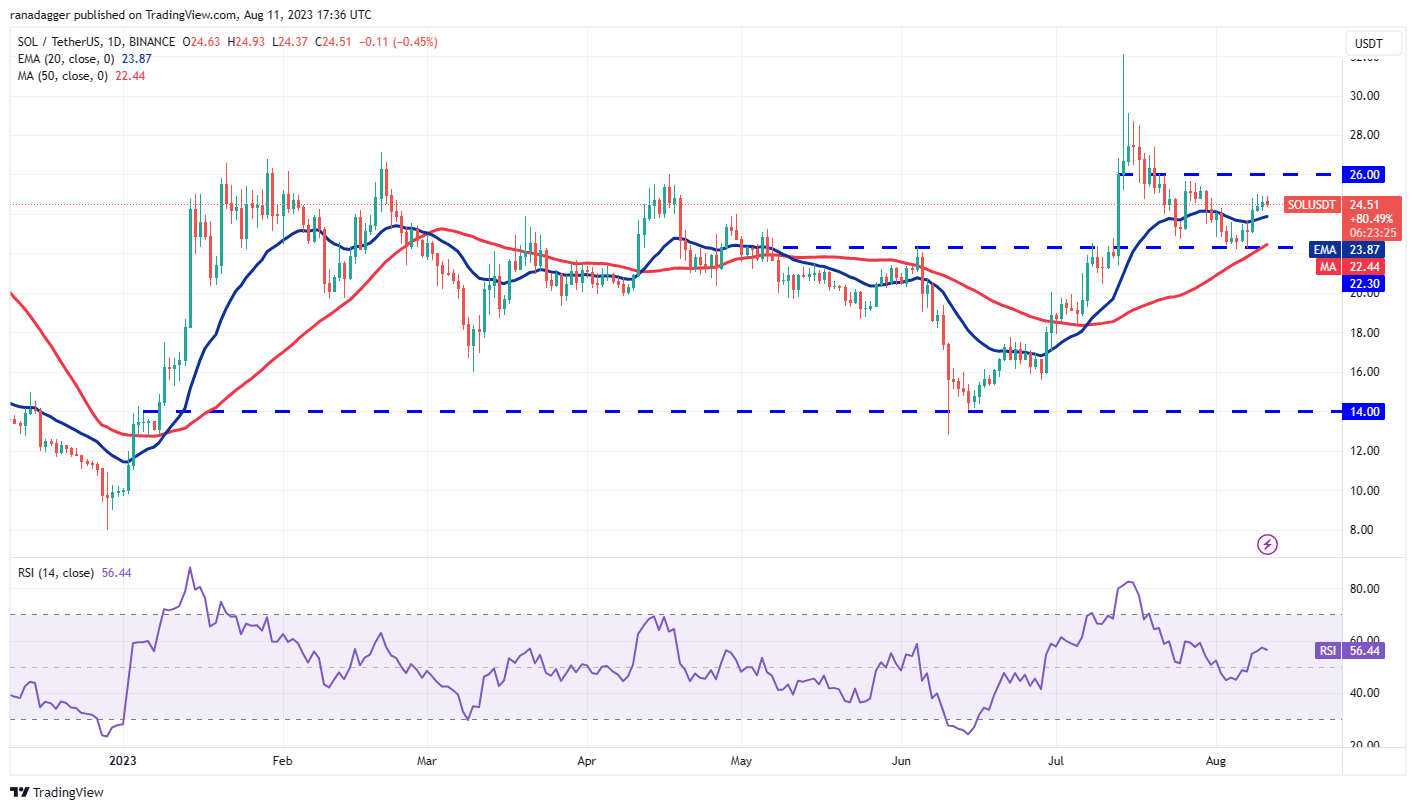
Solana (SOL) has been trading above the 20-day EMA ($23.87) for the last three days, indicating that the price is caught between $26 and $22.30.
 SOL/USDT daily chart. Source: TradingView
The key level to observe on the upside is $26. If the price retraces from this resistance, it will suggest that the range-bound action remains intact. Bullish momentum may increase if buyers overcome the overhead resistance at $26. If they succeed, the SOL/USDT pair could first rise to $29 and subsequently retest the local high at $32.13 reached on July 14.
The level to watch on the downside is $22.30. If this support fails, it may indicate that the bulls are retreating. This could initiate a decline to $18.
Related: Bitcoin trader reveals ‘important’ BTC price zone as bulls hold $29.3K
Polygon price analysis
The bulls were unable to push Polygon (MATIC) above the 50-day SMA ($0.70) in the last two days, but a positive aspect is that they have not relinquished much ground.
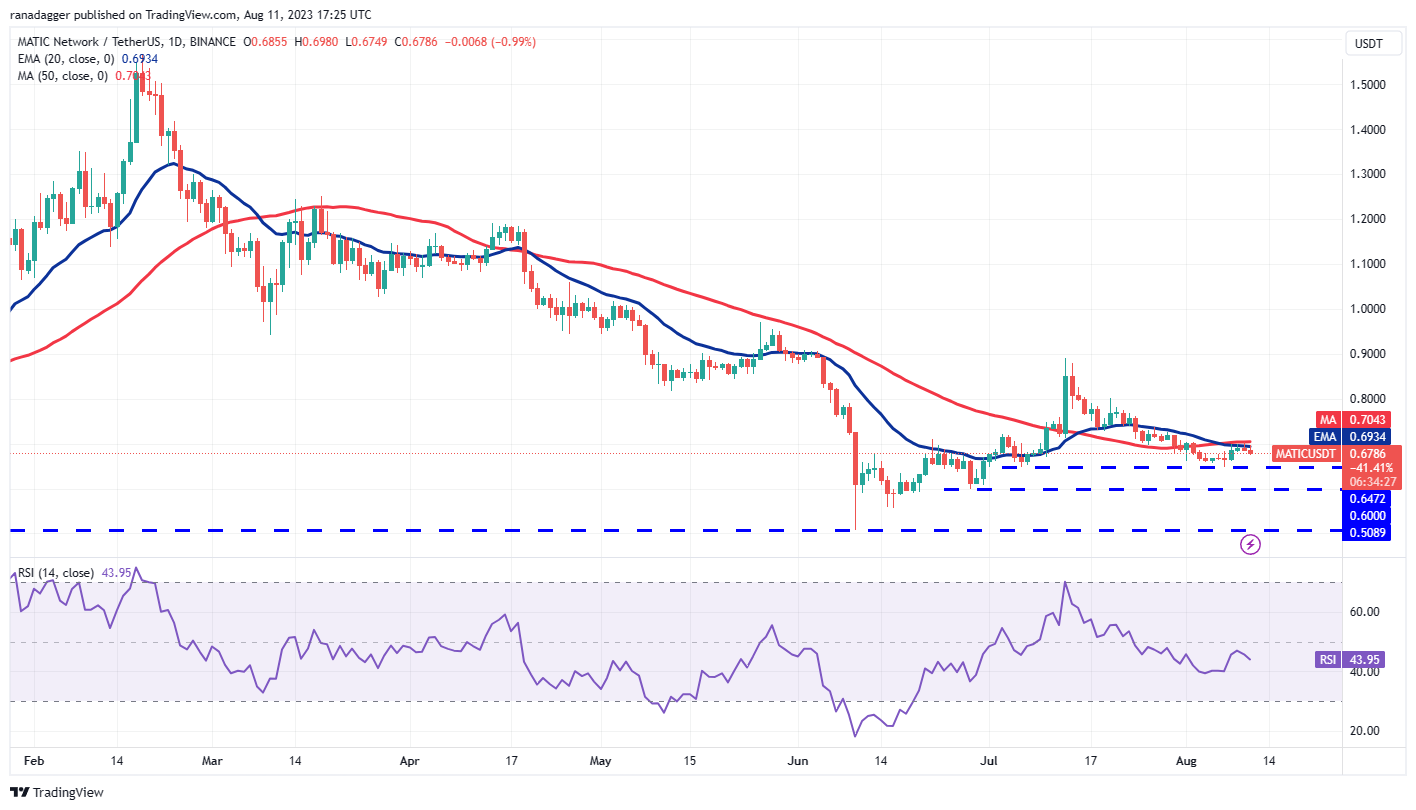 MATIC/USDT daily chart. Source: TradingView
This indicates that short-term bulls are maintaining their positions as they expect the relief rally to persist. If the 50-day SMA is surpassed, the MATIC/USDT pair could initiate a rally to $0.80 and then to $0.90.
In contrast, if the price sharply declines from the current level, the pair may retest the strong support at $0.64. If this level is breached, the pair may begin to decline to the next support at $0.60.
Litecoin price analysis
Litecoin (LTC) is finding it challenging to initiate a bounce off the strong support at $81.36, indicating a lack of demand at higher levels.
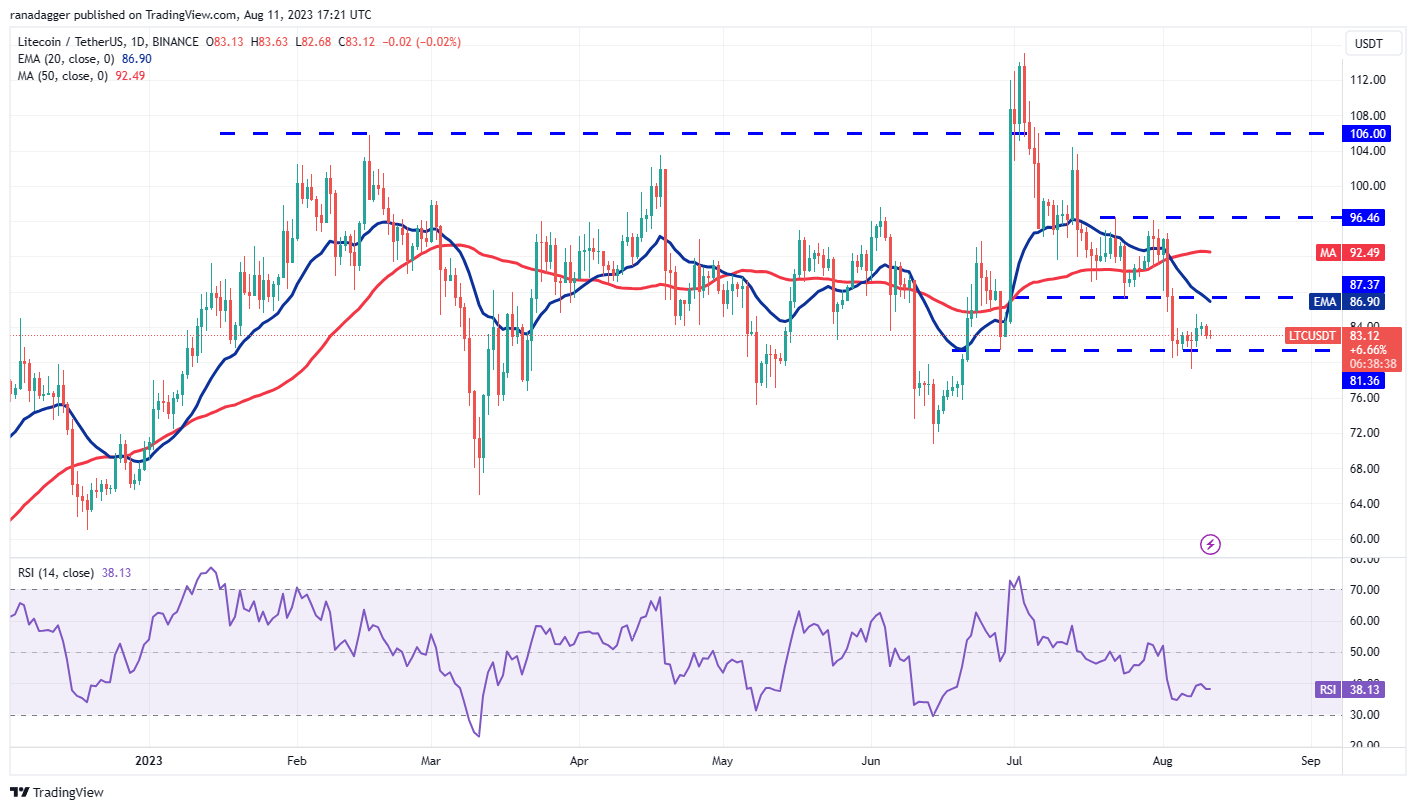 LTC/USDT daily chart. Source: TradingView
The declining 20-day EMA ($86.90) and the RSI in negative territory suggest that bears are in control. If the LTC/USDT pair falls and remains below $81.36, it will signal the continuation of the downtrend. The next support on the downside is $76, followed by $72.
On the other hand, the first significant resistance to monitor on the upside is the 20-day EMA. If buyers push the price above $87.37, it will indicate the beginning of a stronger recovery to $96.46. This level may again attract significant selling from the bears.
Polkadot price analysis
Polkadot (DOT) has been trading near the $5 mark for several days. Attempts by the bulls to push the price above the 20-day EMA ($5.08) on August 9 faced strong resistance from the bears.
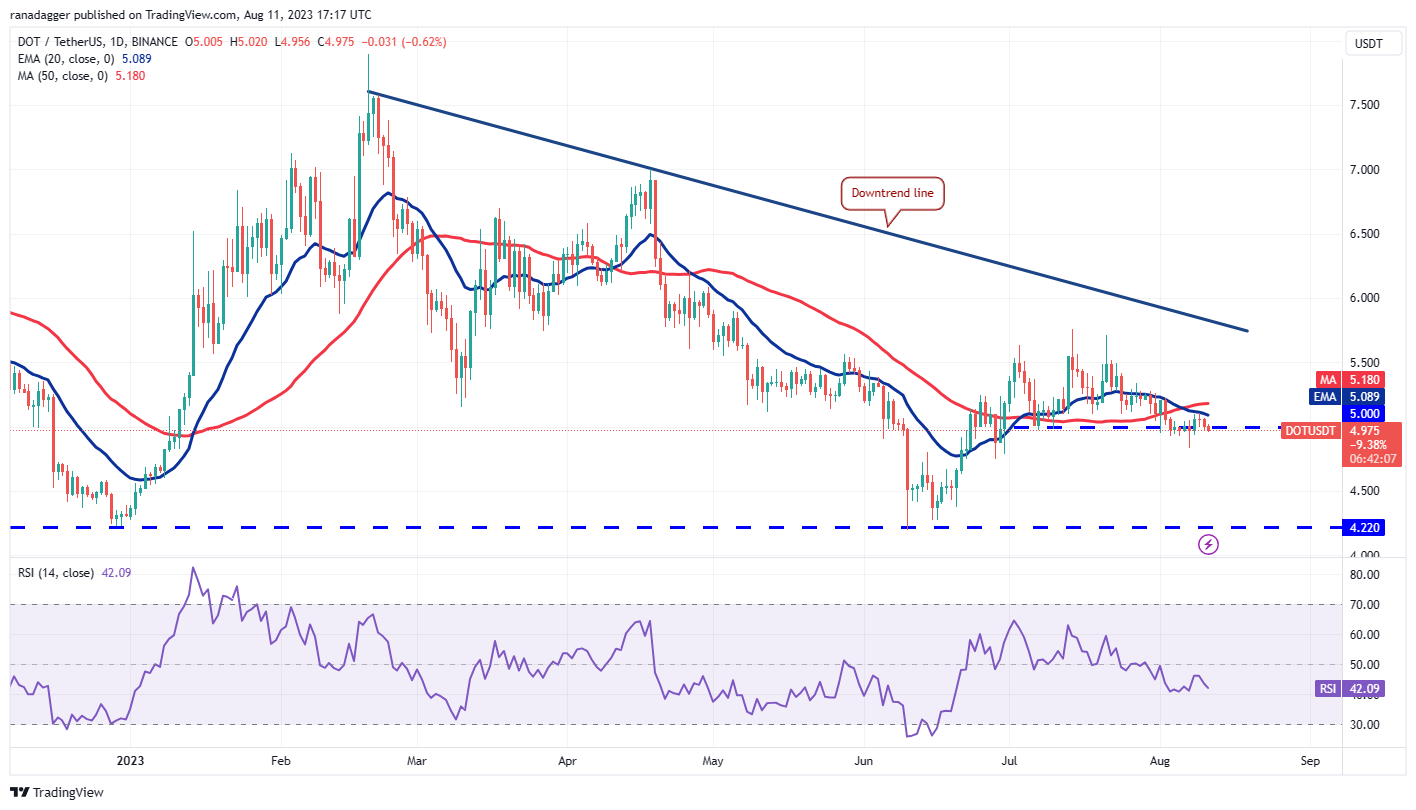 DOT/USDT daily chart. Source: TradingView
The 20-day EMA is gradually sloping downward, and the RSI has been in negative territory, indicating that the bears hold a slight advantage. If the price drops and closes below $4.83, the DOT/USDT pair could begin its descent toward $4.60.
Conversely, if the price rebounds from the current level and breaks above the moving averages, it will signal a resurgence by the bulls. The pair could then rise to $5.33 and eventually reach the downtrend line.
This article does not contain investment advice or recommendations. Every investment and trading move involves risk, and readers should conduct their own research when making a decision.