Disclaimer: Information found on CryptoreNews is those of writers quoted. It does not represent the opinions of CryptoreNews on whether to sell, buy or hold any investments. You are advised to conduct your own research before making any investment decisions. Use provided information at your own risk.
CryptoreNews covers fintech, blockchain and Bitcoin bringing you the latest crypto news and analyses on the future of money.
Bitcoin (BTC) continued its downward trend on May 12; however, analyst Philip Swift, co-founder of the trading platform DecenTrader and creator of the data resource LookIntoBitcoin, does not foresee a significant correction. He remarked that it is “noteworthy that the long/short ratio has been increasing as the price has declined.”
One factor keeping analysts optimistic is Bitcoin’s halving, which has adhered to a consistent cycle thus far, and analysts anticipate this trend will persist. Referencing past cycles, investor and entrepreneur Alistair Milne stated that the optimal time to purchase is now.
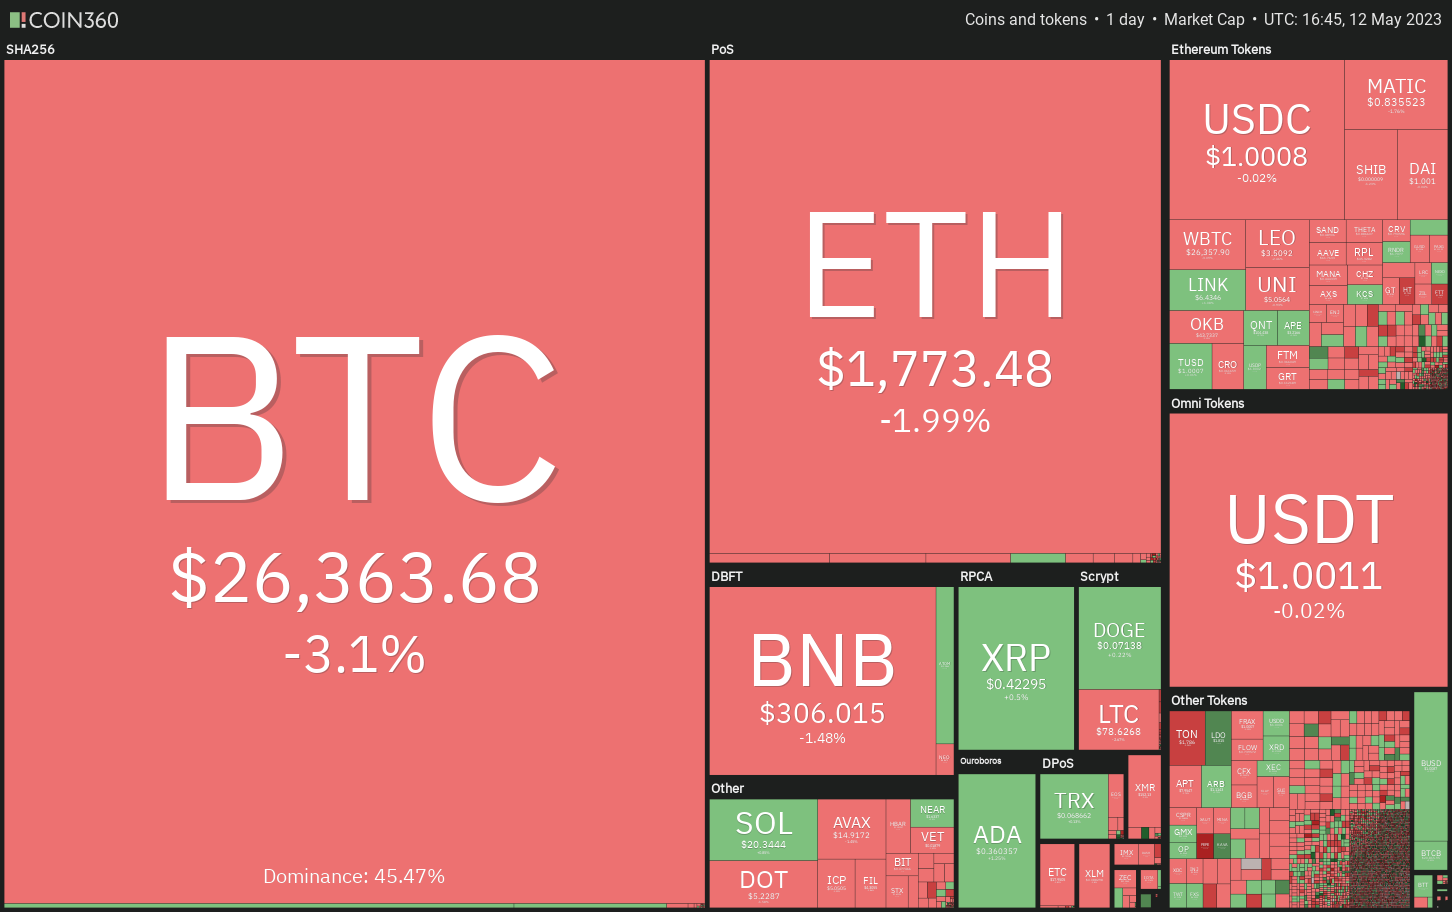 Daily cryptocurrency market performance. Source: Coin360
Nonetheless, in the short term, Bitcoin may encounter pressure due to the relief rally in the U.S. dollar index (DXY). Generally, the DXY exhibits an inverse relationship with Bitcoin’s performance.
What are the key support levels that might draw buyers to Bitcoin and the leading altcoins? Let’s analyze the charts of the top-10 cryptocurrencies to uncover the details.
Bitcoin price analysis
On May 10, Bitcoin formed a long-legged doji candlestick pattern, signaling uncertainty among bulls and bears. The sellers resolved this indecision to the downside by breaking below the support line of the symmetrical triangle pattern.
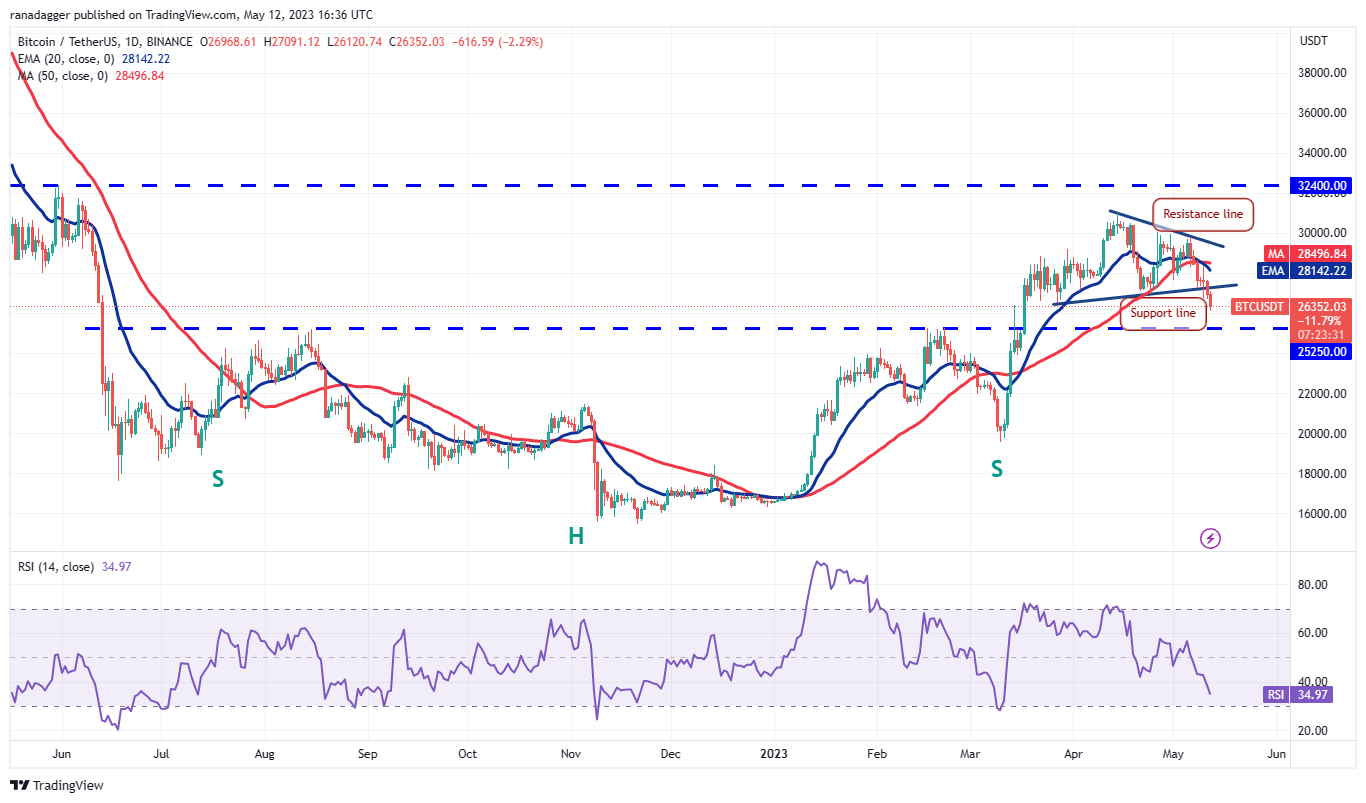 BTC/USDT daily chart. Source: TradingView
The moving averages have executed a bearish crossover, with the 20-day exponential moving average ($28,142) falling below the 50-day simple moving average ($28,496).
This, combined with the relative strength index (RSI) in negative territory, indicates that bears are in control. The next downside target is $25,250, a crucial level for bulls to defend as it represents the neckline of the inverse head and shoulders pattern.
If the BTC price rebounds from this level, bulls will again attempt to push the BTC/USDT pair above the resistance line. Conversely, a break below $25,250 could pave the way for a potential decline to $20,000.
Ether price analysis
Ether (ETH) declined from the 20-day EMA ($1,866) on May 10, indicating a shift in sentiment to negative as traders sell during rallies.
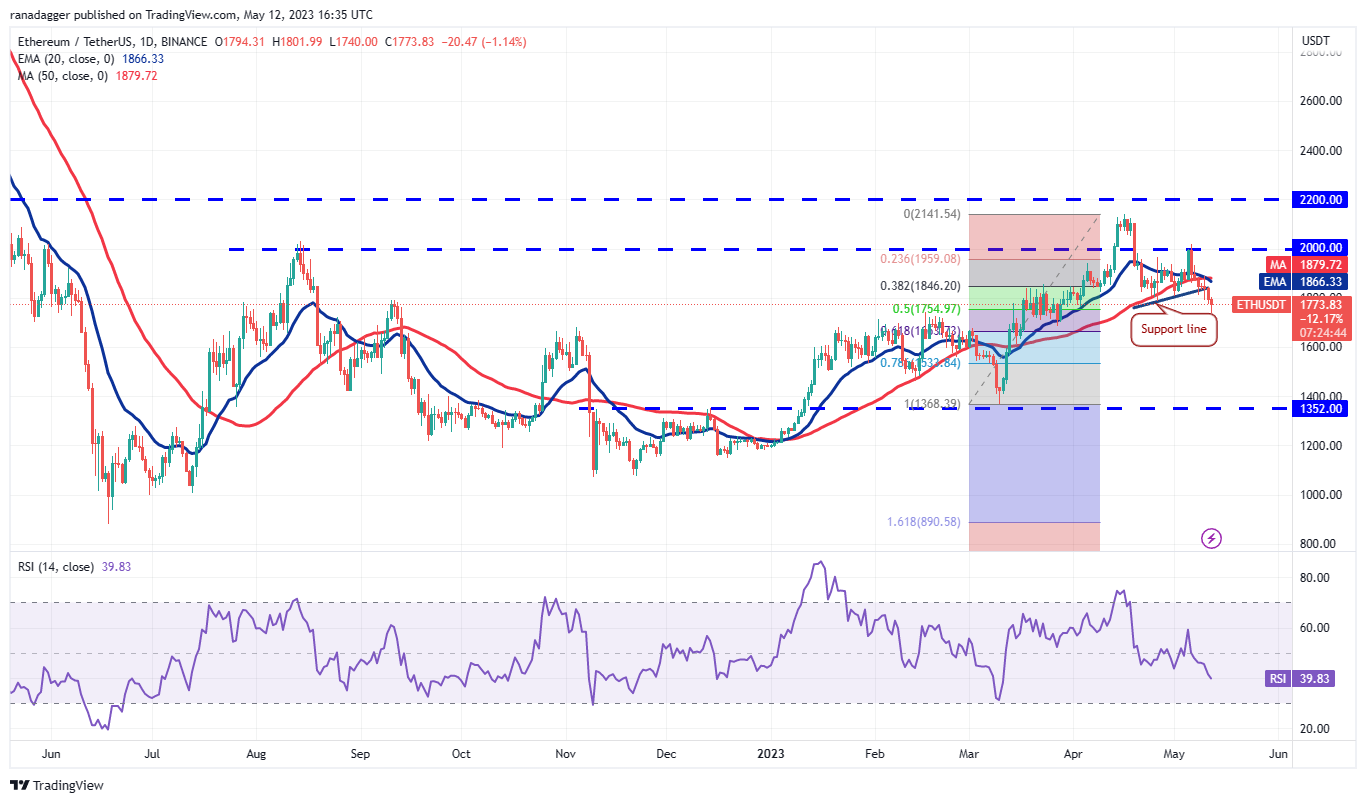 ETH/USDT daily chart. Source: TradingView
The ETH/USDT pair broke and closed below the support line on May 11, signaling the continuation of the correction. The pair may next approach the 61.8% Fibonacci retracement level of $1,663, which is likely to attract significant buying interest from bulls.
The initial sign of strength will be a break and close above the 20-day EMA. Such a move would indicate that bears may be losing their grip. The ETH price could then reach the psychologically significant level of $2,000.
BNB price analysis
BNB (BNB) continued its downward trajectory, nearing the immediate support at $300. This level had previously served as strong support on April 3 and March 15, prompting bulls to attempt to defend it once more.
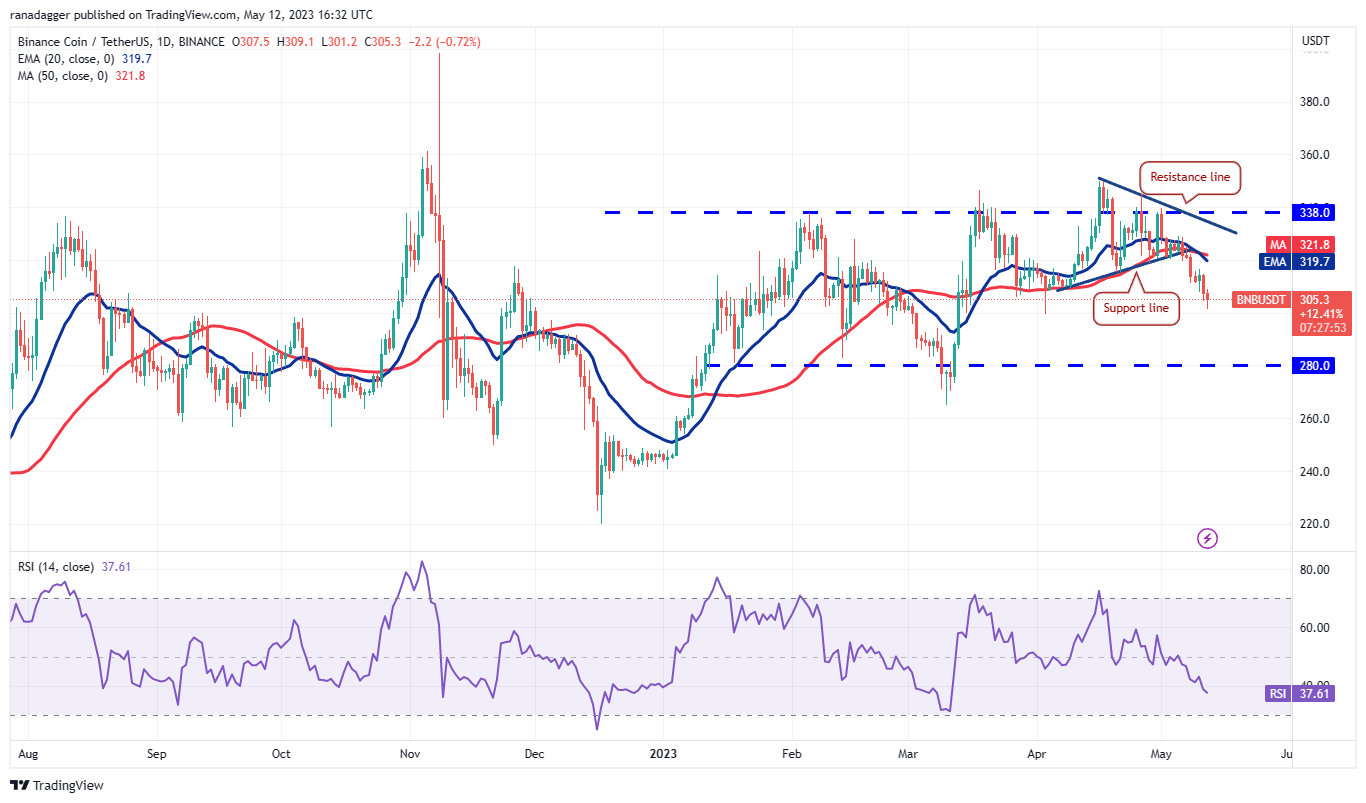 BNB/USDT daily chart. Source: TradingView
In the short term, the $300 level may initiate a rebound; however, it is likely to encounter strong selling pressure at the 20-day EMA ($319). This could increase the likelihood of a break below $300, with the BNB/USDT pair potentially declining toward the next significant support at $280.
This negative outlook will be invalidated in the near term if the price rises and breaks above the moving averages. The pair could then ascend toward the overhead resistance at $338. For now, the pair may continue to fluctuate within the broad range between $280 and $338.
XRP price analysis
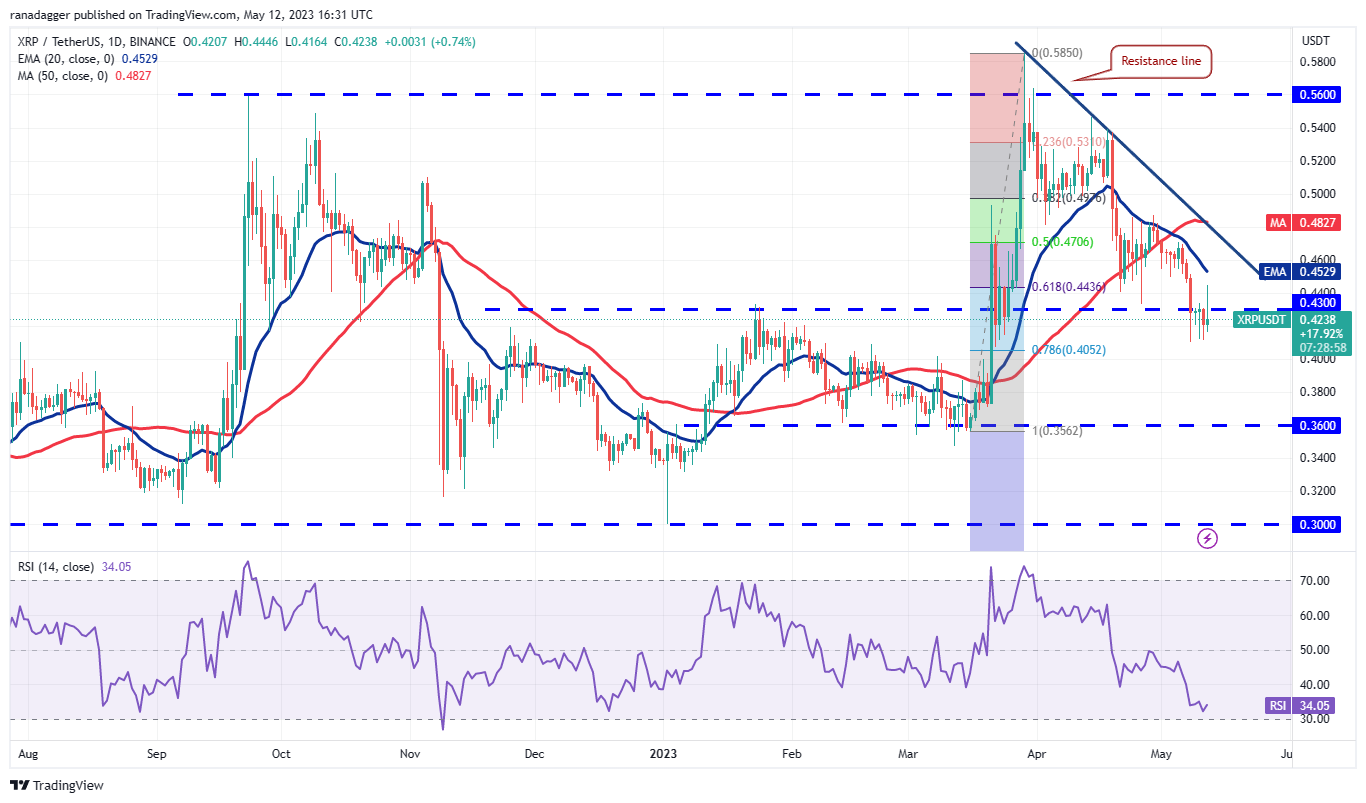
The bulls are finding it challenging to push and maintain XRP (XRP) above $0.43, indicating that demand is diminishing at higher levels.
 XRP/USDT daily chart. Source: TradingView
The declining 20-day EMA ($0.45) and the RSI nearing oversold territory suggest that bears are in control. Sellers will next attempt to drive the XRP/USDT pair below the $0.40 support. If successful, the pair may complete a 100% retracement and drop to $0.36.
Conversely, if the XRP price rebounds from $0.40, bulls will again try to push and sustain the pair above $0.43. Buyers will need to elevate the price above the resistance line to signal the beginning of a sustained recovery.
Cardano price analysis
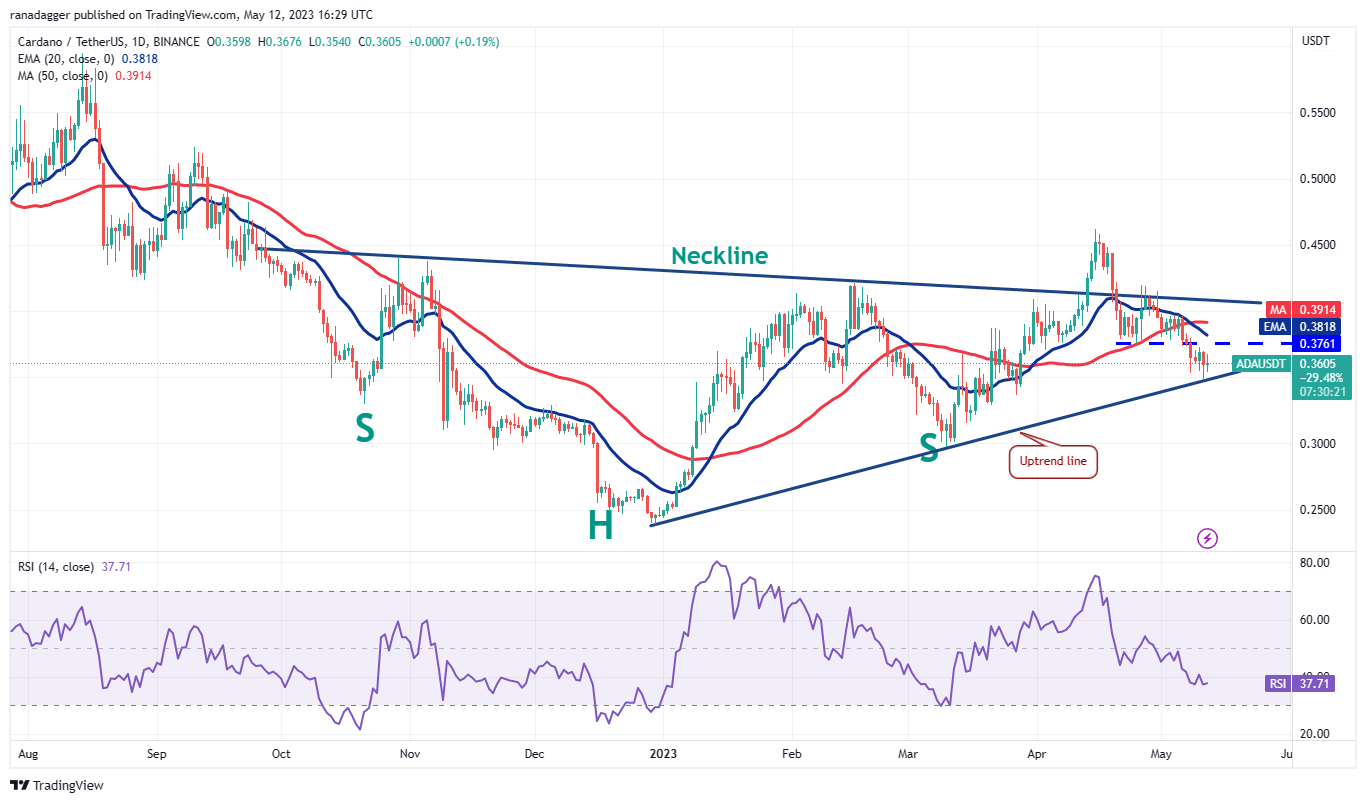
The long tail on Cardano’s (ADA) May 11 candlestick indicates that bulls are attempting to buy the dips toward the uptrend line.
 ADA/USDT daily chart. Source: TradingView
Related Posts
The declining 20-day EMA ($0.38) and the RSI in negative territory imply that bears have the advantage. They will likely sell on any recovery attempt to the 20-day EMA. If this occurs, the ADA/USDT pair will likely drop again to the uptrend line.
Repeatedly testing a support level tends to weaken it. A break below the uptrend line could pull the ADA price down to $0.33 and subsequently to $0.30.
On the other hand, if bulls push the price above the moving averages, Cardano’s price could rally to the neckline of the inverse H&S pattern.
Dogecoin price analysis
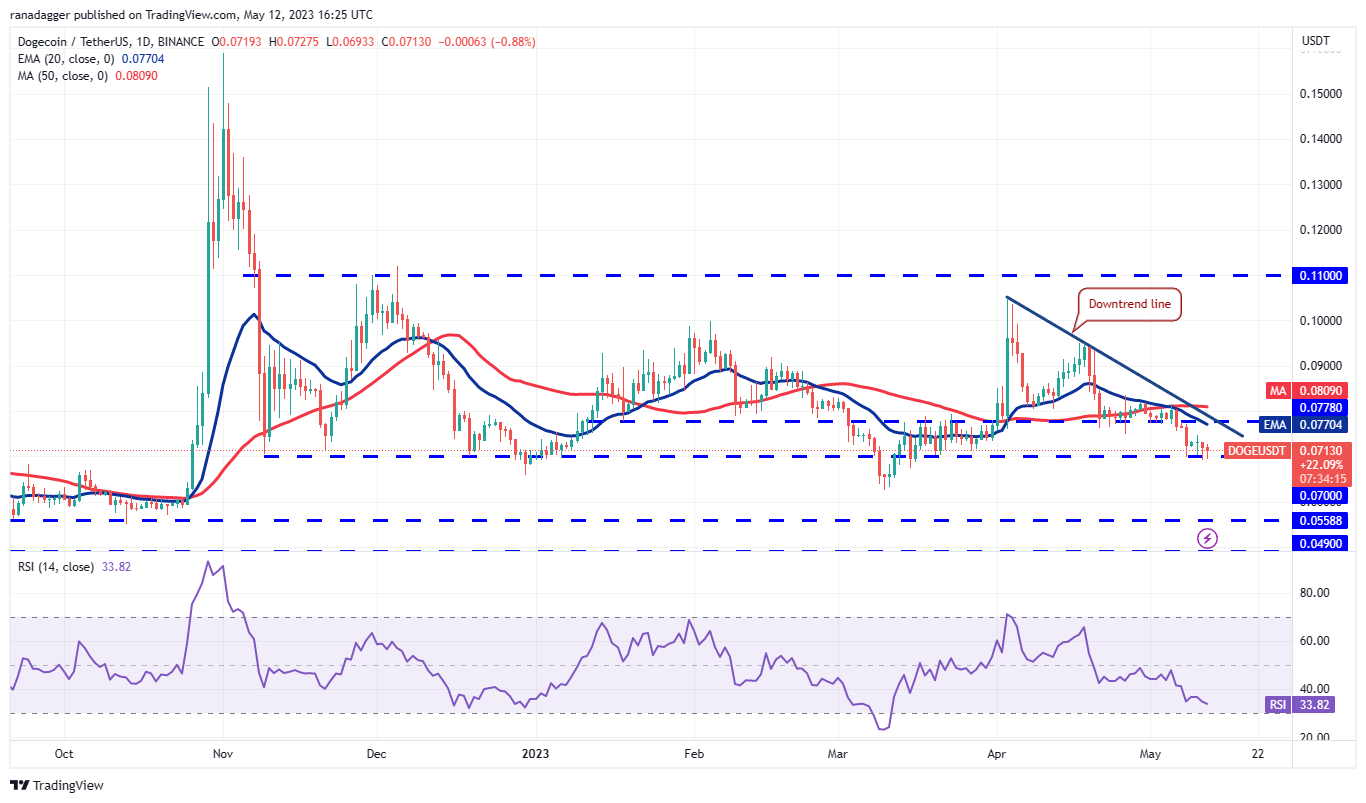
The bulls have successfully defended the $0.07 level for several days, but they have not managed to initiate a relief rally in Dogecoin (DOGE). This indicates that buying interest is waning at higher levels.
 DOGE/USDT daily chart. Source: TradingView
The bears will attempt to strengthen their position by pulling the price below $0.07. If they succeed, the DOGE/USDT pair could decline to $0.06. This level is likely to act as support, but bears may present a strong challenge at the downtrend line.
If the DOGE price declines from the downtrend line and breaks below $0.06, selling pressure could intensify. The pair may then plunge to the critical support at $0.05. A break and close above the downtrend line will be the initial indication that selling pressure may be easing.
Polygon price analysis
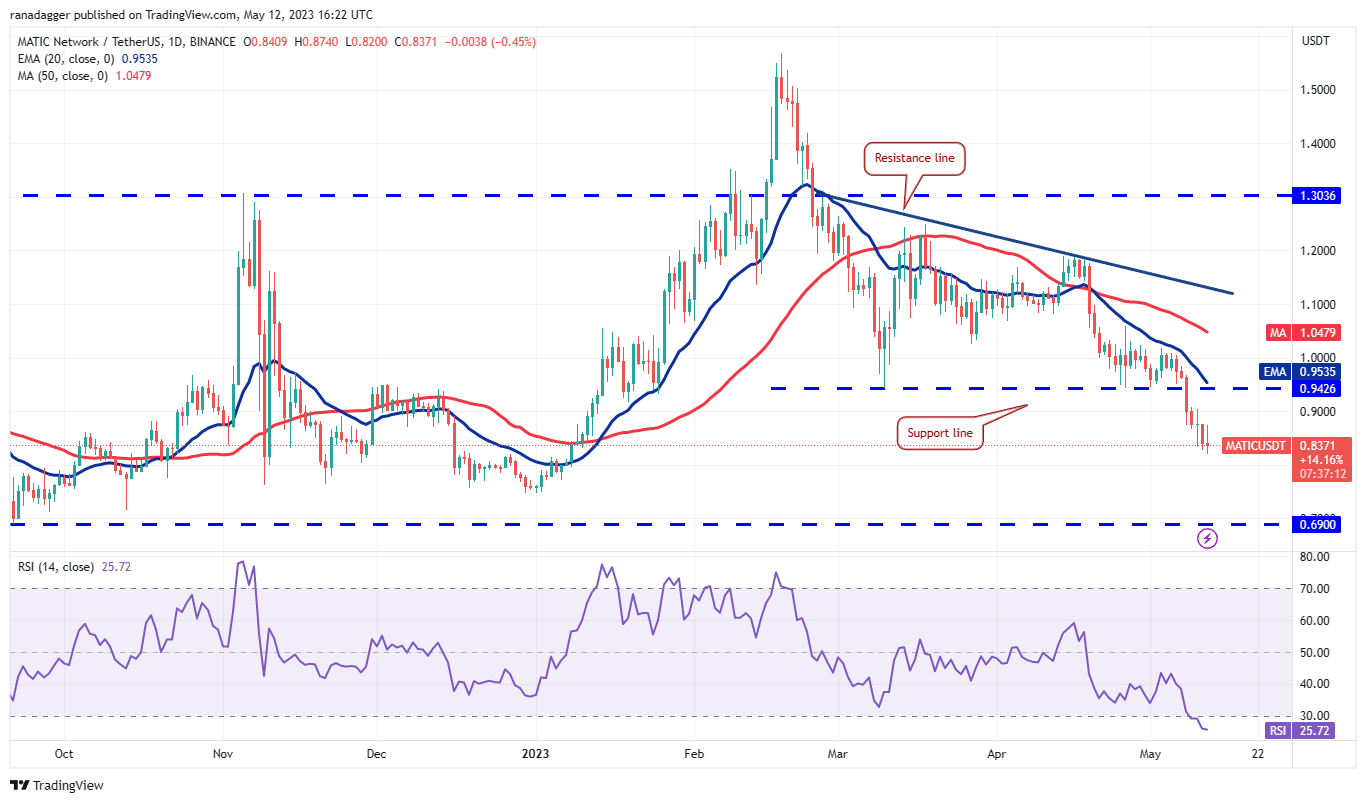
Polygon (MATIC) has continued its decline below the breakdown level of $0.94. This has pushed the RSI into oversold territory, suggesting that the selling may have been excessive in the short term.
 MATIC/USDT daily chart. Source: TradingView
The MATIC/USDT pair may rebound and retest the breakdown level of $0.94. This level is likely to see a contest between bulls and bears. If the MATIC price declines from $0.94, it will indicate that bears have converted the level into resistance, increasing the chances of a drop to $0.69.
Conversely, if buyers push the price above $0.94, it will indicate that bulls are attempting a recovery. Polygon’s price may then rise to the resistance line, where bears will again mount a strong defense.
Related: Bitcoin's dive under $27K liquidates $100M — So why aren't margin traders flipping bearish?
Solana price analysis
Solana (SOL) has been trading close to the immediate support at $19.85 for the past four days. This indicates that bulls are buying the dips, but they have not been able to initiate a significant recovery.
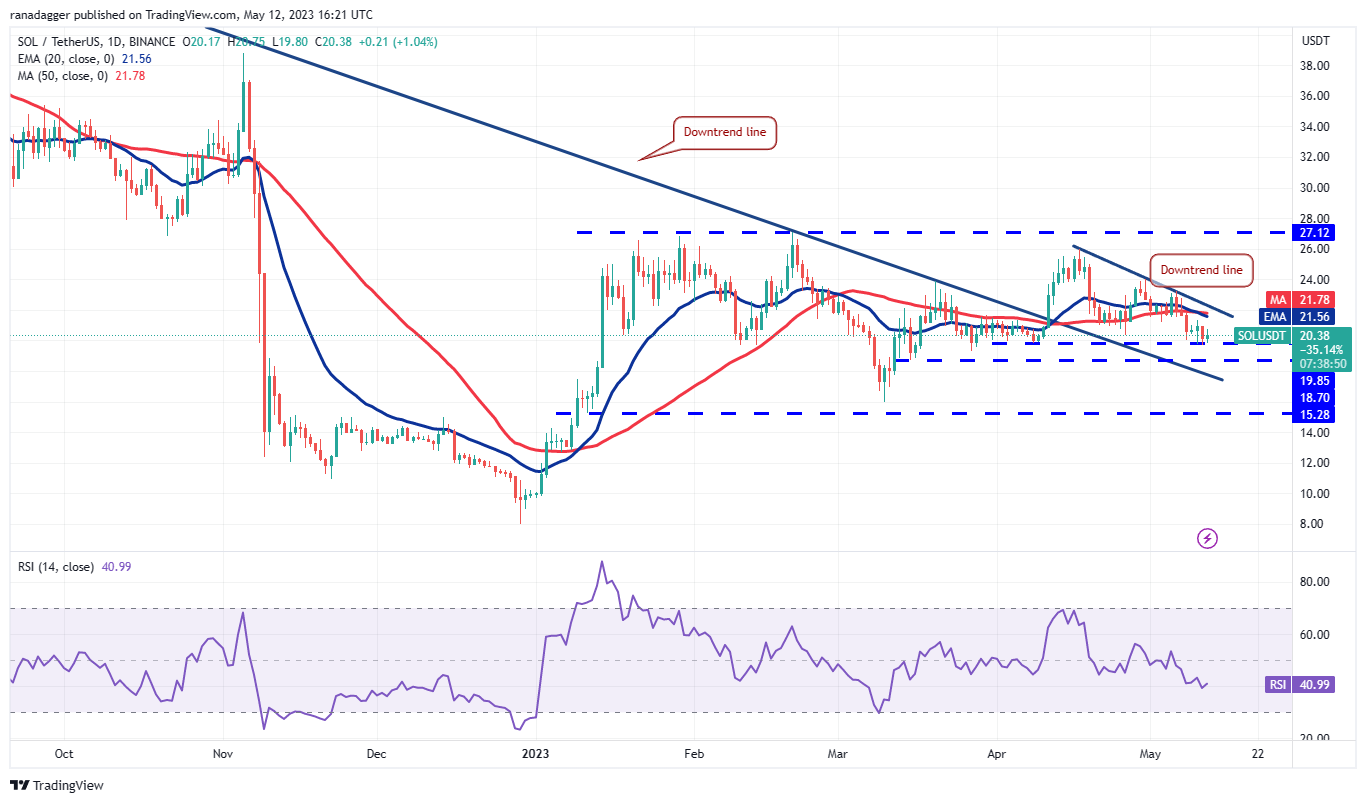 SOL/USDT daily chart. Source: TradingView
The 20-day EMA ($21.56) has begun to decline, and the RSI is in the negative zone, suggesting that bears have a slight advantage. If the SOL price moves lower from the current level or the downtrend line, it will indicate that sentiment remains negative. The SOL/USDT pair may then fall to $18.70.
In contrast, if bulls break through the downtrend line, it will suggest that the pair is trapped within the range between $19.85 and $27.12. The pair may initially rise to $24 and then attempt a rally to $27.12.
Polkadot price analysis
Polkadot (DOT) rebounded from the strong support at $5.15 on May 10, but bulls could not capitalize on this move. This indicates a lack of buyers at higher levels.
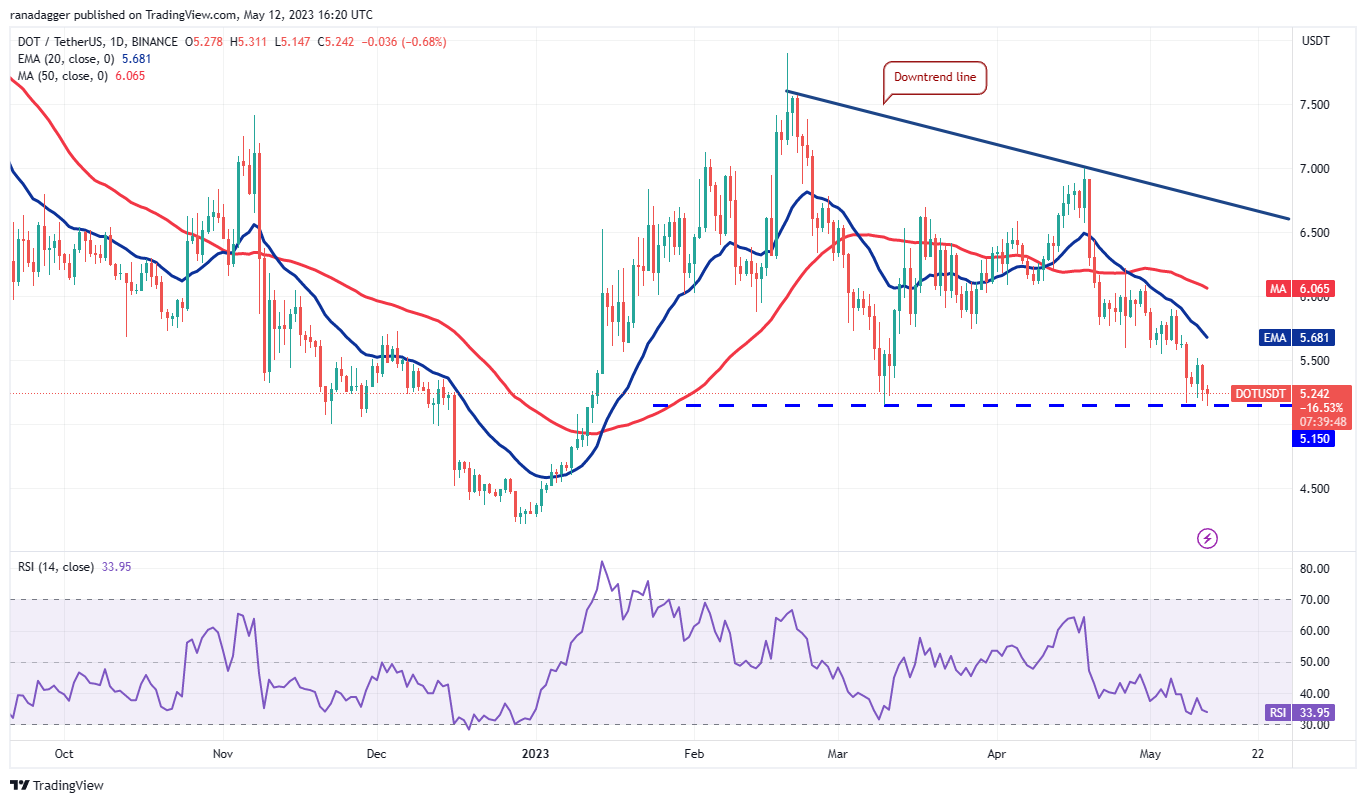 DOT/USDT daily chart. Source: TradingView
The bears seized this opportunity and are attempting to push the price below the critical support at $5.15. If successful, it will indicate the beginning of the next phase of the downtrend. The DOT/USDT pair could then drop to $4.50.
If the DOT price reverses from the current level and rises above the 20-day EMA ($5.68), it will suggest robust buying at lower levels. The pair may first rise to the 50-day SMA ($6.06) and subsequently rally to the downtrend line.
Litecoin price analysis
Litecoin’s (LTC) rebound from the strong support at $75 is encountering significant selling pressure near $82. This indicates that bears are capitalizing on every minor rally.
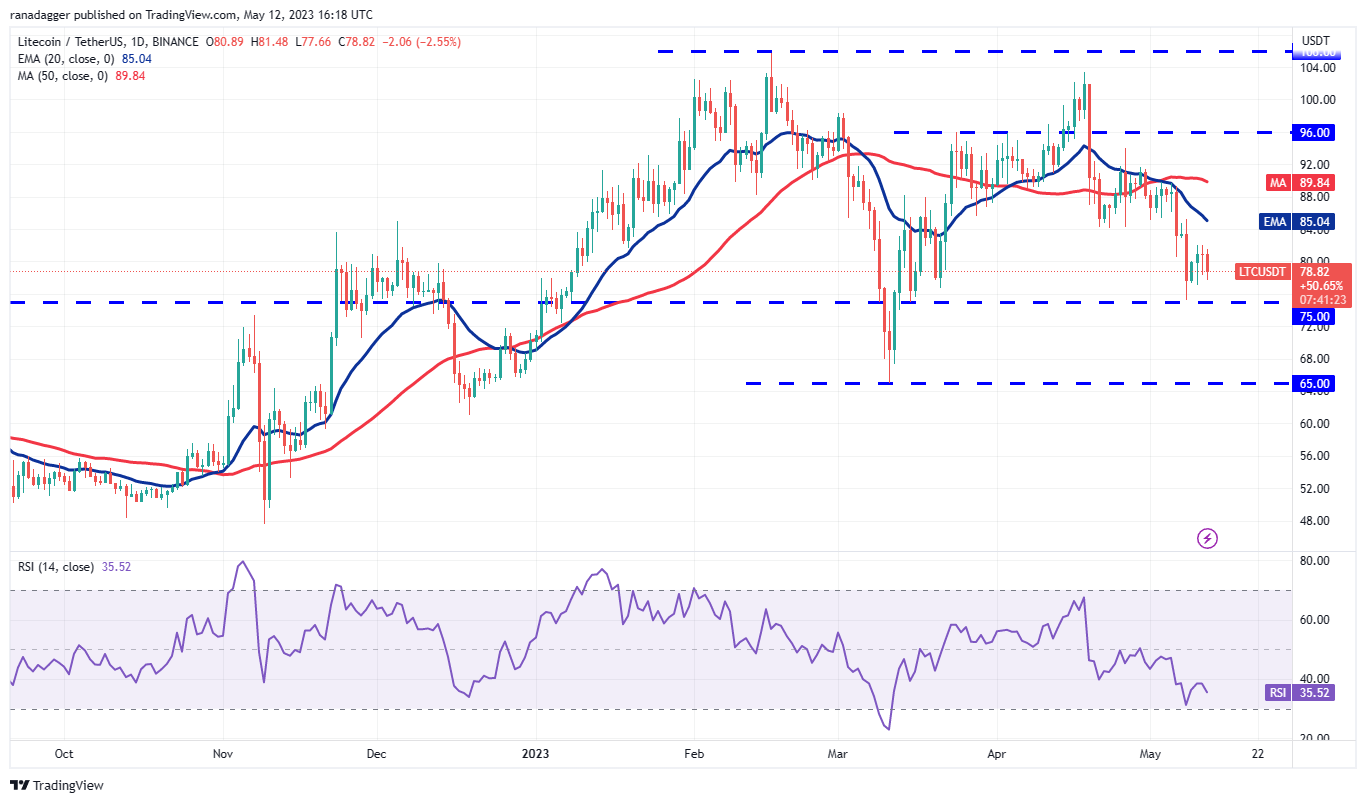 LTC/USDT daily chart. Source: TradingView
The bears will make another attempt to pull the price below $75. If they succeed, the LTC/USDT pair could resume its downtrend and slide toward the critical support at $65. Buyers are anticipated to defend this level vigorously.
This article does not contain investment advice or recommendations. Every investment and trading move involves risk, and readers should conduct their own research when making a decision.