Disclaimer: Information found on CryptoreNews is those of writers quoted. It does not represent the opinions of CryptoreNews on whether to sell, buy or hold any investments. You are advised to conduct your own research before making any investment decisions. Use provided information at your own risk.
CryptoreNews covers fintech, blockchain and Bitcoin bringing you the latest crypto news and analyses on the future of money.
October is shaping up to be a robust month for Bitcoin (BTC) as its price approaches the 2023 peak of $31,805. Typically, significant resistance levels are not breached on the first attempt, as sellers emerge to protect these thresholds. Consequently, a slight decline can be anticipated, but this should not be interpreted as the onset of negative sentiment.
Buyers tend to regroup at lower price points, aiming to establish a higher support level. This can lead to increased buying activity and initiate a rally. While this scenario is plausible for Bitcoin, certain risks persist. Although a decline in the United States dollar index (DXY) is encouraging, the weakness observed in the S&P 500 Index (SPX) presents a downside.
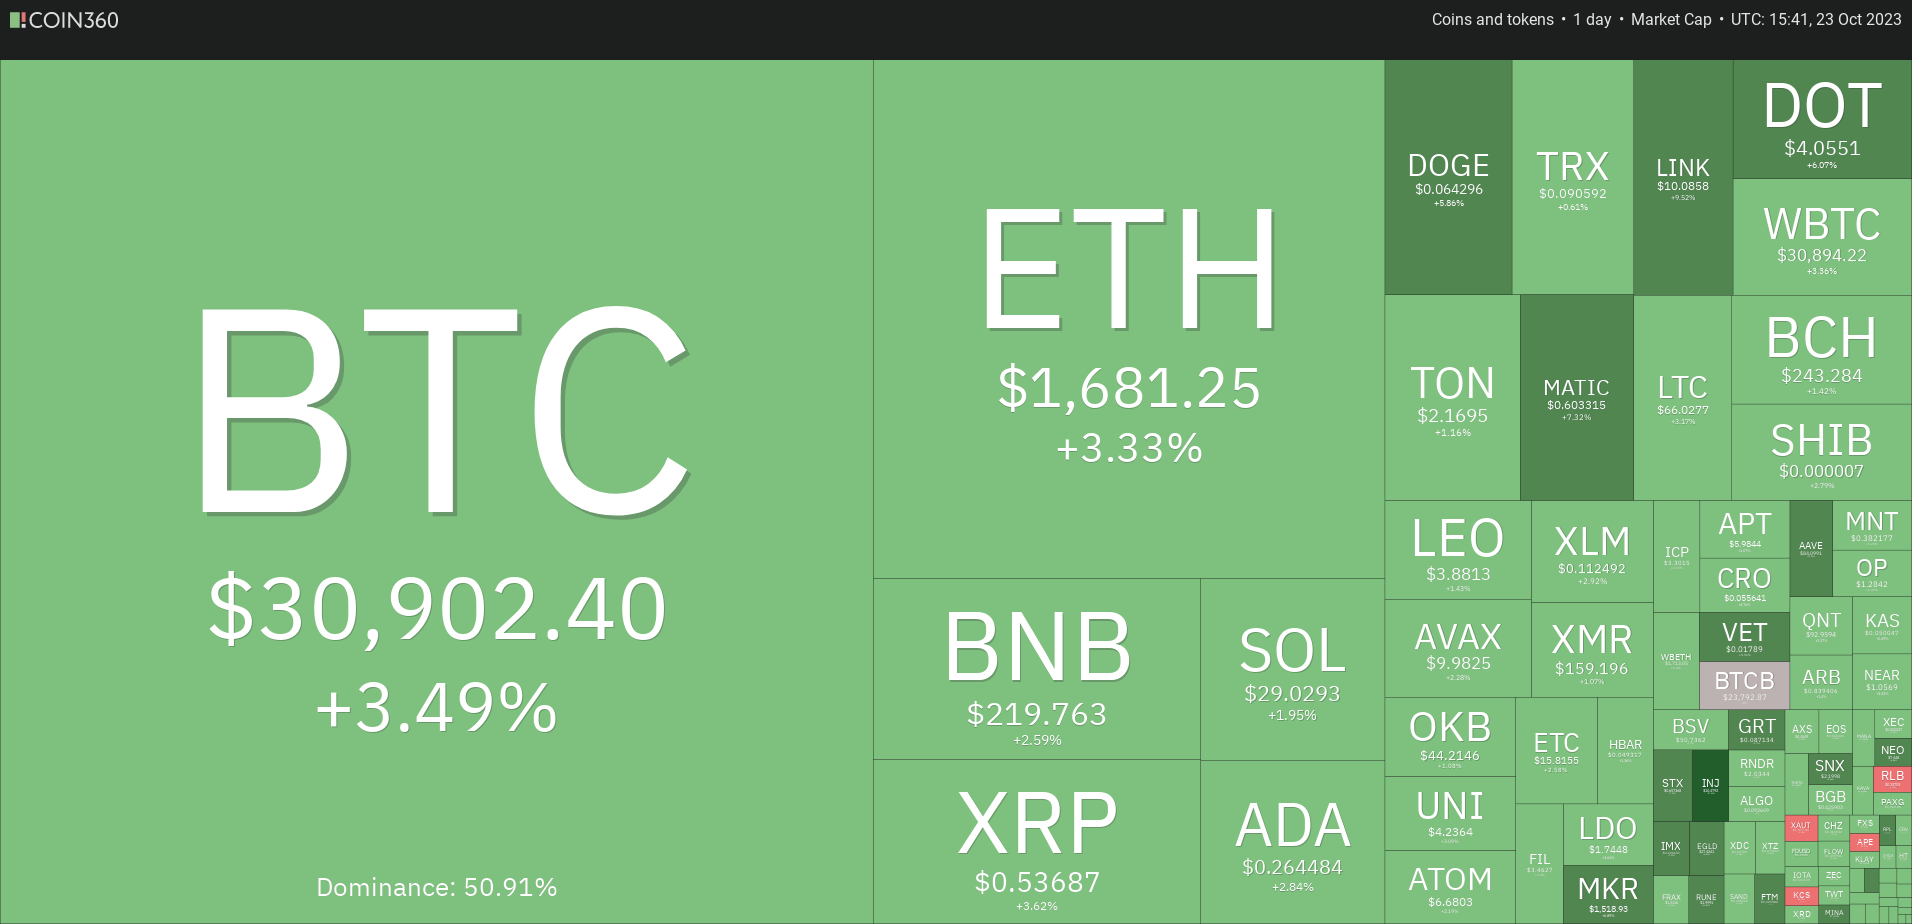 Daily cryptocurrency market performance. Source: Coin360
Another potential risk for the ascending cryptocurrency markets could stem from the rising 10-year Treasury yield, which has once again surpassed 5%. This increase in yields indicates that market participants are becoming less optimistic about the Federal Reserve reducing interest rates in the near term.
Could the dissatisfaction in the U.S. equity markets push investors towards cryptocurrencies? Will Bitcoin detach from the S&P 500 Index and continue its upward trajectory? Let’s examine the charts for insights.
S&P 500 Index price analysis
The bears effectively defended the retest of the neckline of the head and shoulders pattern in the S&P 500 Index. The inability to push the price above the 50-day simple moving average (4,382) led to aggressive selling from the bears.
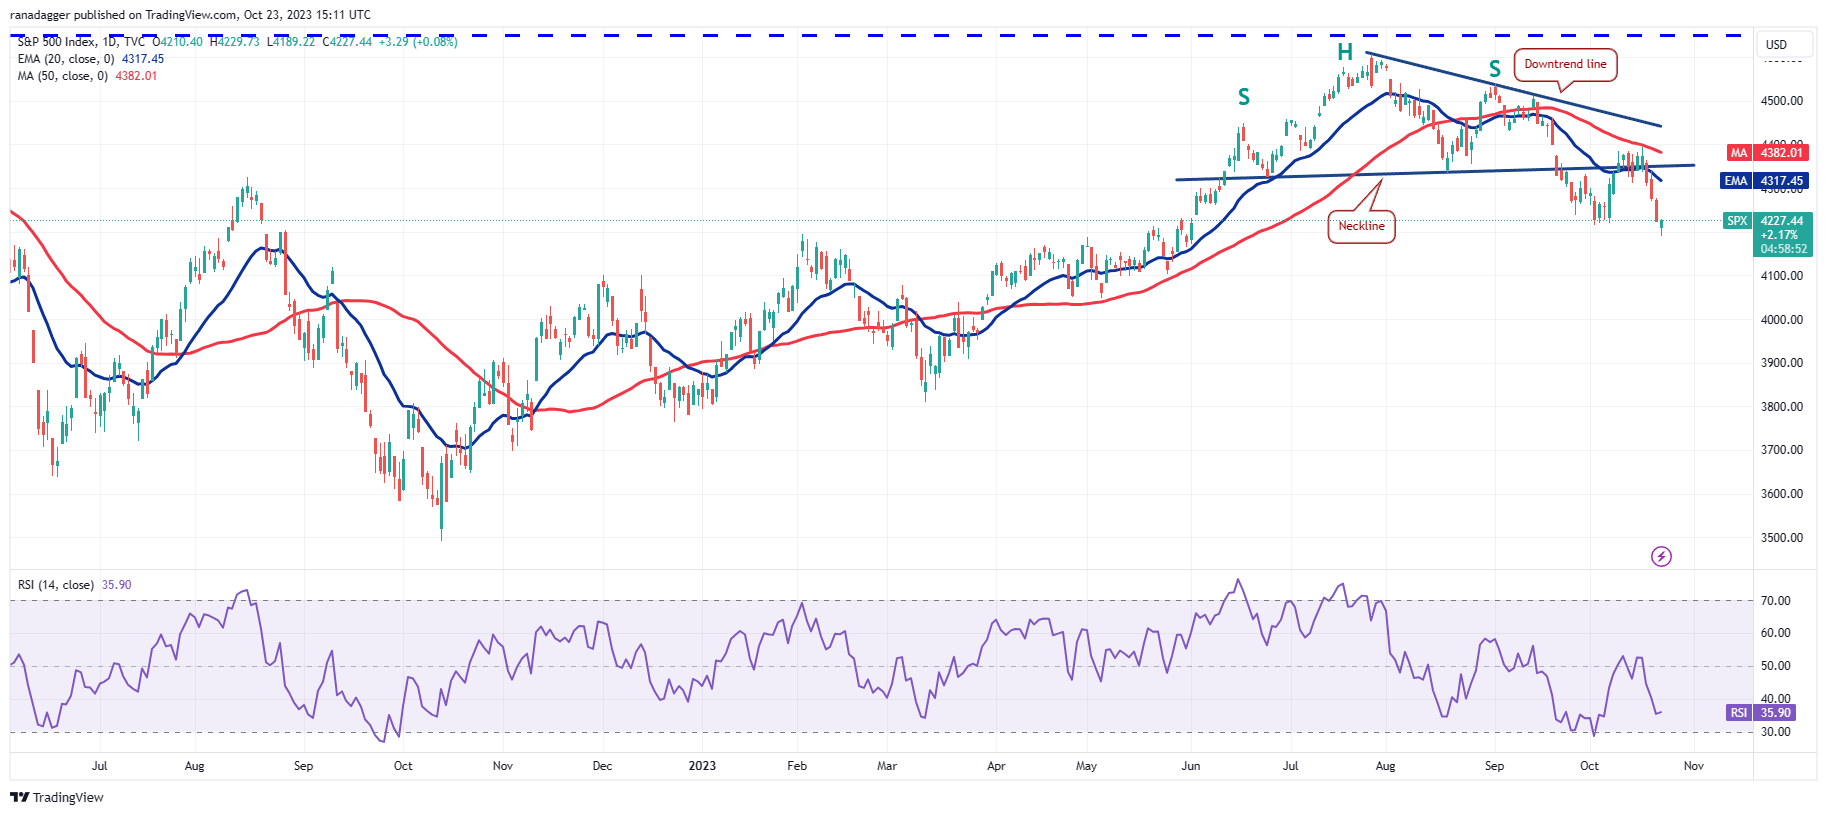 SPX daily chart. Source: TradingView
The index fell below the critical support level at 4,216 on Oct. 23, but bulls are attempting to halt the downward trend. Any recovery efforts are likely to encounter significant selling pressure at the 20-day exponential moving average (4,317) and subsequently at the 50-day SMA. For the bulls to indicate that the correction may be concluding, they need to push the price above 4,400.
If the price declines and remains below 4,216, selling pressure may intensify, potentially driving the index down toward the pattern target of 4,088.
U.S. dollar index price analysis
The U.S. dollar index is experiencing a fierce contest between buyers and sellers. The bulls attempted to elevate the price toward the local high of 107.35, but the bears maintained their position.
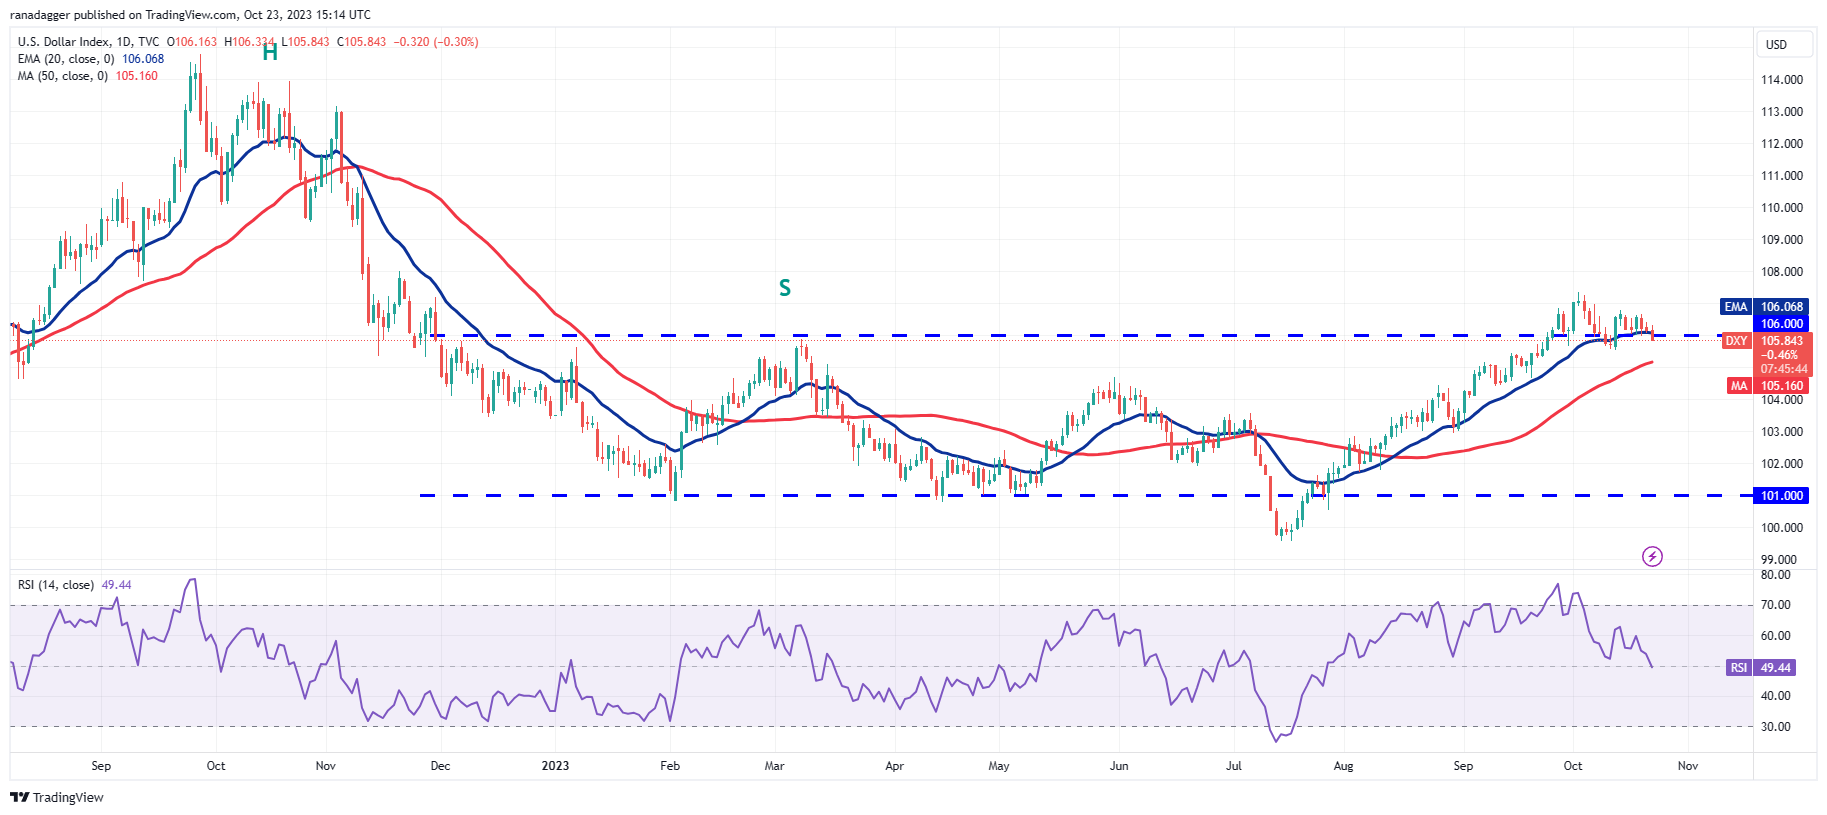 DXY daily chart. Source: TradingView
Sellers are striving to keep the price below the breakout level of 106. If they succeed, the index may see profit-taking and drop to the 50-day SMA ($105) and then to 104.50, where robust buying from bulls is anticipated.
If the price rebounds from this area, the bulls will again attempt to push the index above 107.35. If successful, the index could rise to 108 and eventually reach 111.
Conversely, if the price falls below 104.50, it will signal that the bears are regaining control. The index may then decline to 103.
Bitcoin price analysis
After struggling to maintain a position above $30,000 for three consecutive days, the bulls made a significant move on Oct. 23, driving the price up to $31,000.
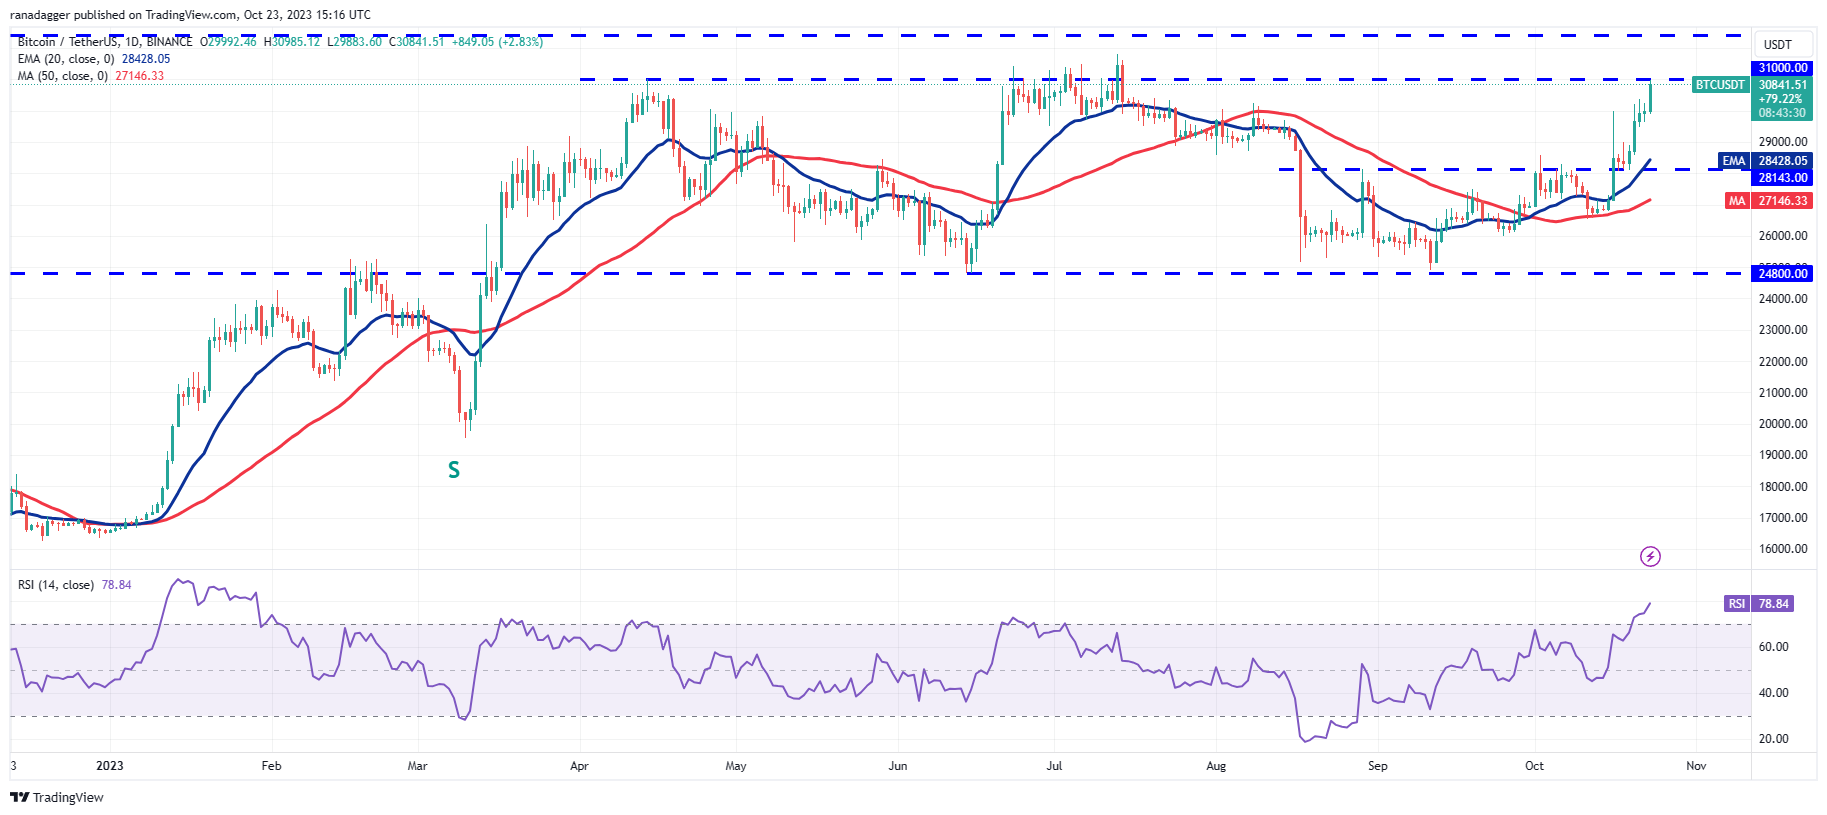 BTC/USDT daily chart. Source: TradingView
The recent sharp increase has pushed the relative strength index (RSI) into overbought territory, suggesting that a consolidation or correction may be imminent in the short term. If the price does not drop below $30,000, it will indicate that every minor dip is being bought. The bulls will then make another attempt to overcome the resistance at $31,000.
Should they succeed, the BTC/USDT pair could rise to $32,400. The bears are expected to defend this level vigorously, as a breach of the $32,400 resistance could lead to a surge toward $40,000.
On the other hand, if the price sharply declines and falls below $30,000, it will suggest that traders are taking profits, which may push the price down to the 20-day EMA ($28,428).
Ether price analysis
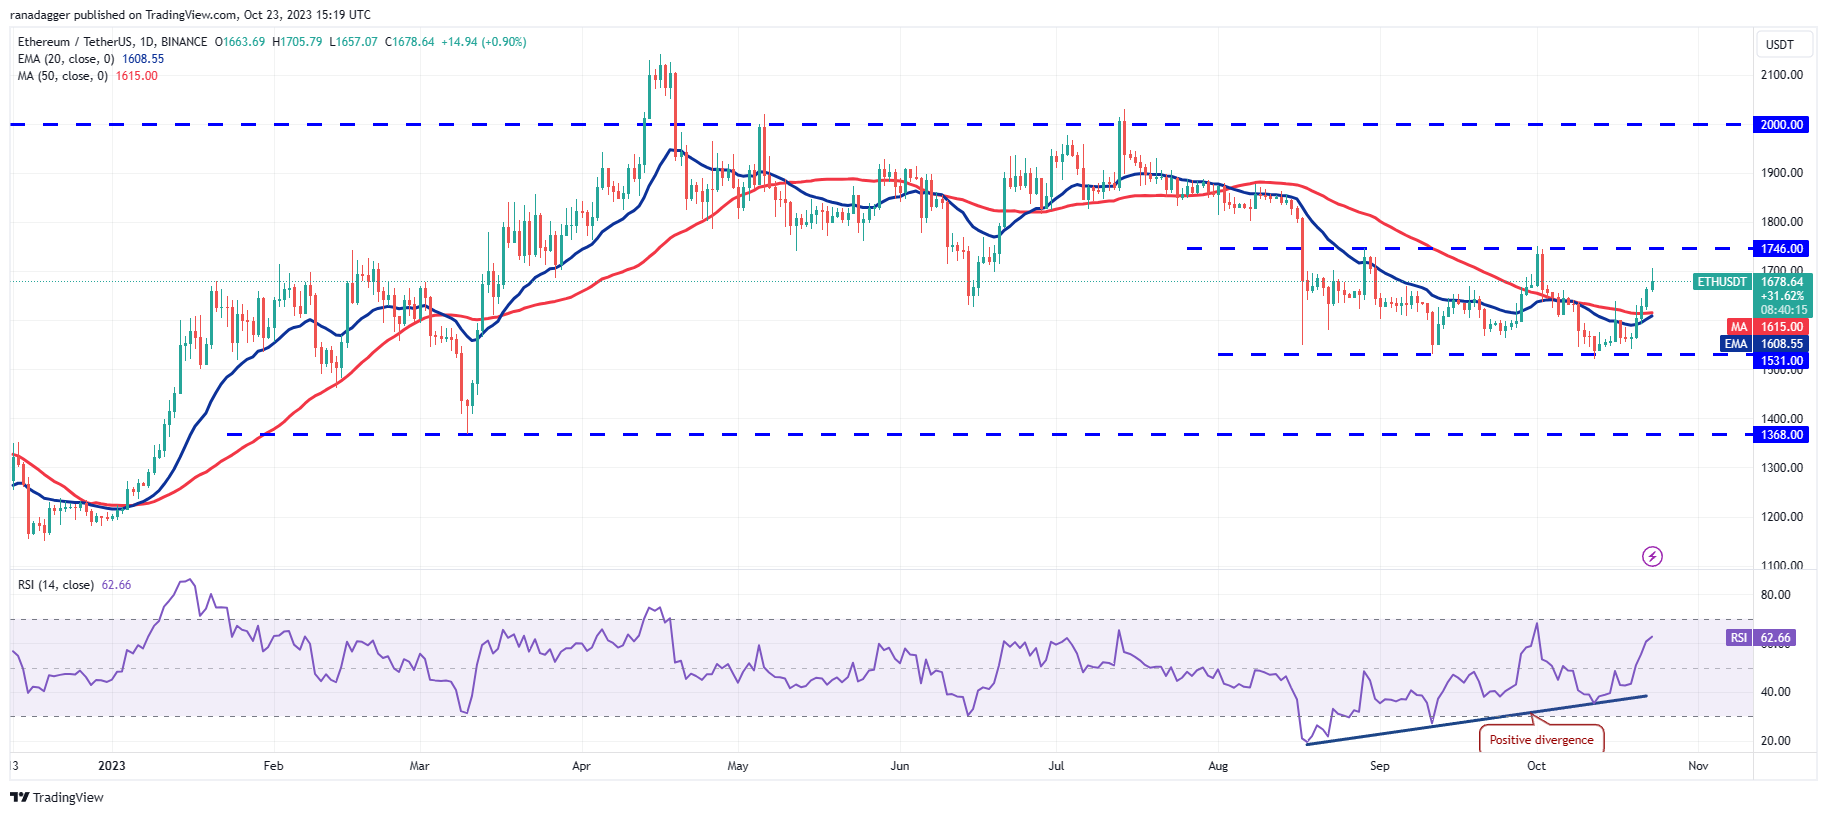
Ether (ETH) surpassed the moving averages on Oct. 21, indicating that bulls continue to buy the dips towards the strong support at $1,531.
 ETH/USDT daily chart. Source: TradingView
The 20-day EMA ($1,608) has begun to trend upward, and the RSI is in the positive zone, suggesting that the bears may be losing their grip. The ETH/USDT pair could rise to $1,746, where the bears will attempt to halt the upward movement.
If the bulls maintain their position from this level, the chances of a rally above $1,746 increase. The pair could then advance to $1,880. Conversely, if the price sharply declines from $1,746, it will indicate that range-bound trading may persist for a few more days.
BNB price analysis
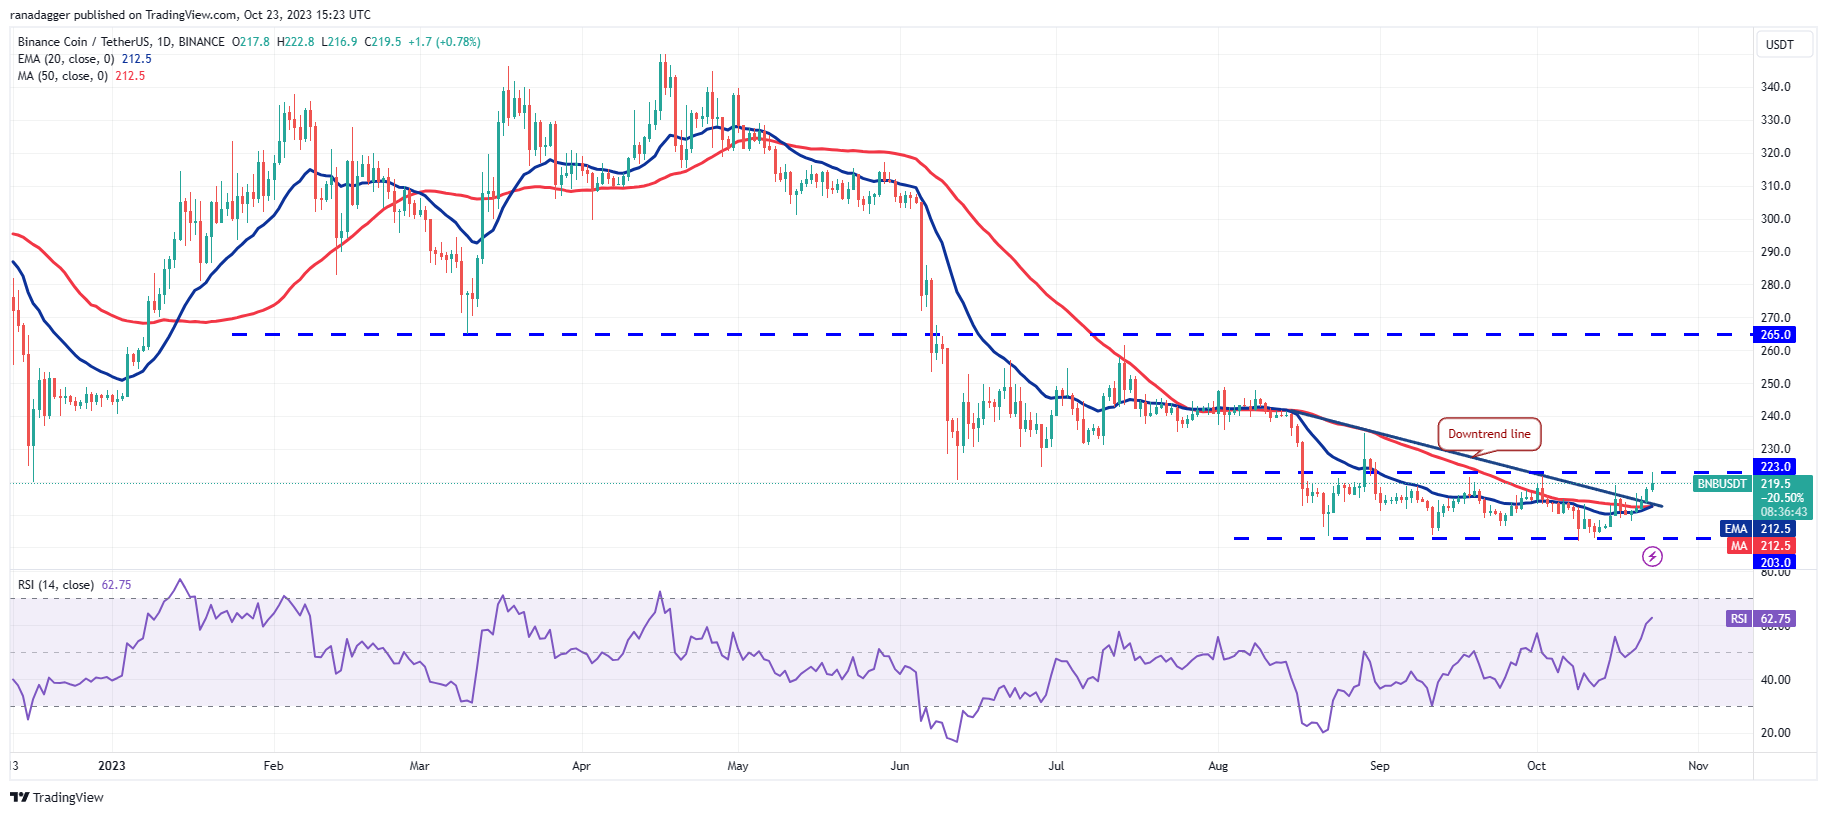
BNB (BNB) broke and closed above the downtrend line on Oct. 22, nullifying the bearish descending triangle pattern. The failure of this bearish setup is a bullish indicator.
Related Posts
 BNB/USDT daily chart. Source: TradingView
The BNB/USDT pair has reached the horizontal resistance at $223. If this barrier is surpassed, the pair could rally to $243 and subsequently to $250. The bears are expected to defend this area vigorously.
If the bears aim to regain control, they must quickly push the price below the moving averages. This could lead to a retest of the crucial support at $203. A drop below this level could initiate the next phase of the downtrend toward $183.
XRP price analysis
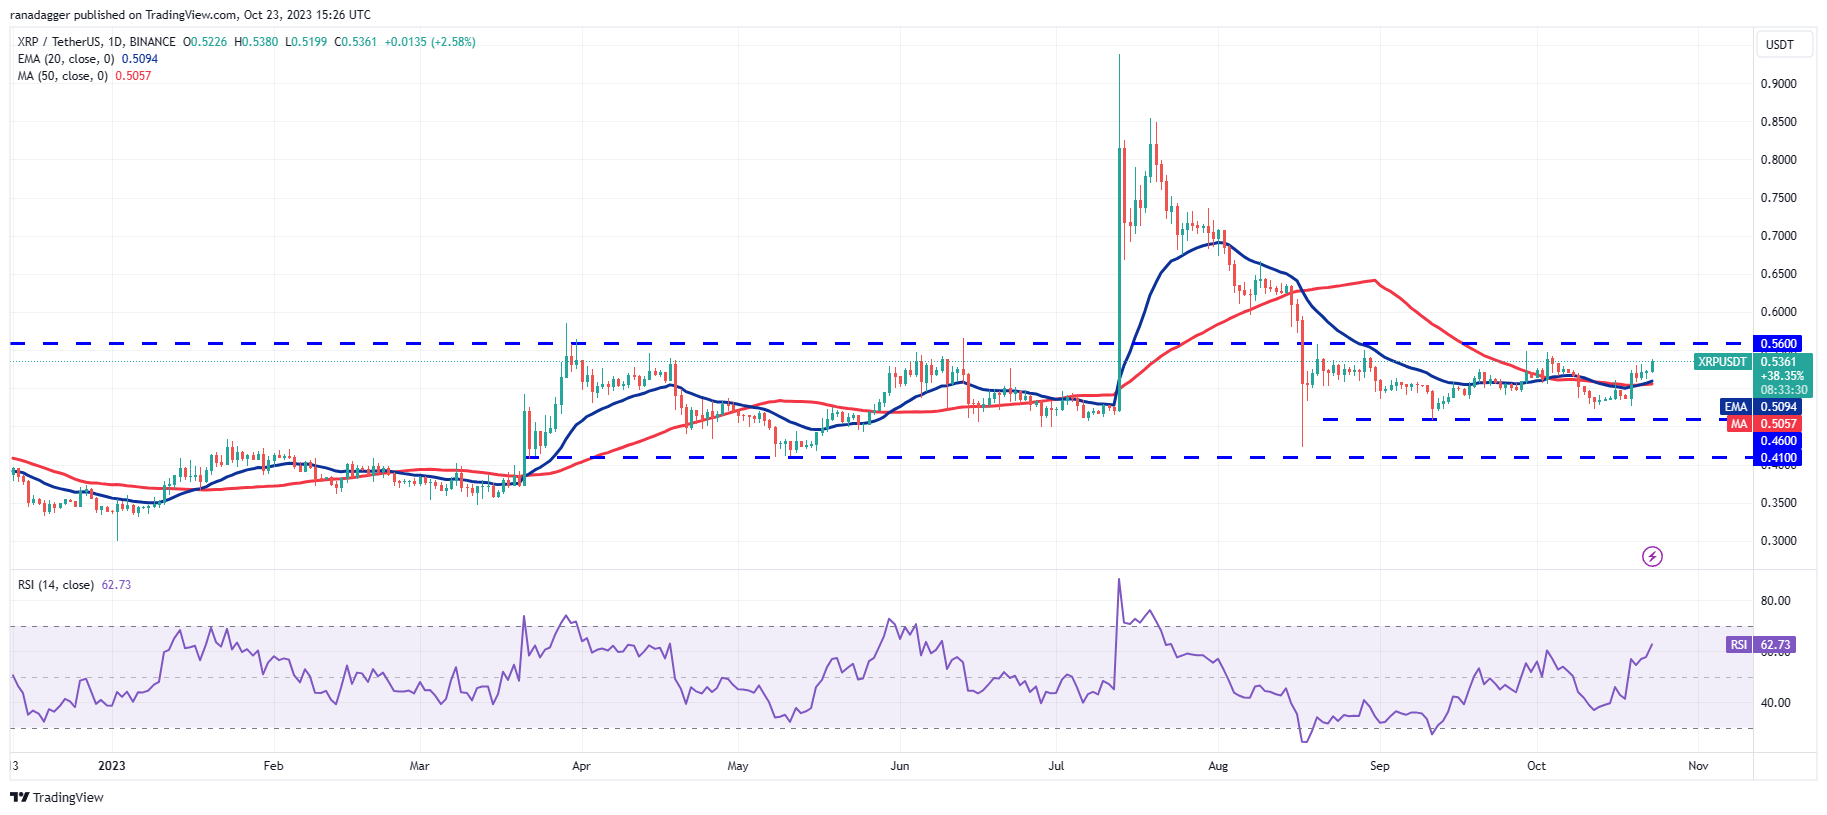
XRP (XRP) rose above the moving averages on Oct. 19, and the bulls have kept the price above this level since then.
 XRP/USDT daily chart. Source: TradingView
The bulls will attempt to push the price to the overhead resistance at $0.56. In a range, traders typically sell into resistance. If the price sharply declines from $0.56, it will suggest that the XRP/USDT pair may remain within the range for a longer duration.
Both moving averages are gradually sloping upward, and the RSI has entered positive territory, indicating that the bulls have the advantage. If buyers push the price above $0.56, the pair may initiate a rally to $0.66 and then to $0.71.
Solana price analysis
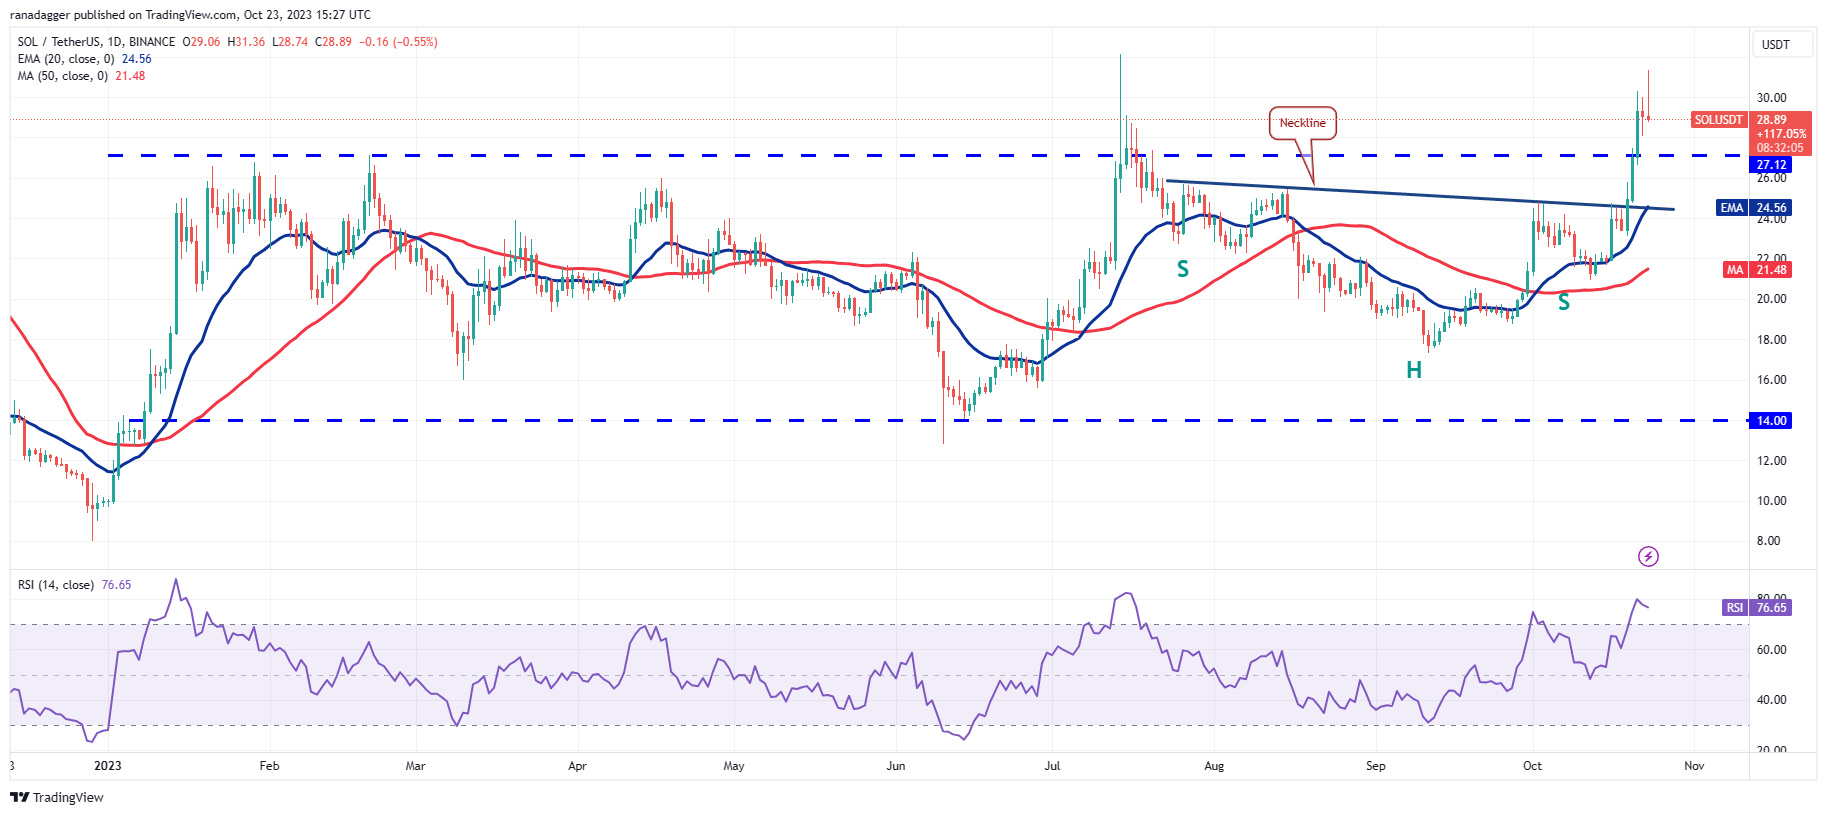
The bears attempted to initiate a pullback in Solana (SOL) on Oct. 22, but the bulls did not relinquish much ground. This indicates that the bulls are not rushing to close their positions, anticipating that the upward movement will persist.
 SOL/USDT daily chart. Source: TradingView
Buying resumed on Oct. 23, and the bulls began their ascent toward the pattern target of $32.81, but the bears again sold at higher levels.
The recent sharp increase has pushed the RSI into overbought territory, indicating that a minor correction or consolidation may be on the horizon. If the SOL/USDT pair declines from the current level, the bulls will attempt to halt the drop at $27.12 and then at the 20-day EMA ($24.56).
Related: Bitcoin price must break $31K to avoid 2023 'bearish fractal'
Cardano price analysis
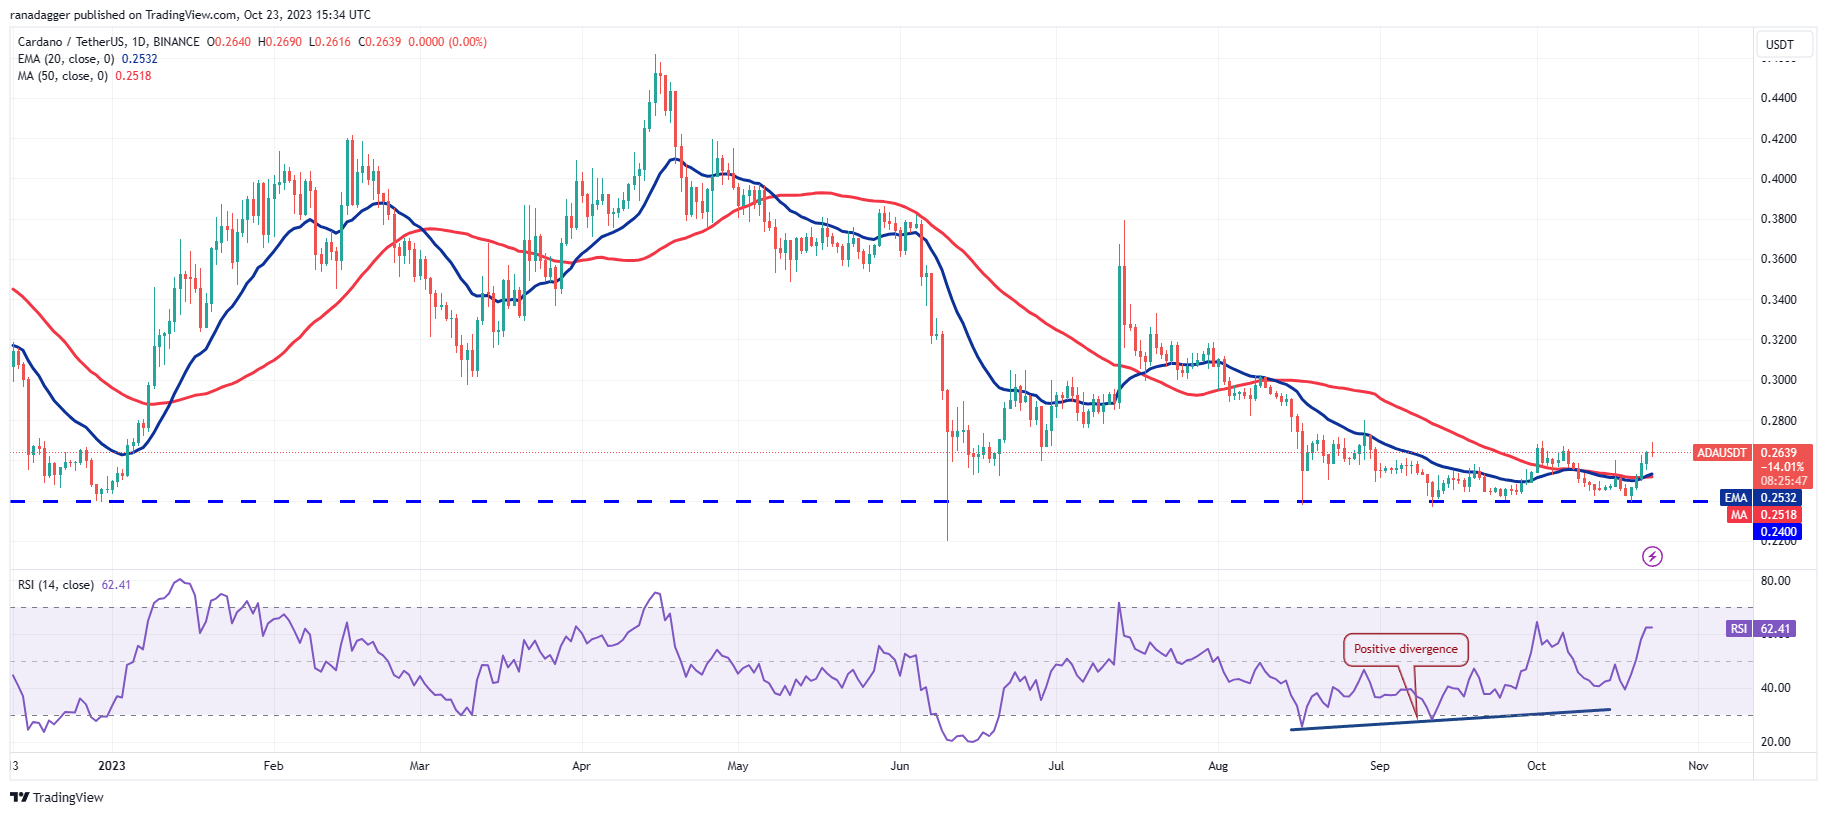
Cardano (ADA) sharply rebounded from $0.24 on Oct. 19 and moved above the moving averages on Oct. 21.
 ADA/USDT daily chart. Source: TradingView
Buying intensified, and the bulls are attempting to push the price above the resistance zone between $0.27 and $0.28. If successful, the ADA/USDT pair will complete a triple bottom pattern, signaling the beginning of a sustained recovery. The pair may rise to $0.32 and then to $0.38.
If the bears wish to thwart this upward movement, they must pull the price back below the moving averages. A break and close below $0.24 would shift the advantage to the bears.
Dogecoin price analysis
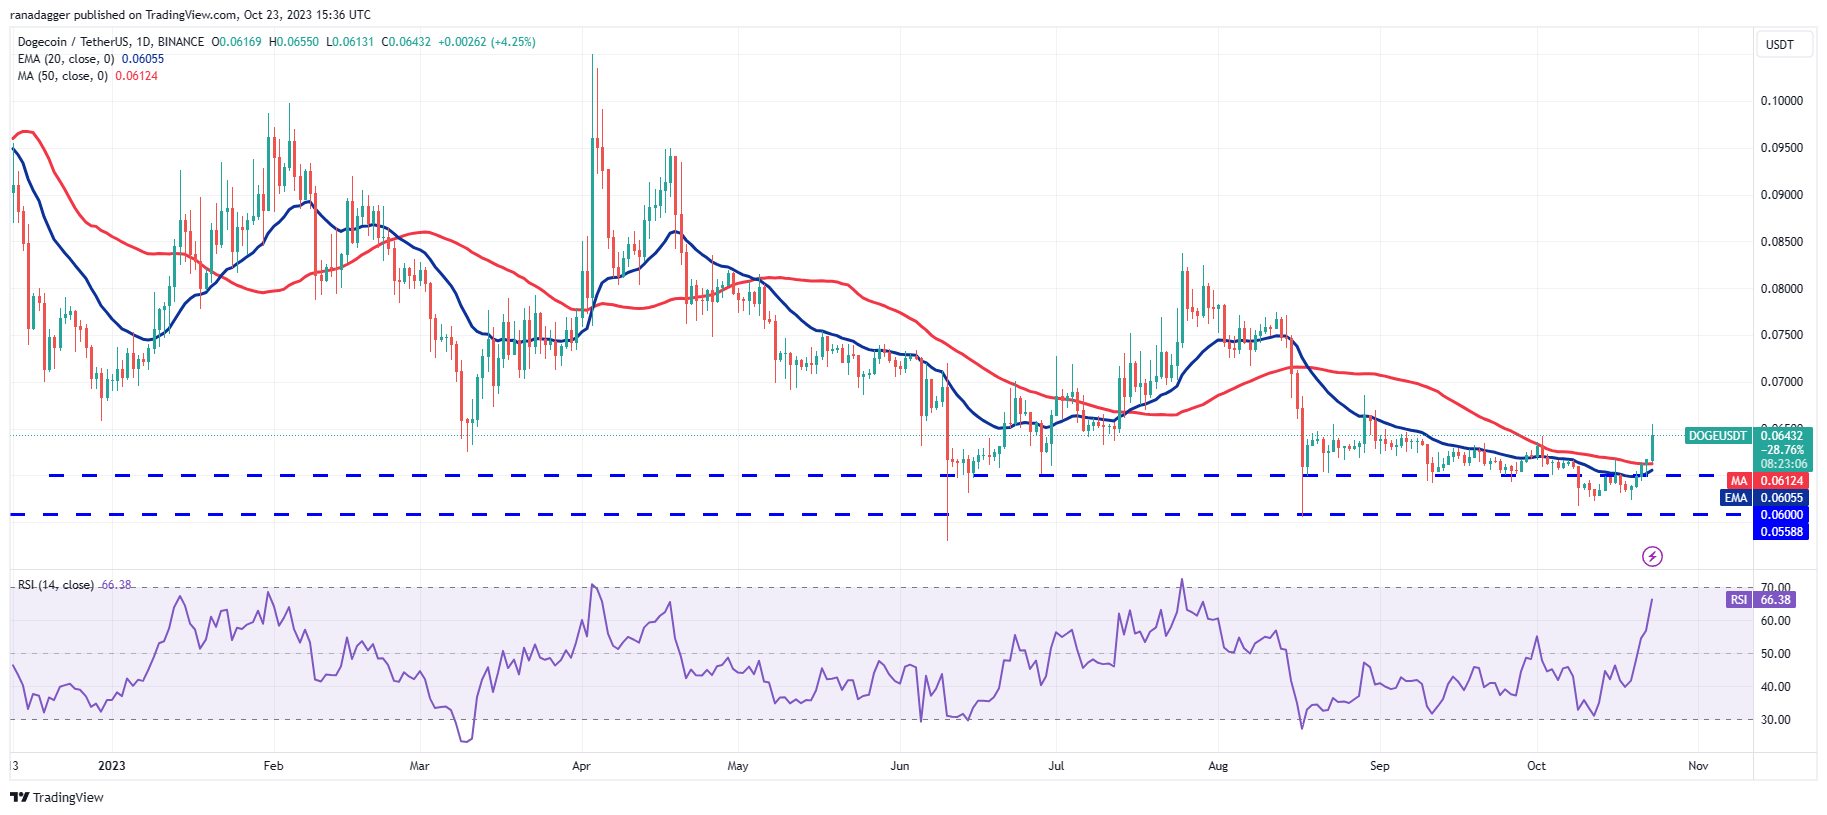
Dogecoin (DOGE) broke and closed above the 50-day SMA ($0.06) on Oct. 22, signaling the commencement of a relief rally.
 DOGE/USDT daily chart. Source: TradingView
The 20-day EMA ($0.06) has begun to trend upward, and the RSI has entered positive territory, indicating that the bulls are attempting to take control. If the price remains above the 50-day SMA, the DOGE/USDT pair could rise to $0.07. This level may again present a challenge, but if surpassed, the pair may jump to $0.08.
The key support to monitor on the downside is $0.06. If this level is breached, it will indicate that the bears are regaining control. The pair may then decline to the critical support at $0.055.
Toncoin price analysis
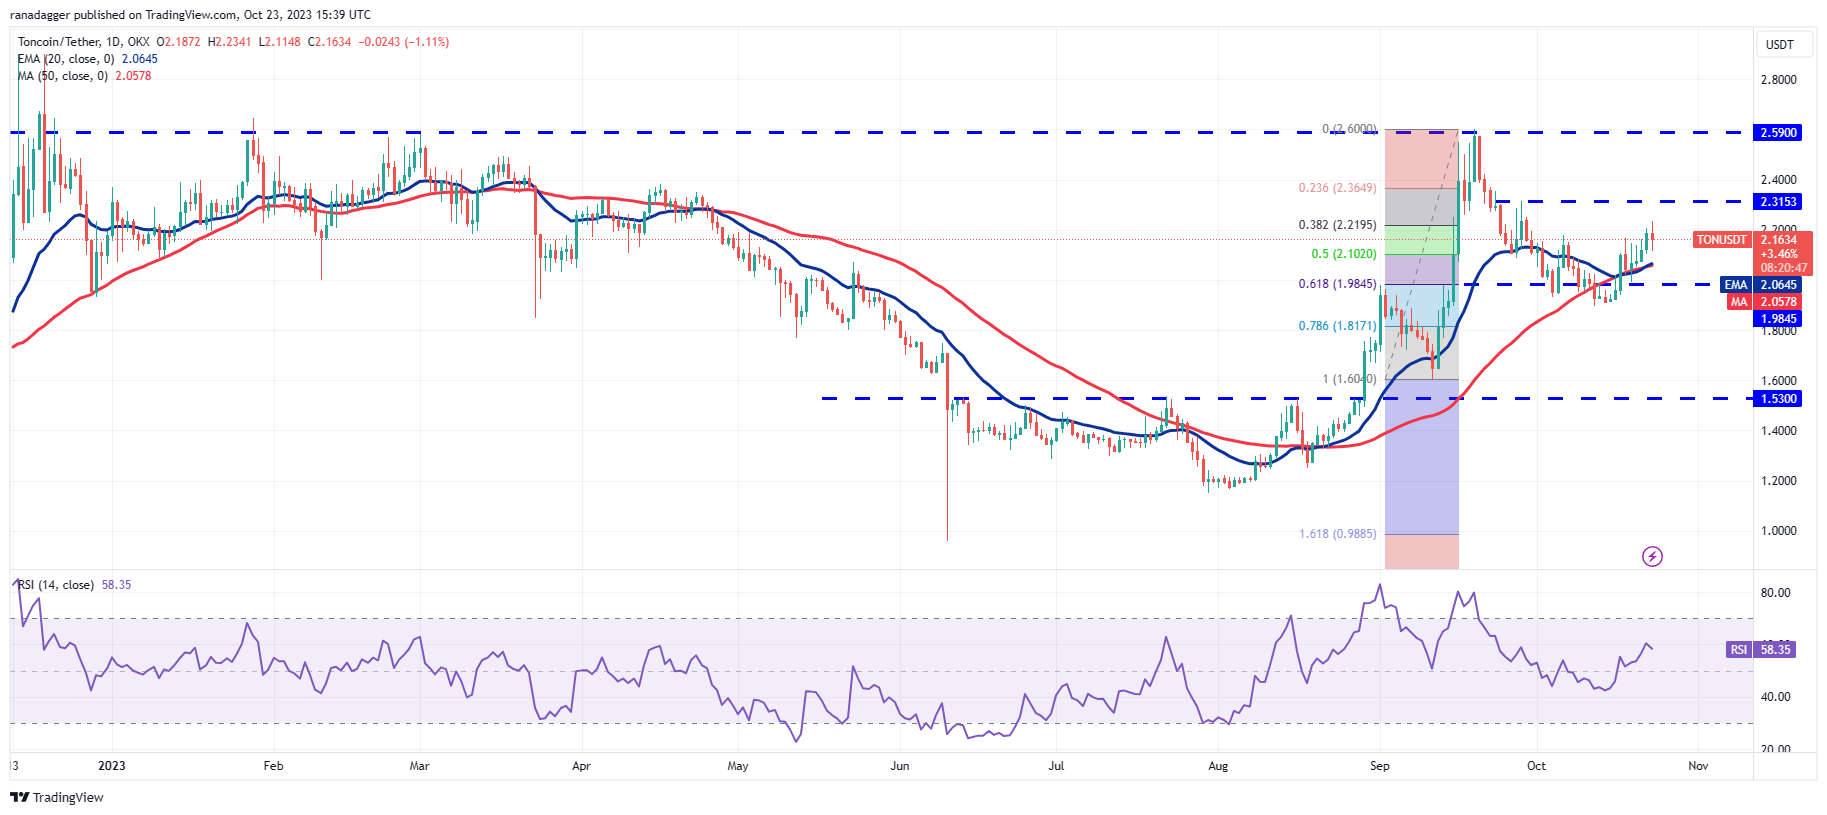
Toncoin (TON) broke above the immediate resistance at $2.18 on Oct. 22, signaling the end of the corrective phase.
 TON/USDT daily chart. Source: TradingView
Both moving averages are trending upward, and the RSI is in positive territory, indicating that the bulls have a slight advantage. The TON/USDT pair could rise to $2.31 and then to $2.59, where strong selling from the bears is expected.
In the event of a dip, the bulls are likely to defend the moving averages. A break and close below this support would suggest that the bulls may be losing their grip, potentially pulling the price down to $1.89.
This article does not contain investment advice or recommendations. Every investment and trading move involves risk, and readers should conduct their own research when making a decision.