Disclaimer: Information found on CryptoreNews is those of writers quoted. It does not represent the opinions of CryptoreNews on whether to sell, buy or hold any investments. You are advised to conduct your own research before making any investment decisions. Use provided information at your own risk.
CryptoreNews covers fintech, blockchain and Bitcoin bringing you the latest crypto news and analyses on the future of money.
Buyers are struggling to keep Bitcoin (BTC) above the $27,000 mark. Selling pressure intensified following a 0.5% rise in the September producer price index, surpassing the anticipated 0.3% increase. This indicates that inflationary pressures are unlikely to diminish quickly for the U.S. economy.
The uncertain short-term landscape has redirected analysts’ attention to November and the forthcoming halving event anticipated in April 2024. Crypto analyst Miles Deutscher referenced a chart from CryptoCon, suggesting that if historical patterns hold, Bitcoin could begin to rise by November 21, initiating its ascent toward the next halving.
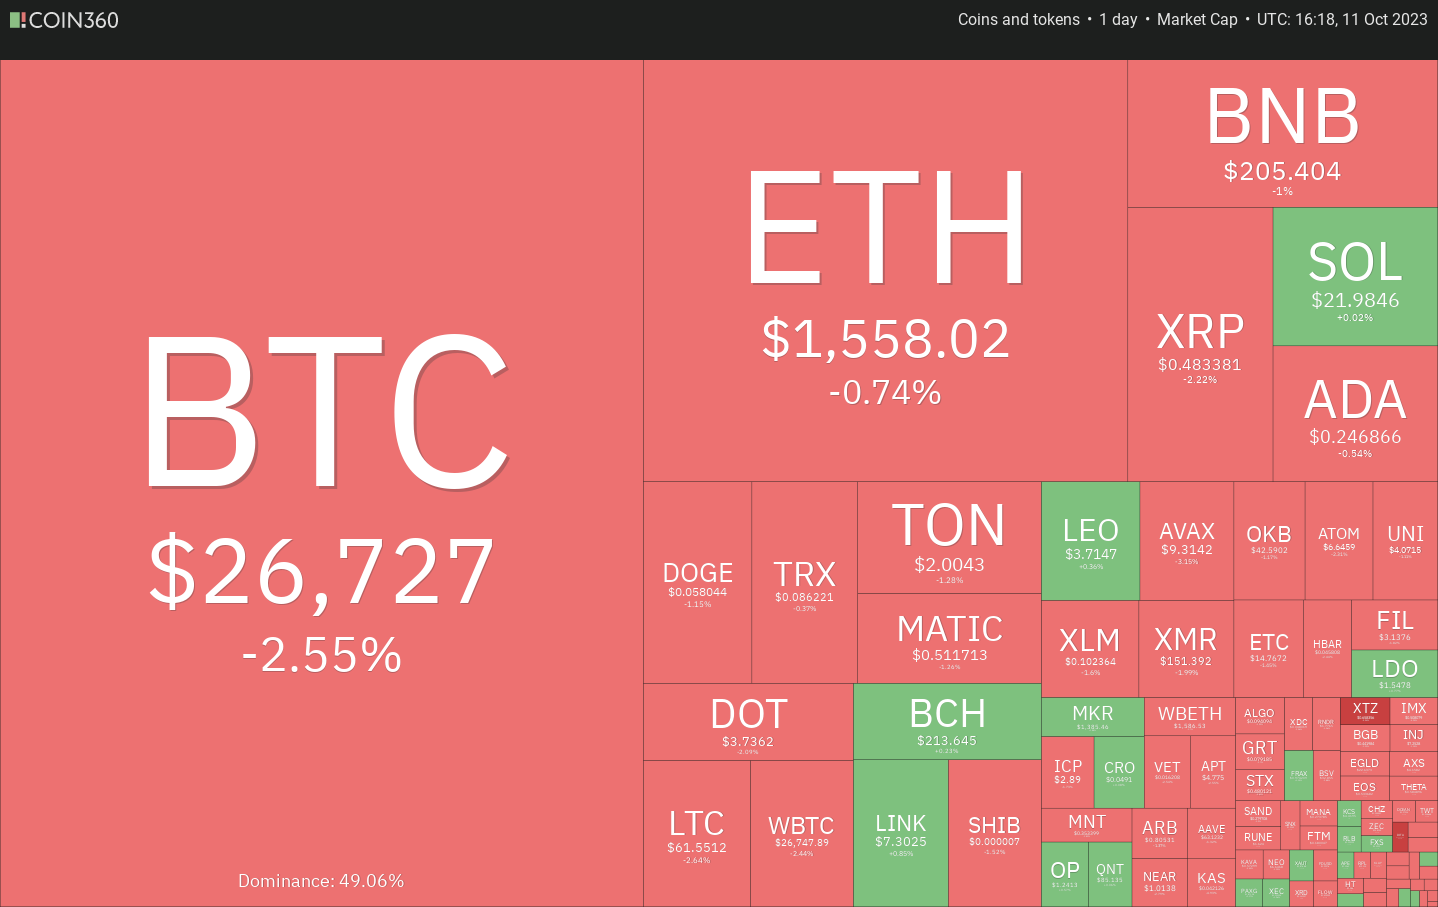 Daily cryptocurrency market performance. Source: Coin360
Looking further ahead to 2026, BitMEX founder Arthur Hayes expresses even greater optimism. During an appearance on Impact Theory with Tom Bilyeu, Hayes projected that Bitcoin’s price could reach between $750,000 and $1 million by 2026. He contends that ongoing money printing by the U.S. government to avert a financial crisis will catalyze a significant bull market across various asset classes.
While several analysts maintain a positive outlook for the long term, the immediate future remains uncertain due to multiple challenges. Will Bitcoin and altcoins manage to recover, or will they continue their downward trend? Let’s examine the charts of the top 10 cryptocurrencies to gain insights.
Bitcoin price analysis
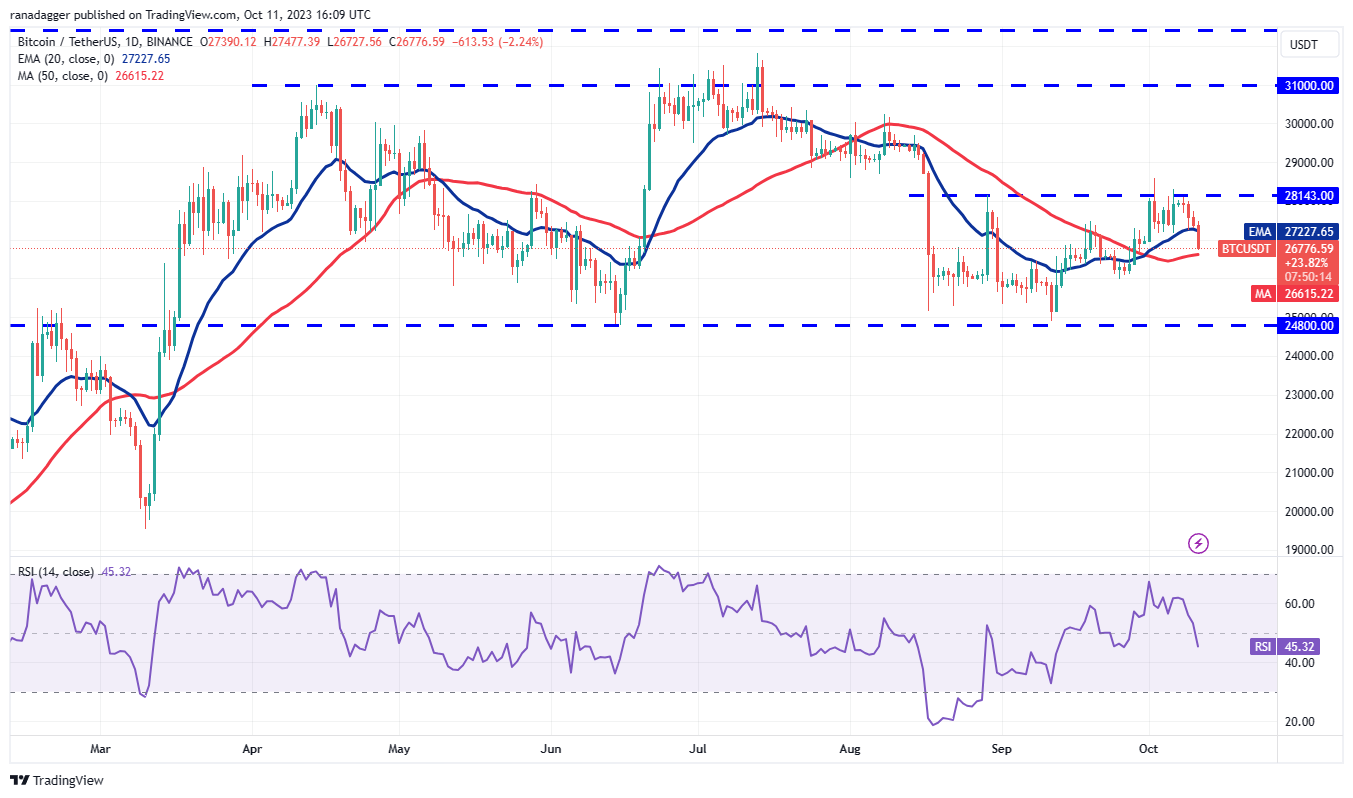
After finding support at the 20-day exponential moving average ($27,227) for the last two days, Bitcoin fell below this level on Oct. 11. This indicates that bears are attempting to take control.
 BTC/USDT daily chart. Source: TradingView
The next support level to monitor on the downside is the 50-day simple moving average ($26,615). A breach of this level would suggest that traders are eager to exit. The BTC/USDT pair could then decline to $26,000 and potentially retest the support at $24,800.
If the price bounces off the 50-day SMA, bulls will attempt to push the price above the 20-day EMA. This could pave the way for a potential rally to $28,143.
The flat 20-day EMA and the relative strength index (RSI) just below the midpoint indicate a possible range-bound movement in the near term.
Ether price analysis
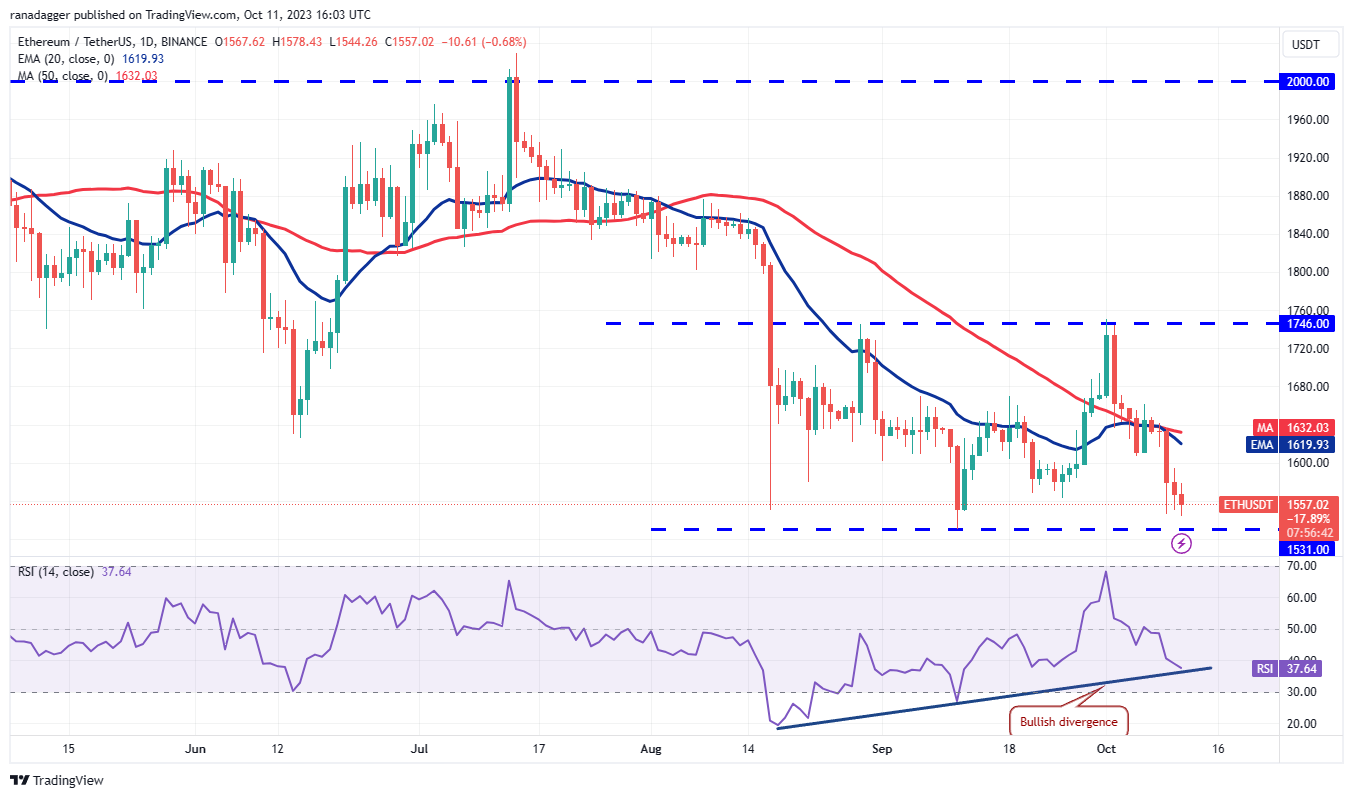
Ether (ETH) has been attracting buyers near the $1,531 support level for the past two days, which is a positive indicator. This suggests that the price may continue to oscillate between $1,531 and $1,746 for a while longer.
 ETH/USDT daily chart. Source: TradingView
The positive divergence on the ETH/USDT pair indicates that selling pressure may be easing near $1,531. This could trigger a relief rally, potentially reaching the 20-day EMA ($1,619). If the price declines from this level, bears will likely make another attempt to push the pair below $1,531 and initiate a downward move to $1,368.
Conversely, a rise above the moving averages would suggest strong accumulation at lower levels. The pair may then aim for a rally to $1,746. While bulls may find it challenging to surpass this level, if they succeed, the pair could rise to $1,961.
BNB price analysis
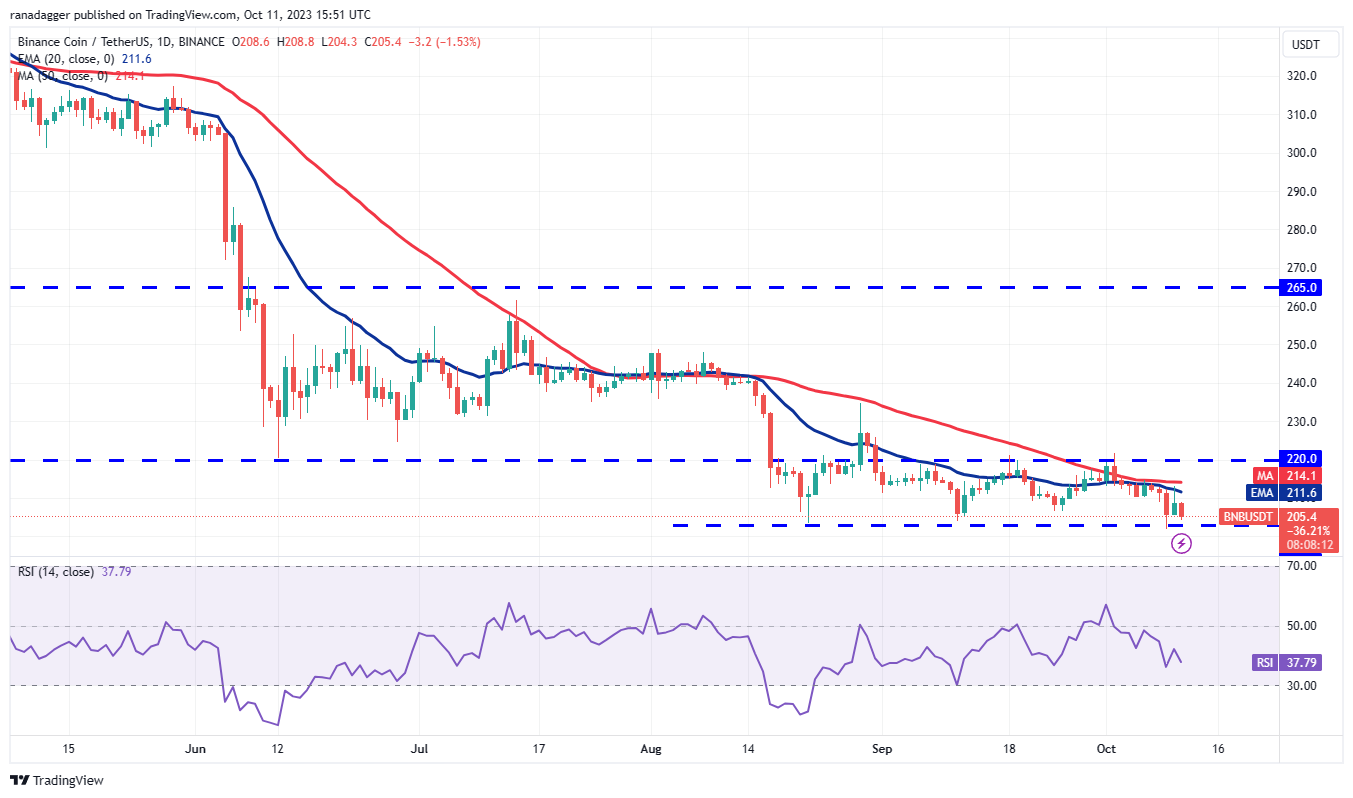
BNB (BNB) fell below the uptrend line on Oct. 9 but rebounded from the robust support at $203. This indicates that the price is currently range-bound between $203 and $220.
 BNB/USDT daily chart. Source: TradingView
The long wick on the Oct. 10 candlestick suggests that bears are selling into rallies toward the moving averages. The bears intensified their efforts by pushing the price below $203.
The next significant move is likely to occur with a break below $203 or a rally above $220. If the $203 support fails, the BNB/USDT pair may plummet to $183. Conversely, a rise above $220 could open the path for a potential rally to $235 and subsequently to $250.
XRP price analysis
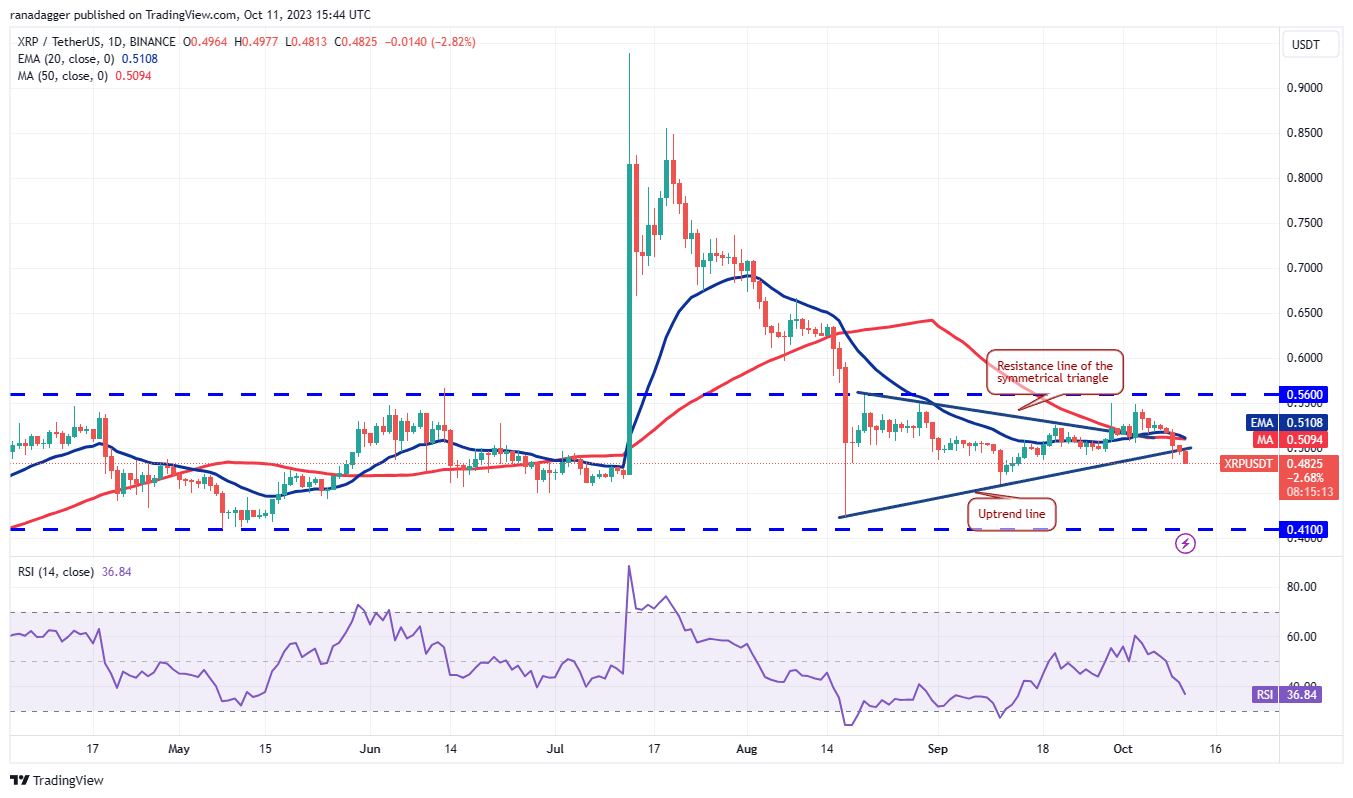
Buyers were unable to capitalize on the breakout above the symmetrical triangle and surpass the resistance at $0.56. This indicates that XRP’s (XRP) demand diminishes at higher levels.
 XRP/USDT daily chart. Source: TradingView
The price declined and fell below the moving averages on Oct. 9. This was the first sign that bulls were losing momentum. Selling intensified on Oct. 11, leading the bears to pull the XRP/USDT pair below the uptrend line. This suggests that the pair may continue to fluctuate between $0.41 and $0.56 for a while longer.
On the downside, the initial support is at $0.46, followed by $0.41. Conversely, any attempts to initiate a recovery are likely to encounter selling pressure at the moving averages and then at $0.56.
Solana price analysis
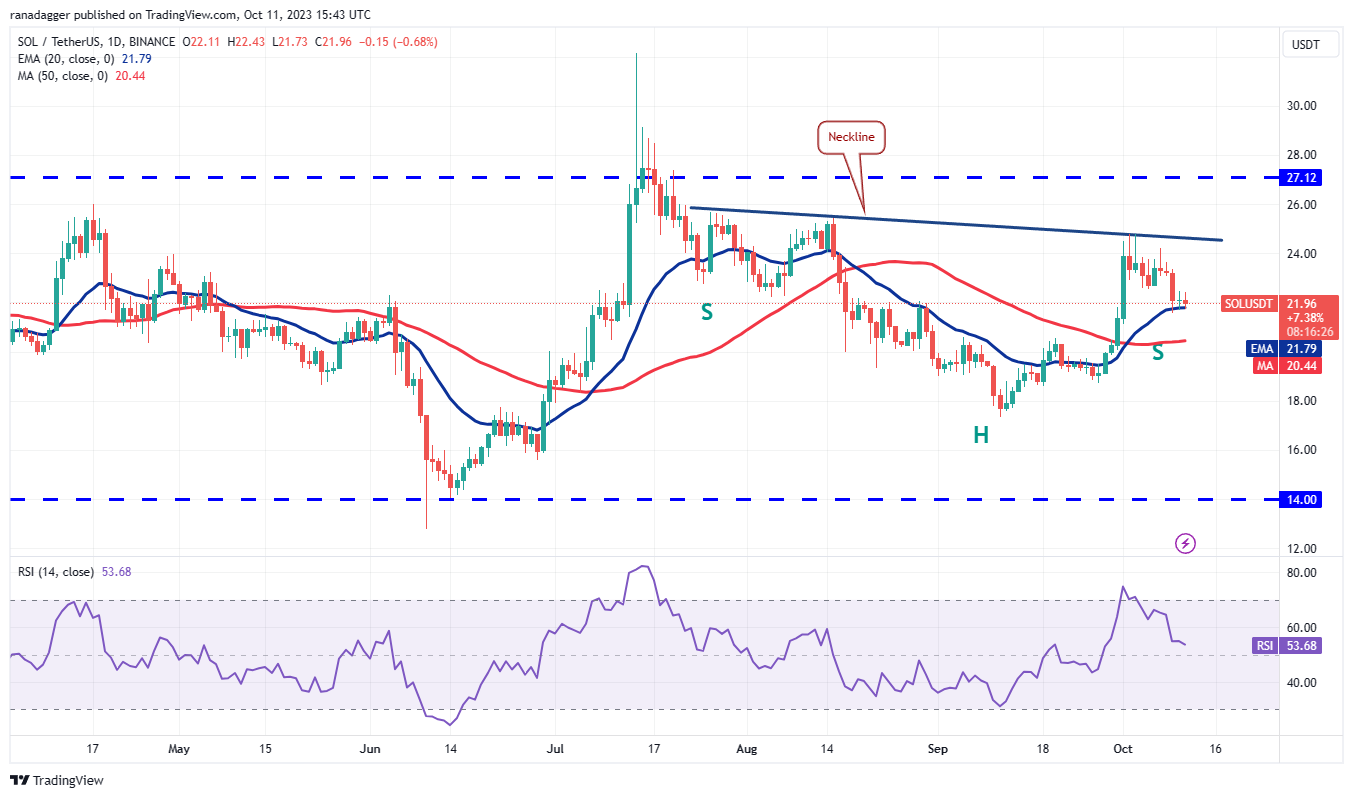
Solana (SOL) is among the stronger major cryptocurrencies, trading above the immediate support at the 20-day EMA ($21.79).
 SOL/USDT daily chart. Source: TradingView
Related Posts
If the price rises from the current level, the SOL/USDT pair will attempt to form a bullish inverted head and shoulders pattern. This reversal setup will be completed with a break and close above the neckline. The target for this setup is $32.81, although its effectiveness may diminish slightly as it has formed within a consolidation.
If bulls do not initiate a strong rebound off the 20-day EMA soon, bears will gain strength. They will then aim to pull the price down to the 50-day SMA ($20.44). If this level fails, the next targets may be $18.50 and subsequently $17.33.
Cardano price analysis
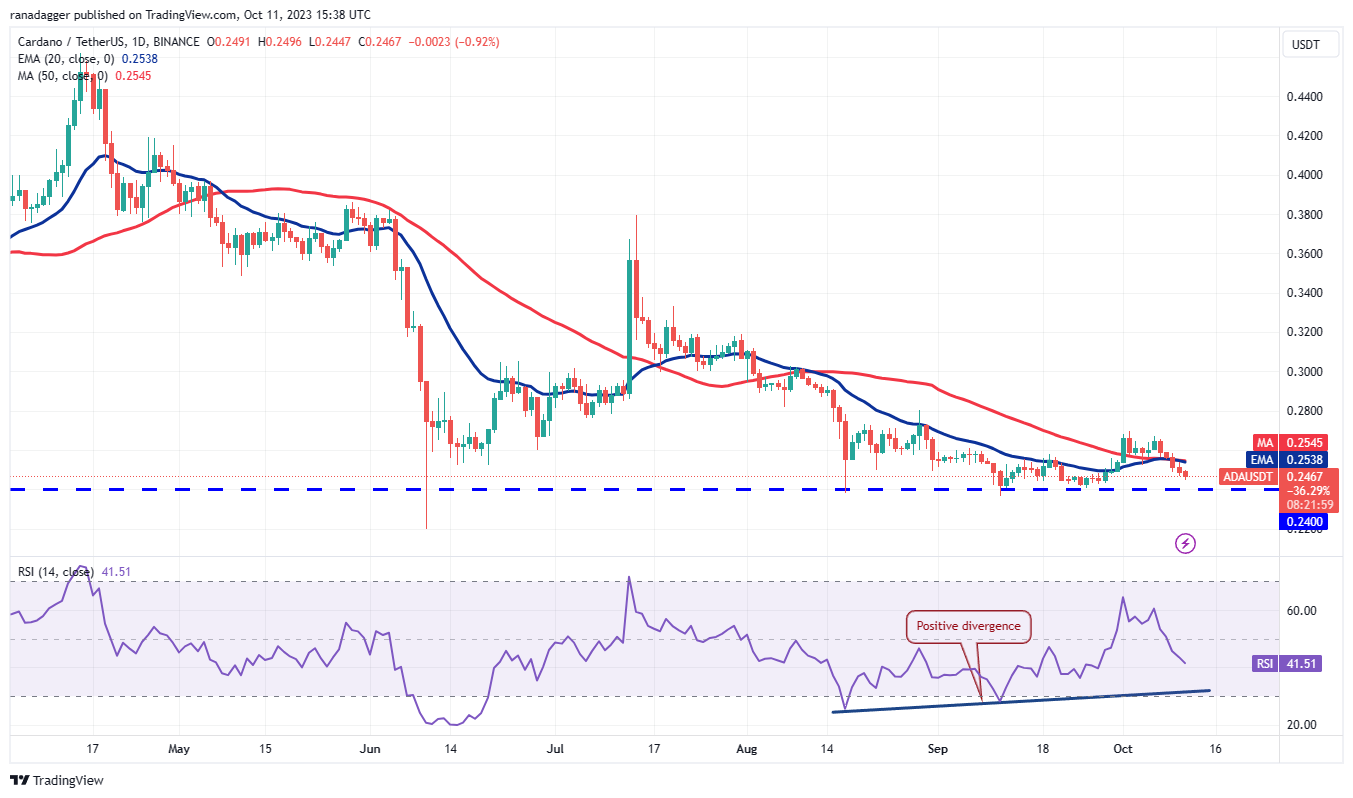
Bears pushed Cardano (ADA) back below the moving averages on Oct. 9, signaling a lack of demand at higher levels.
 ADA/USDT daily chart. Source: TradingView
The ADA/USDT pair may retest $0.24, an important support level to monitor. The positive divergence on the RSI indicates that bulls are likely to defend the $0.24 level vigorously. They will need to push the price above the moving averages to indicate further strength.
Conversely, a break and close below $0.24 will signal the beginning of the next phase of the downtrend. The pair may first decline to $0.22 and eventually to $0.20.
Dogecoin price analysis
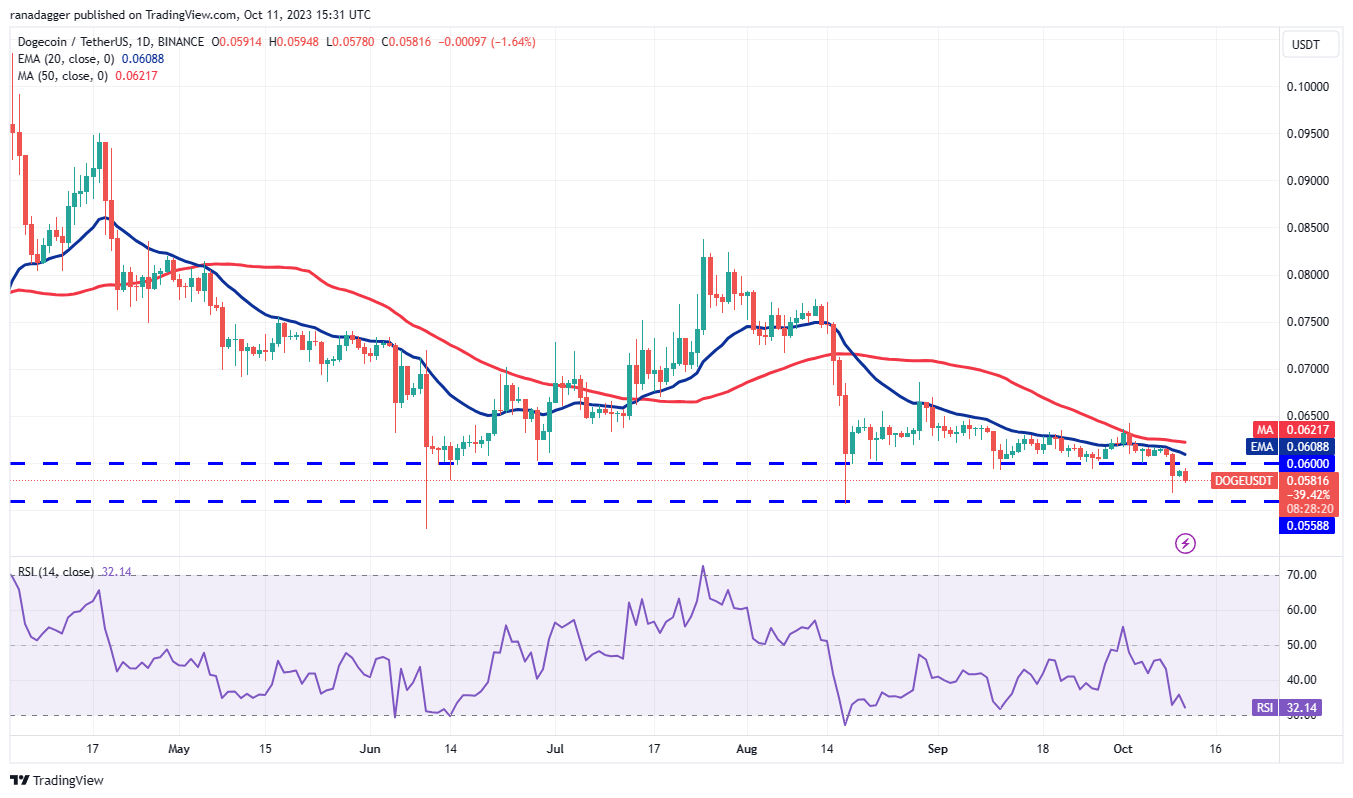
Dogecoin (DOGE) fell sharply and closed below the $0.06 support on Oct. 9, indicating that bears are in control.
 DOGE/USDT daily chart. Source: TradingView
The long tail on the Oct. 9 candlestick indicates that bulls are actively defending the support at $0.055. If buyers wish to make a comeback, they must quickly push the price back above the breakdown level of $0.06 and extend the recovery beyond the moving averages.
If they fail, bears will continue to exert pressure on the $0.055 support. If this level breaks, the DOGE/USDT pair could retest the critical support near $0.05, which is again expected to attract significant buying interest from bulls.
Related: JPMorgan debuts tokenization platform, BlackRock among key clients: Report
Toncoin price analysis
The bulls were unable to maintain Toncoin (TON) above the 20-day EMA ($2.06) on Oct. 7, indicating that bears are selling during relief rallies.
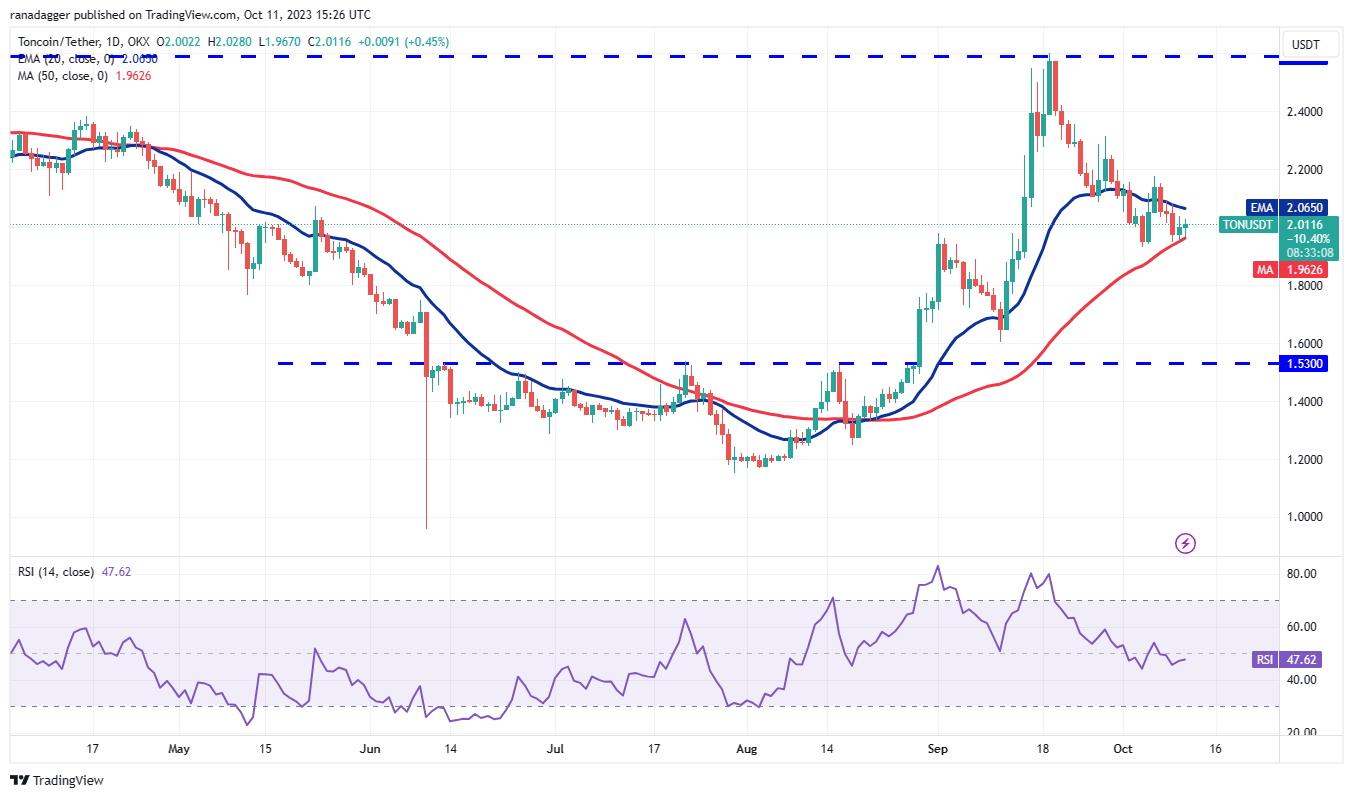 TON/USDT daily chart. Source: TradingView
A minor positive for the bulls is that they have kept the TON/USDT pair above the 50-day SMA ($1.96). Buyers will next attempt to overcome the resistance at the 20-day EMA. If successful, the TON/USDT pair could rise to $2.18 and subsequently to $2.32.
Meanwhile, bears are likely to have other intentions. They will aim to push the price down and sustain it below the 50-day SMA. If they succeed, the pair could begin a downward trend toward $1.60.
Polkadot price analysis
Bears took action on Oct. 9, pulling Polkadot (DOT) below the critical support at $3.91. The bulls attempted to push the price back above the breakdown level on Oct. 10, but the bears maintained their position.
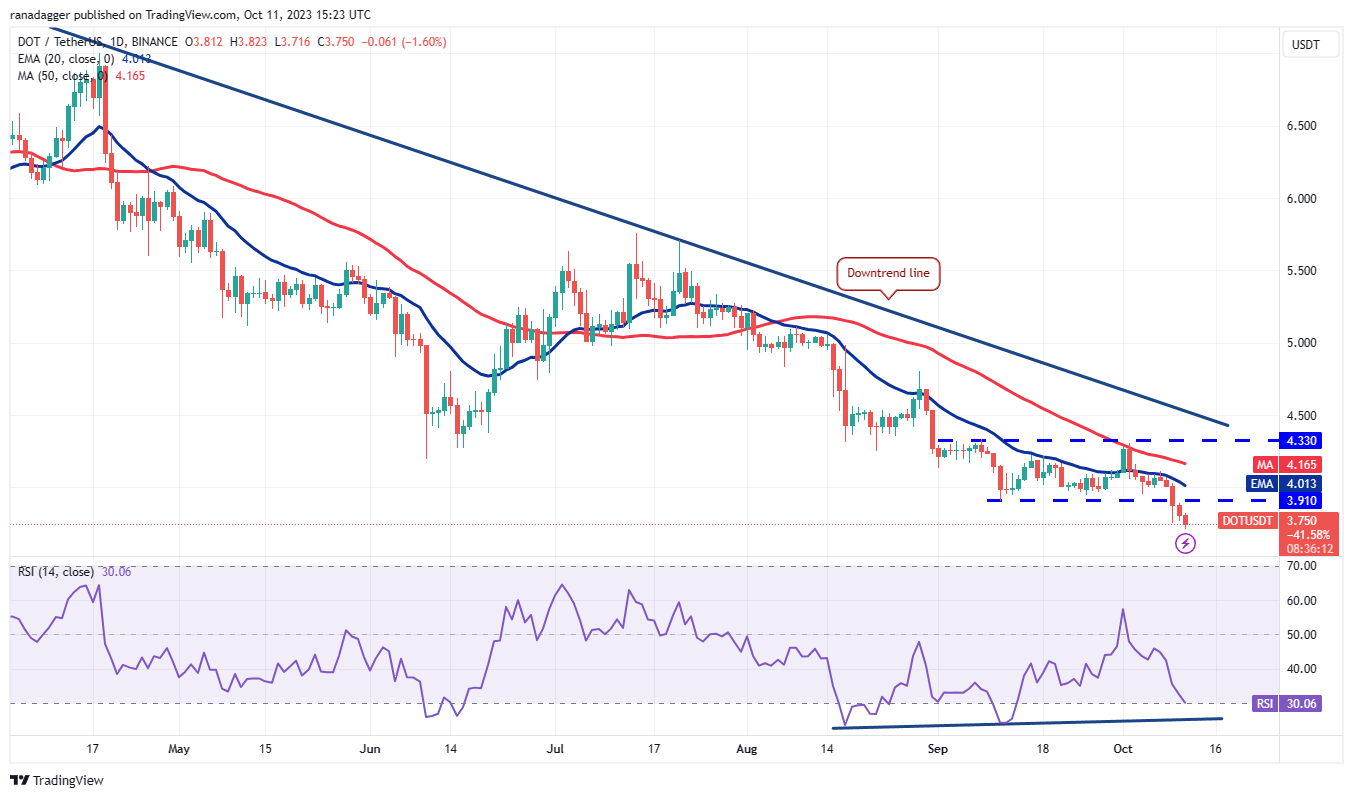 DOT/USDT daily chart. Source: TradingView
Selling resumed on Oct. 11, with bears trying to drive the price down toward the next target at $3.50. Although the declining moving averages suggest that bears remain in control, the positive divergence on the RSI provides a glimmer of hope for bulls that a reversal may be possible.
The first indication of strength will be a break and close above $3.91. This could trap aggressive bears, resulting in a short squeeze. The DOT/USDT pair would then aim for a rally to the 50-day SMA ($4.16).
Polygon price analysis
Polygon (MATIC) declined and fell below the moving averages on Oct. 9, indicating that the range between $0.49 and $0.60 remains intact.
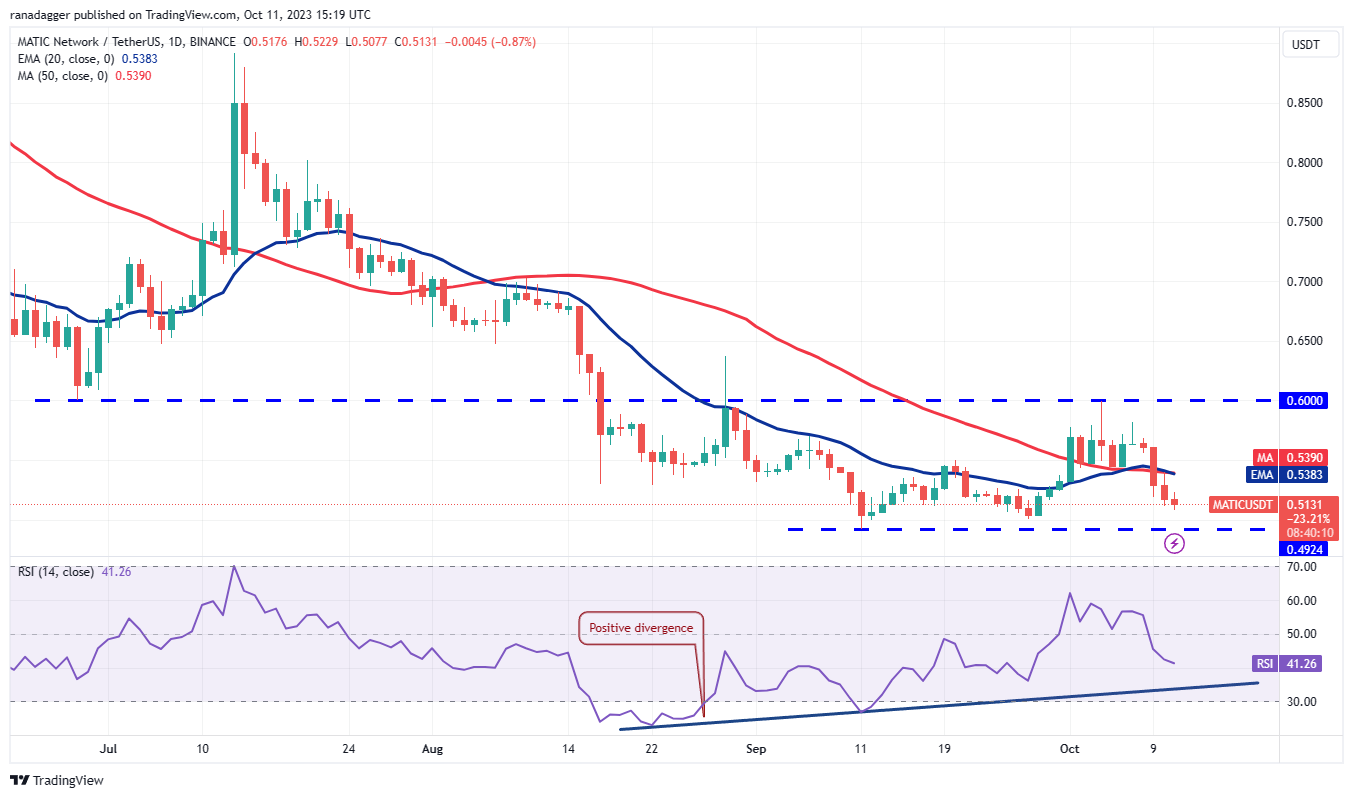 MATIC/USDT daily chart. Source: TradingView
Breaking below the 20-day EMA ($0.53) is a negative sign, placing the responsibility on bulls to defend the critical support at $0.49. If the price rebounds from this level, it would indicate that bulls are still buying on dips. This could keep the MATIC/USDT pair within the range for a longer period.
This neutral outlook will be invalidated in the near term if the price continues to decline and falls below $0.49. The pair would then signal the beginning of the next phase of the downtrend toward $0.45.
This article does not contain investment advice or recommendations. Every investment and trading move involves risk, and readers should conduct their own research when making a decision.