Disclaimer: Information found on CryptoreNews is those of writers quoted. It does not represent the opinions of CryptoreNews on whether to sell, buy or hold any investments. You are advised to conduct your own research before making any investment decisions. Use provided information at your own risk.
CryptoreNews covers fintech, blockchain and Bitcoin bringing you the latest crypto news and analyses on the future of money.
Bitcoin (BTC) is making an effort to trade above $27,000, which is an encouraging development. Recently, Bitcoin’s price remained above $26,000 despite challenging circumstances, including a significant rise in the United States dollar index (DXY) and a sharp decline in the S&P 500 index (SPX). This indicates that selling pressure diminishes at lower price levels.
The United States Securities and Exchange Commission’s choice to postpone the decision on spot Bitcoin exchange-traded funds (ETFs) ahead of schedule also did not negatively impact prices. This suggests that market participants are adopting a long-term perspective on Bitcoin. Bloomberg ETF analyst James Seyffart posits that the regulator made an early decision due to the potential risk of a U.S. government shutdown on October 1.
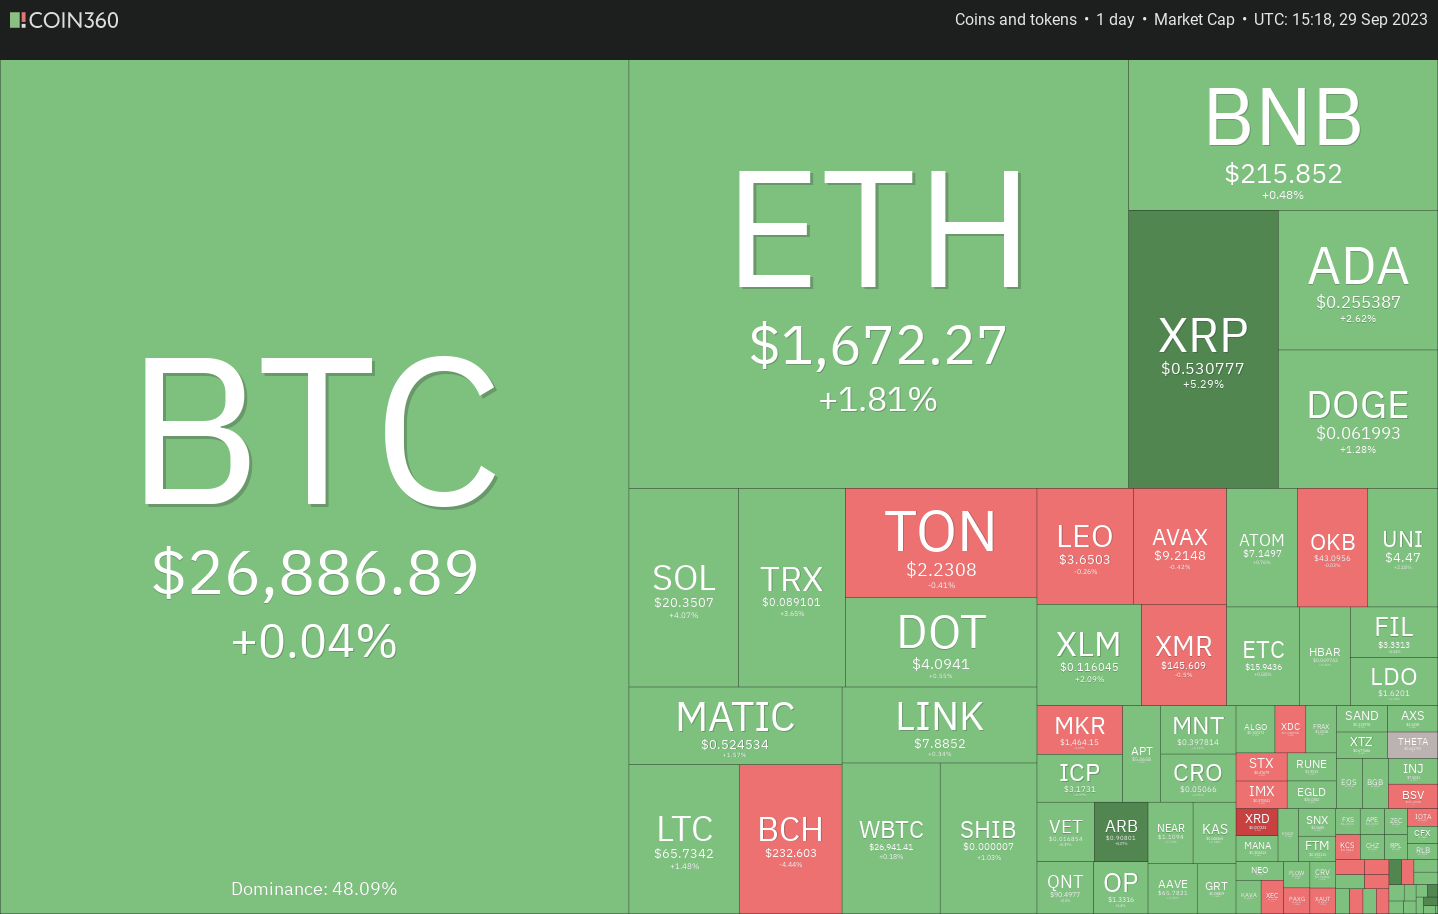 Daily cryptocurrency market performance. Source: Coin360
Bitcoin’s strength over the last few days appears to have enhanced trader sentiment, contributing to a recovery in most major altcoins, which are attempting to surpass their respective resistance levels.
Is it possible for Bitcoin to continue its upward movement in the near future, potentially sparking a revival in the crypto market? Let’s analyze the charts of the top 10 cryptocurrencies to explore this.
Bitcoin price analysis
After facing challenges for several days, the bulls finally pushed Bitcoin above the moving averages on September 28. Currently, the bulls are working to prevent the bears from pulling the price back below the 20-day exponential moving average ($26,534).
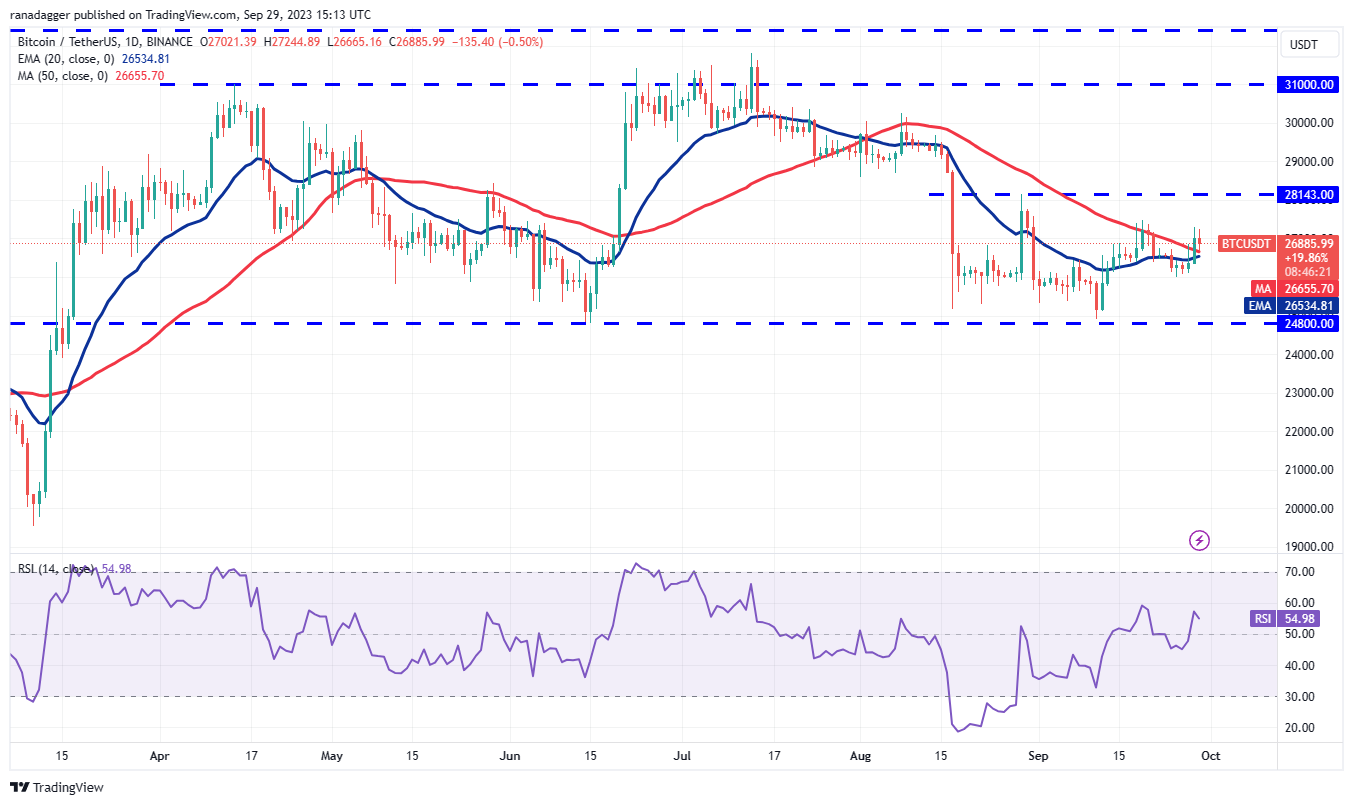 BTC/USDT daily chart. Source: TradingView
The moving averages are nearing a bullish crossover, and the relative strength index (RSI) is in positive territory, suggesting that the path of least resistance is upward. There is minor resistance at $27,500, but it is likely to be surpassed.
The BTC/USDT pair could then advance to the overhead resistance at $28,143. This level is expected to see a significant contest between the bulls and the bears.
On the downside, the $26,000 level is crucial to monitor. If this level is breached, the advantage will shift to the bears, potentially leading the pair to plunge to the strong support at $24,800.
Ether price analysis
Ether (ETH) rose and closed above the 20-day EMA ($1,622) on September 28, indicating a reduction in selling pressure. Buyers continued to purchase and overcame the hurdle at the 50-day simple moving average ($1,660) on September 29.
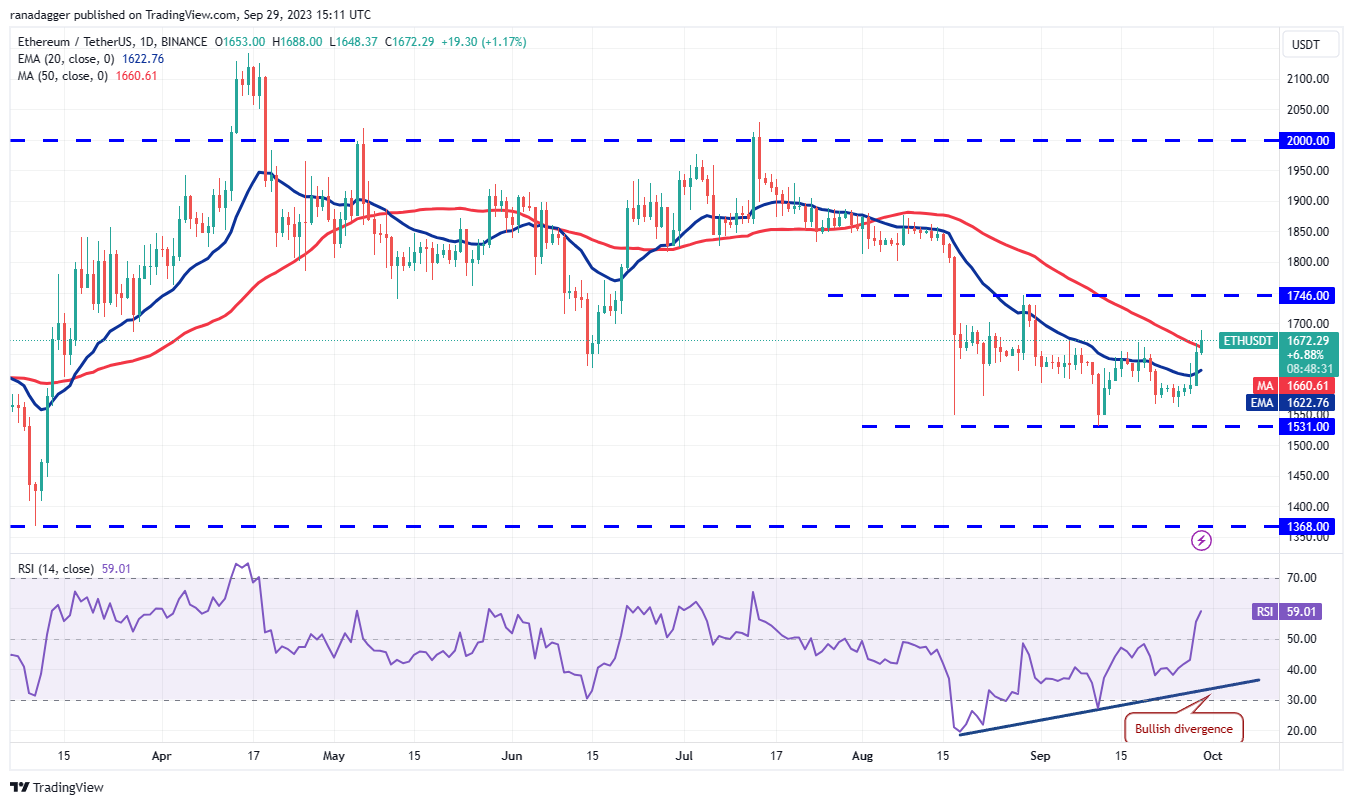 ETH/USDT daily chart. Source: TradingView
The bulls will aim to push the price to the overhead resistance of $1,746. This level is significant to watch because if buyers break through this barrier, the ETH/USDT pair will complete a double bottom pattern. This reversal setup has a target objective of $1,961.
Conversely, if the price declines from $1,746, it will suggest that the bears are still active sellers during rallies. The price could then retreat to the 20-day EMA. If the price rebounds from this support, it will improve the chances of a rally above $1,746. The bears will regain control if they manage to pull the price back below the 20-day EMA.
BNB price analysis
BNB (BNB) has been trading within the $220 to $203 range for the last few days. The bulls are attempting to push the price to the overhead resistance at $220.
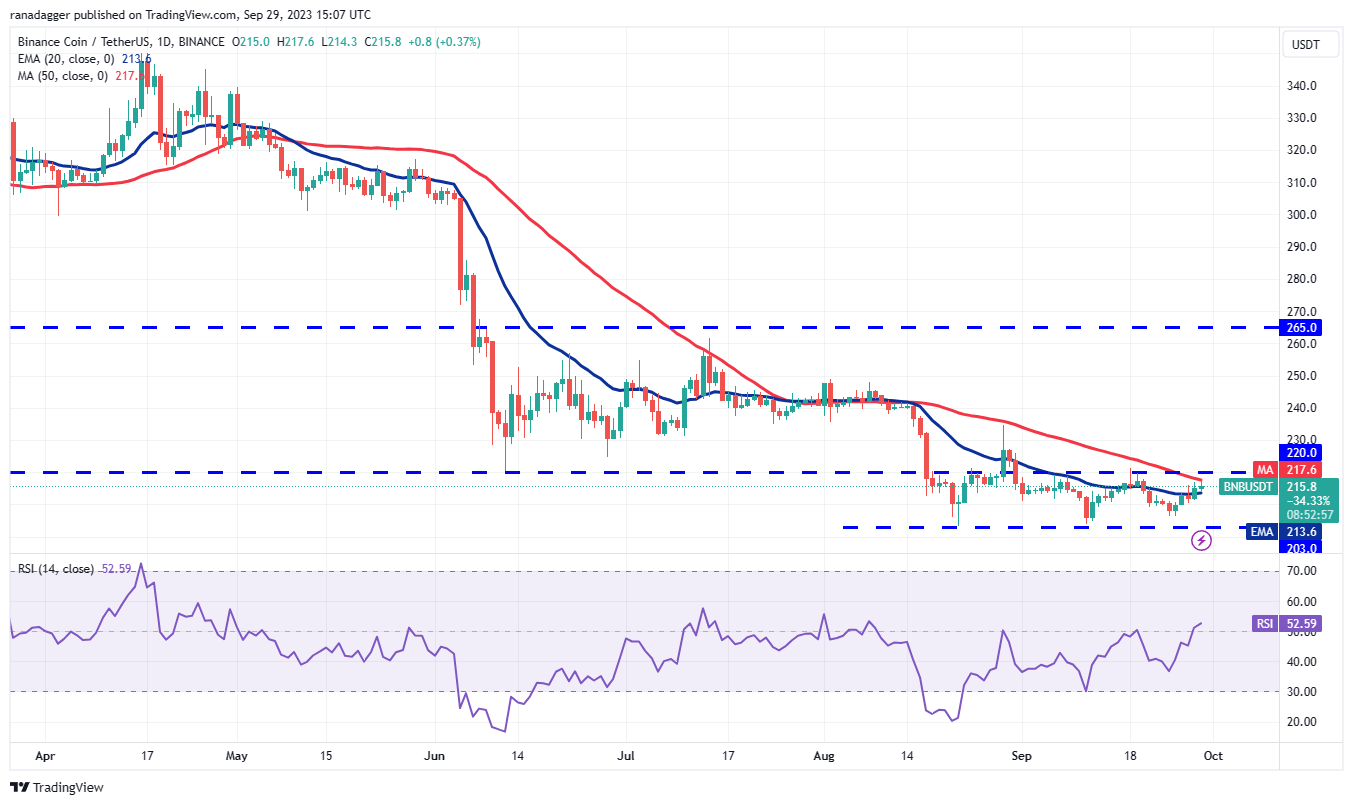 BNB/USDT daily chart. Source: TradingView
The 20-day EMA ($213) is flat, but the RSI has moved into positive territory, indicating that momentum is shifting in favor of the bulls. If the $220 resistance is overcome, the BNB/USDT pair could surge to $235.
If the price sharply declines from $220, it will suggest that the range-bound action may persist for a while longer. The next phase of the downtrend will commence if the bears pull the price below $203.
XRP price analysis
Buyers pushed XRP (XRP) above the 20-day EMA ($0.50) on September 28 and followed that with a move above the resistance line of the symmetrical triangle pattern on September 29.
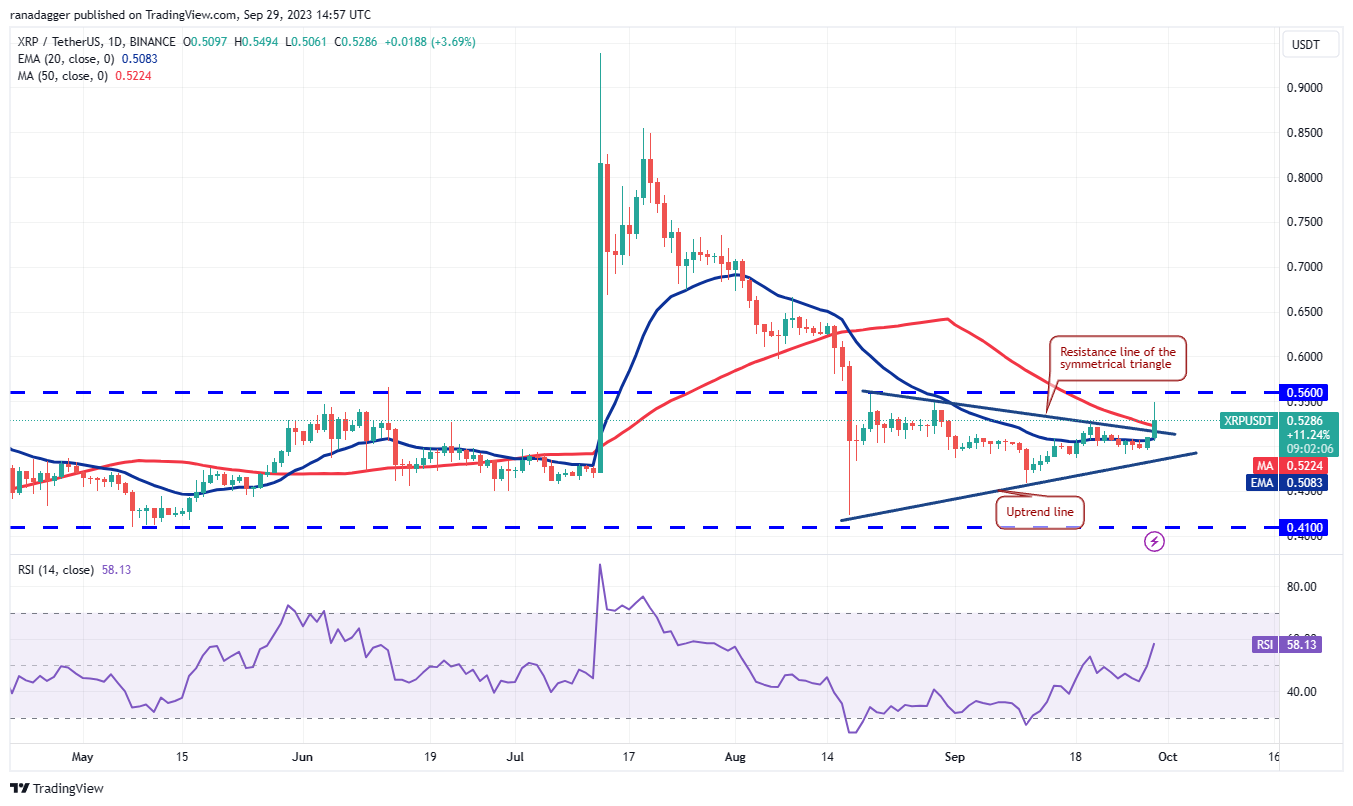 XRP/USDT daily chart. Source: TradingView
If the price remains above the triangle, it will indicate that uncertainty has resolved in favor of the buyers. The XRP/USDT pair could then rally to the overhead resistance at $0.56. This is a key resistance to monitor, as a break above it will clear the way for a potential rally to the pattern target of $0.64.
On the other hand, if the price declines and re-enters the triangle, it will suggest that the market has rejected the higher levels. The bears will then attempt to gain the upper hand by pulling the price below the uptrend line of the triangle.
Cardano price analysis
The bulls are working to maintain Cardano (ADA) above the 20-day EMA ($0.25) on September 29, indicating that the bears are losing their hold.
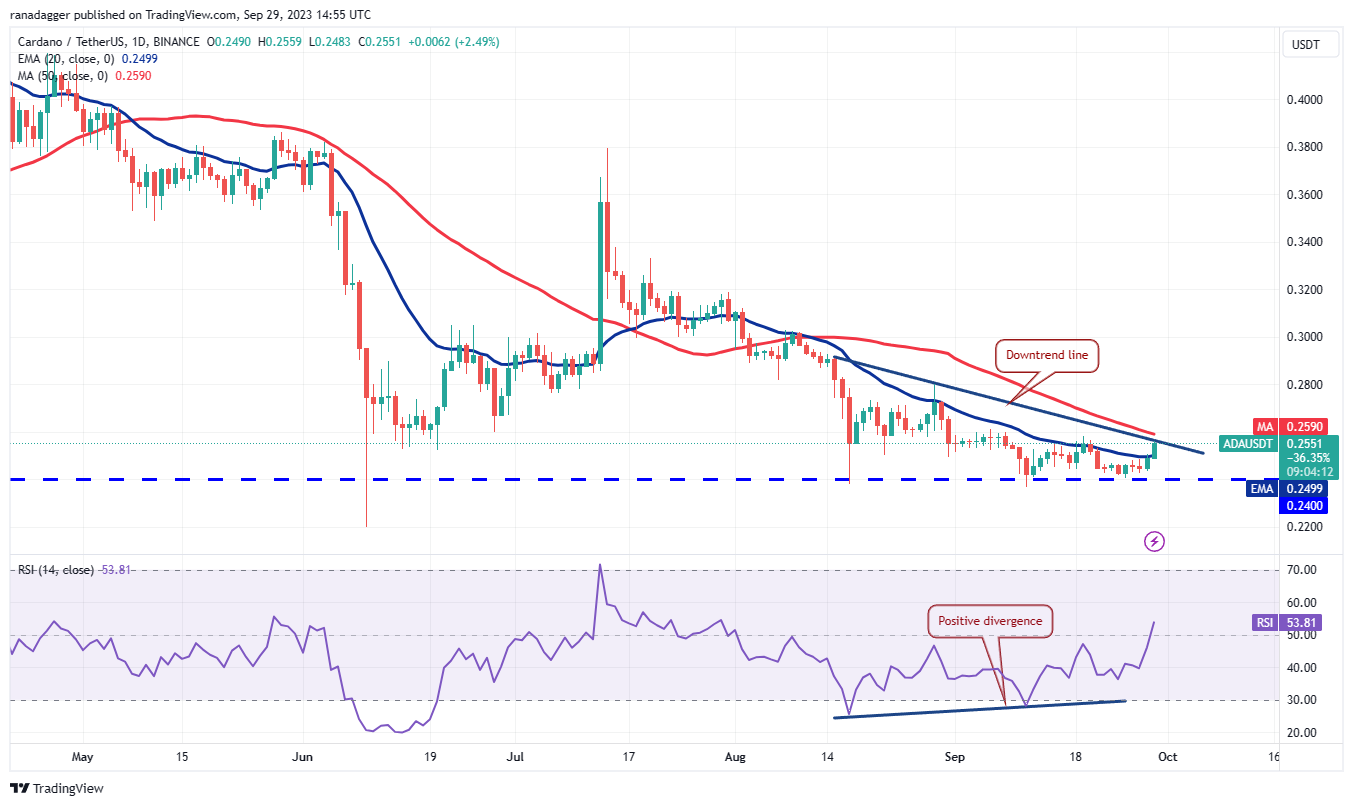 ADA/USDT daily chart. Source: TradingView
Related Posts
A break and close above the downtrend line will invalidate the bearish descending triangle pattern. Typically, the failure of a bearish pattern results in a sharp upward movement as sellers rush to exit their shorts and buyers waiting on the sidelines begin to purchase. This could drive the ADA/USDT pair to $0.29 and subsequently to $0.32.
Time is running out for the bears. If they wish to regain control, they must defend the downtrend line and pull the price below $0.24. The next support on the downside is at $0.22.
Dogecoin price analysis
Dogecoin’s (DOGE) trading range has contracted in recent days, heightening the likelihood of a range expansion in the coming days.
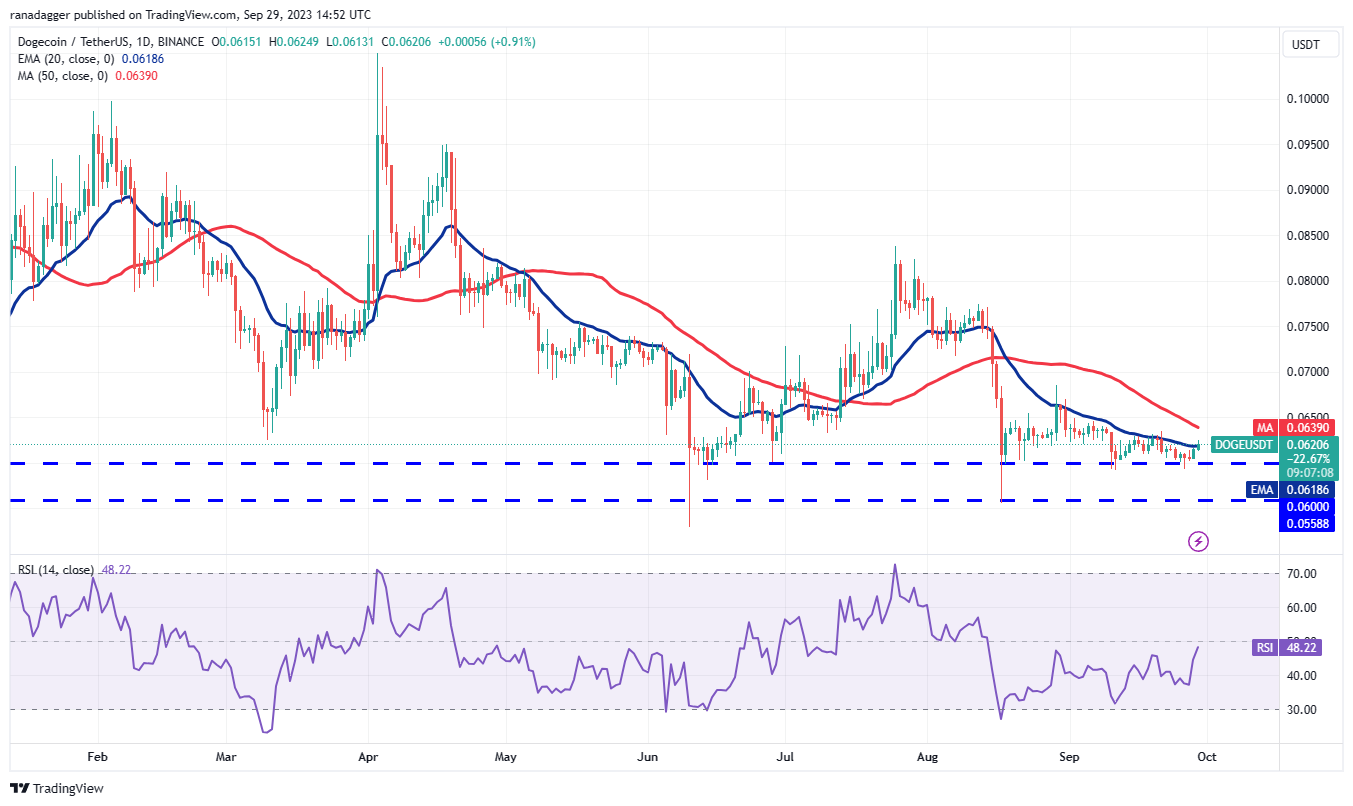 DOGE/USDT daily chart. Source: TradingView
The 20-day EMA ($0.06) is flattening, and the RSI is just below the midpoint, indicating a balance between supply and demand. If buyers push the price above the 20-day EMA decisively, it will signal the beginning of a recovery. The DOGE/USDT pair could first rise to $0.07 and then to $0.08.
If bears want to prevent an upward movement, they must quickly pull the price below $0.06. If they succeed, the pair may drop to the next significant support at $0.055.
Solana price analysis
Solana (SOL) has remained trapped within the broad range of $27.12 to $14 for several days. Trading within a range can be unpredictable and volatile, as bulls typically buy at support and sell near resistance.
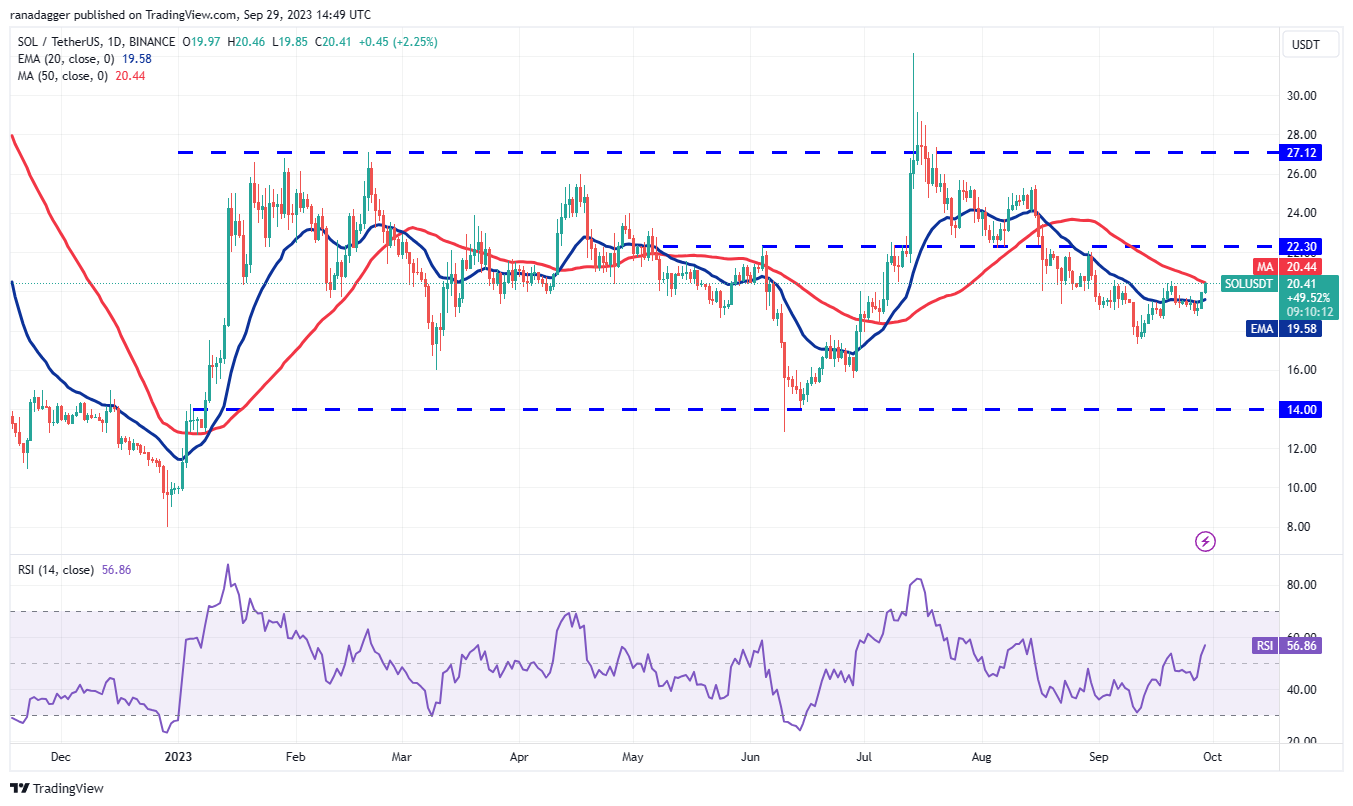 SOL/USDT daily chart. Source: TradingView
The bulls are attempting to initiate a relief rally, which has reached the 50-day SMA ($20.44). This is a crucial level to monitor, as a break above it will suggest that the bulls are regaining control. The SOL/USDT pair could then rise to $22.30.
Conversely, if the price declines from the 50-day SMA, it will indicate that the bears are active at higher levels. Sellers will need to pull the price below $18.50 to open the door for a retest of $17.33.
Related: Why is Ether (ETH) price up today?
Toncoin price analysis
Toncoin (TON) bounced off the 20-day EMA ($2.13) on September 27, indicating that sentiment remains positive and traders are buying on dips.
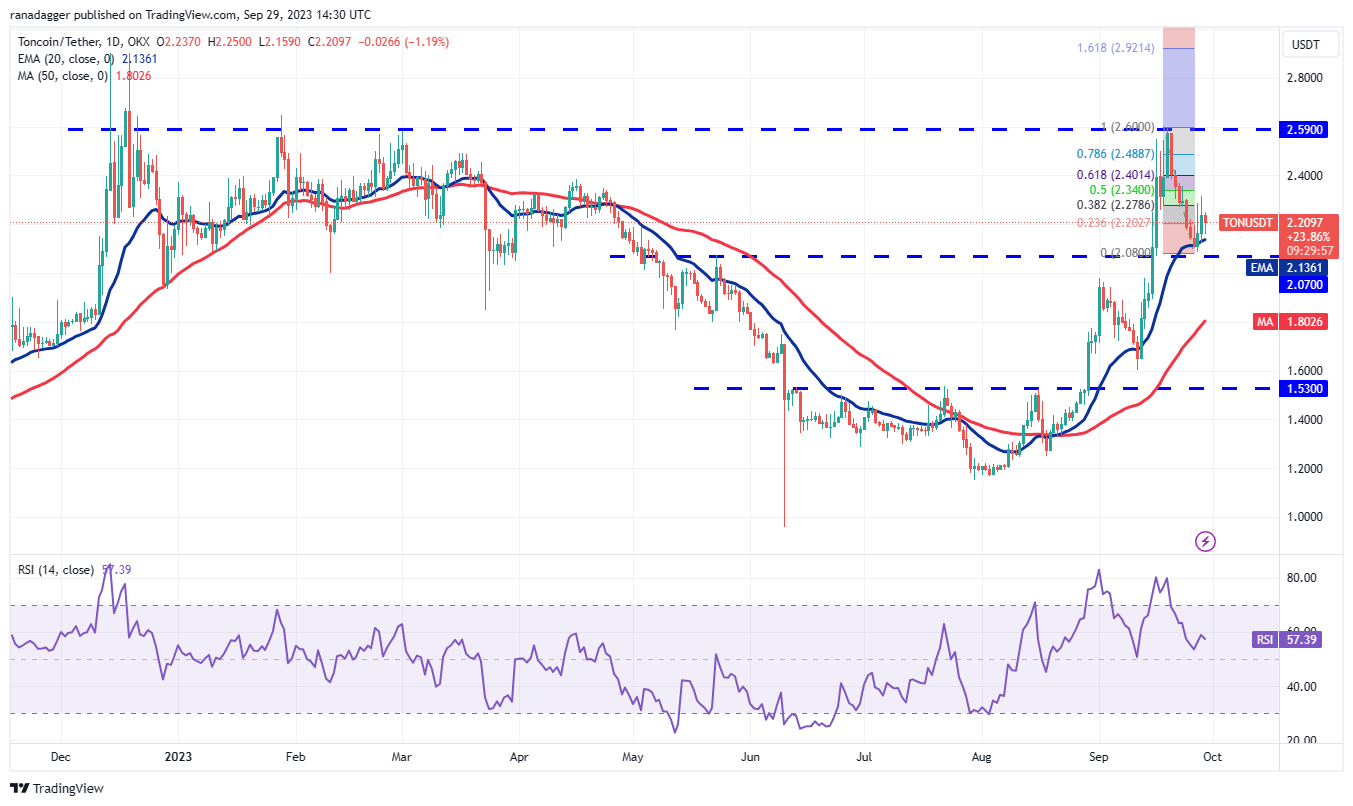 TON/USDT daily chart. Source: TradingView
The long wick on the September 27 and 28 candlestick indicates that the bears are selling at the 38.2% Fibonacci retracement level of $2.28. However, a positive sign for the bulls is that they have managed to keep the price above the 20-day EMA.
Buyers will need to push the price above the 61.8% Fibonacci retracement level of $2.40 to facilitate a retest of the strong overhead resistance at $2.59. This optimistic outlook will be invalidated if the price declines and falls below $2.07.
Polkadot price analysis
The inability of the bears to push Polkadot (DOT) below the $3.91 support suggests that the range-bound action is still in effect.
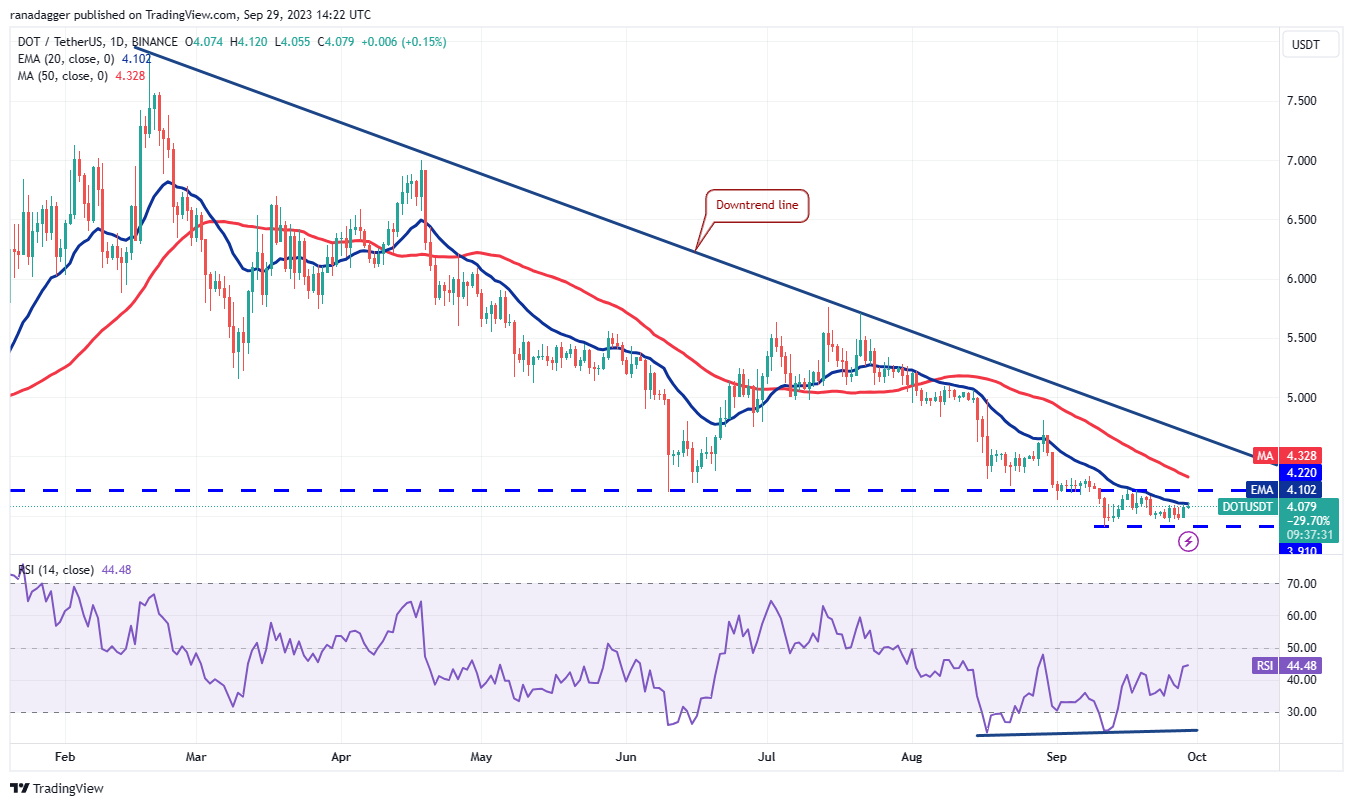 DOT/USDT daily chart. Source: TradingView
Buyers will attempt to drive the price above the 20-day EMA ($4.10) and challenge the overhead resistance at the 50-day SMA ($4.32). If this level is surpassed, the DOT/USDT pair could surge to the downtrend line. The bulls will need to overcome this barrier to indicate a potential trend change.
The key support to monitor on the downside is $3.91. A break below this level will suggest the resumption of the downtrend toward $3.58.
Polygon price analysis
Polygon (MATIC) rebounded from $0.50 on September 28, indicating strong buying at lower levels. The price has reached the 20-day EMA ($0.52), which is a significant level to observe.
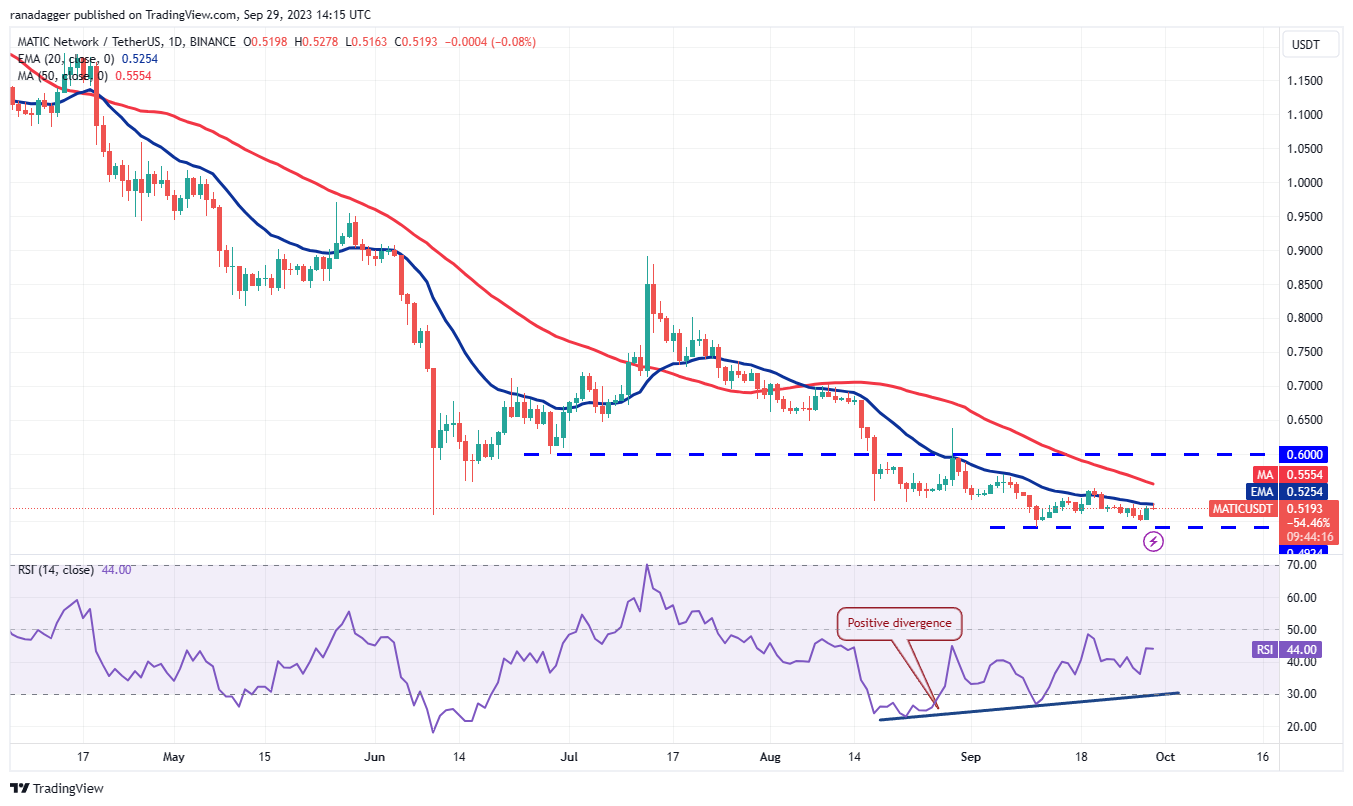 MATIC/USDT daily chart. Source: TradingView
The positive divergence on the RSI suggests that selling pressure is diminishing. This enhances the likelihood of a breakout above the moving averages. The MATIC/USDT pair could then retest the overhead resistance at $0.60, which bears are expected to defend vigorously.
If bears wish to maintain their dominance, they must pull the price below the strong support at $0.49. If this support fails, the pair may decline to $0.45.
This article does not contain investment advice or recommendations. Every investment and trading move involves risk, and readers should conduct their own research when making a decision.