Disclaimer: Information found on CryptoreNews is those of writers quoted. It does not represent the opinions of CryptoreNews on whether to sell, buy or hold any investments. You are advised to conduct your own research before making any investment decisions. Use provided information at your own risk.
CryptoreNews covers fintech, blockchain and Bitcoin bringing you the latest crypto news and analyses on the future of money.
Bitcoin (BTC) has been trading above $33,600 for the last two days, suggesting that the bulls are not eager to exit the market. Following a significant rally, if the price maintains its position, it could trigger FOMO and spark another wave of buying.
This could drive the markets deeper into overbought conditions. Nevertheless, such rallies are seldom sustainable. They typically reverse and retest breakout levels. Therefore, a decline in Bitcoin to $32,000 cannot be dismissed.
The recent rally has elevated Bitcoin’s dominance to 54%, marking its highest point in 30 months. This increase in market dominance indicates that Bitcoin is spearheading the upward movement, which is a favorable sign. It implies that traders are positively viewing the cryptocurrency market, and select altcoins may soon participate in the upward trend.
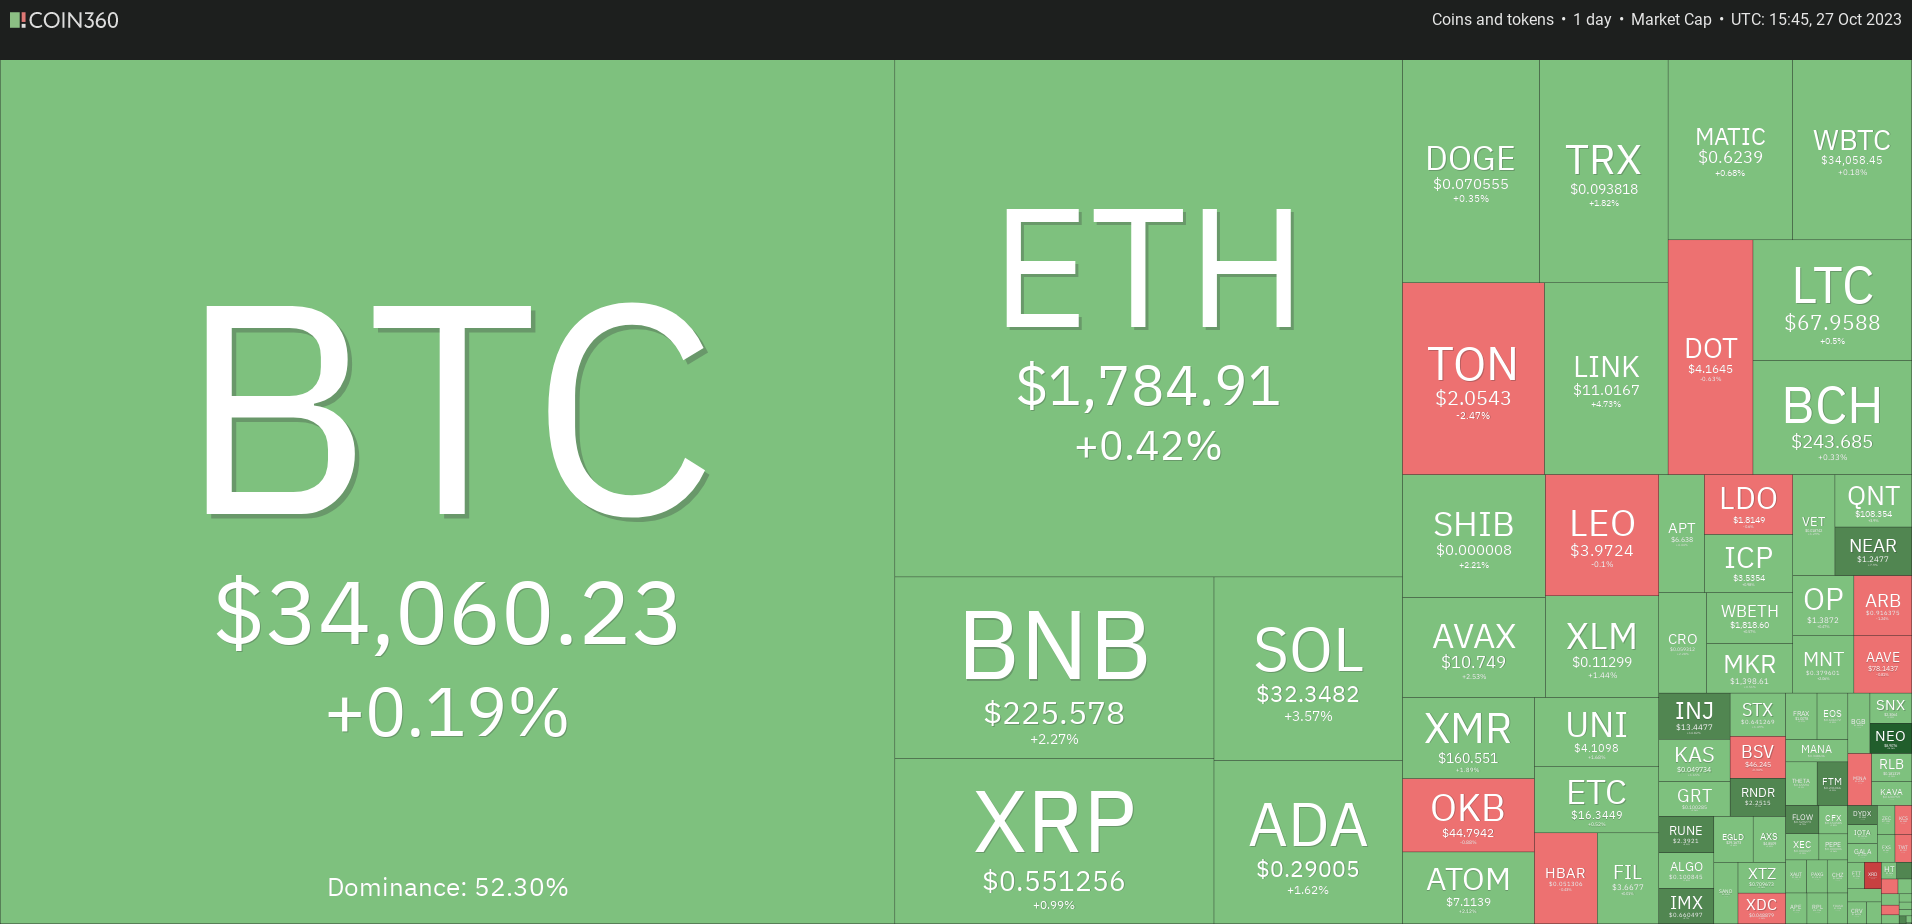 Daily cryptocurrency market performance. Source: Coin360
Experienced trader Peter Brandt mentioned in a post on X (formerly Twitter) on Oct. 26 that Bitcoin has likely reached its bottom, but he cautions that new all-time highs may not materialize until the third quarter of 2024. In the meantime, Brandt anticipates Bitcoin entering a “chop fest.”
Will Bitcoin enter a corrective phase in the coming days, or will it continue its ascent? Will altcoins also rise?
Let’s examine the charts of the top 10 cryptocurrencies to gain insights.
Bitcoin price analysis
Bitcoin is encountering resistance at $35,000, yet the bulls have not relinquished much ground. This indicates that buyers may soon attempt to resume the upward movement.
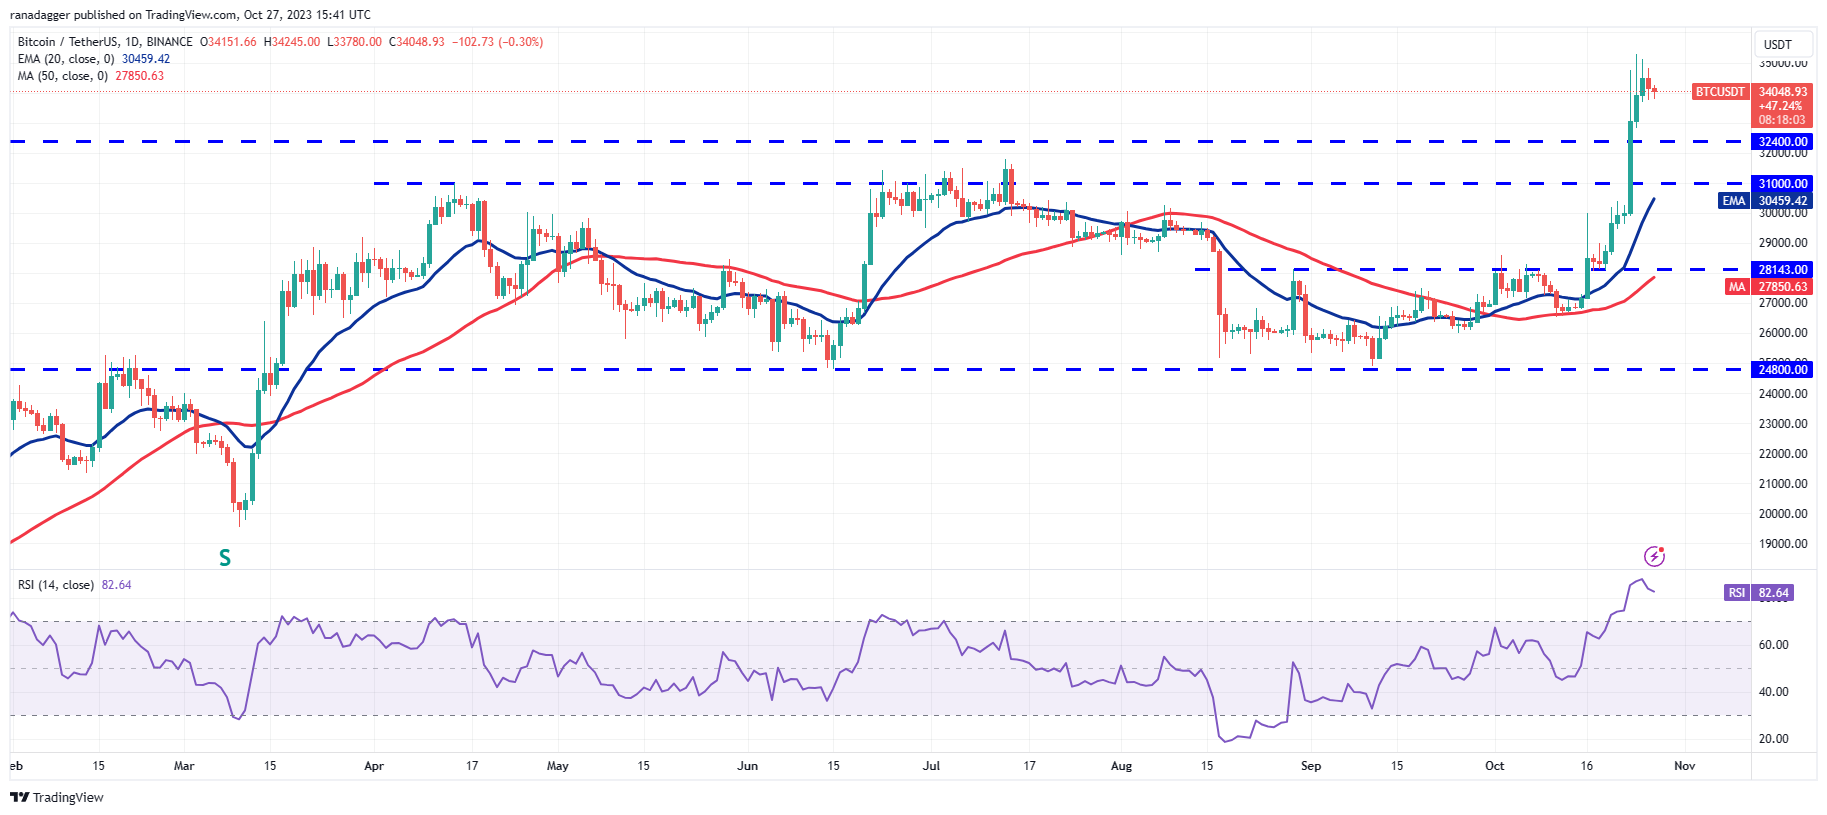 BTC/USDT daily chart. Source: TradingView
The risk of further increases is that the relative strength index (RSI) remains in the overbought region. This suggests the potential for a minor correction or consolidation in the near future. If the price drops below $33,679, the BTC/USDT pair could retest $32,400 and subsequently $31,000.
However, it is not guaranteed that the overbought conditions on the RSI will lead to a correction. Occasionally, during a transition from bearish to bullish, the RSI can stay in the overbought zone for an extended period. This occurs because savvy buyers continue to accumulate during every intraday dip.
If the price rises from the current level and breaks above $35,280, it will indicate the commencement of the next phase of the uptrend. The pair may then surge to $40,000.
Ether price analysis
Ether’s (ETH) long wick on the Oct. 26 candlestick indicates that the bears are vigorously defending the minor overhead resistance at $1,855.
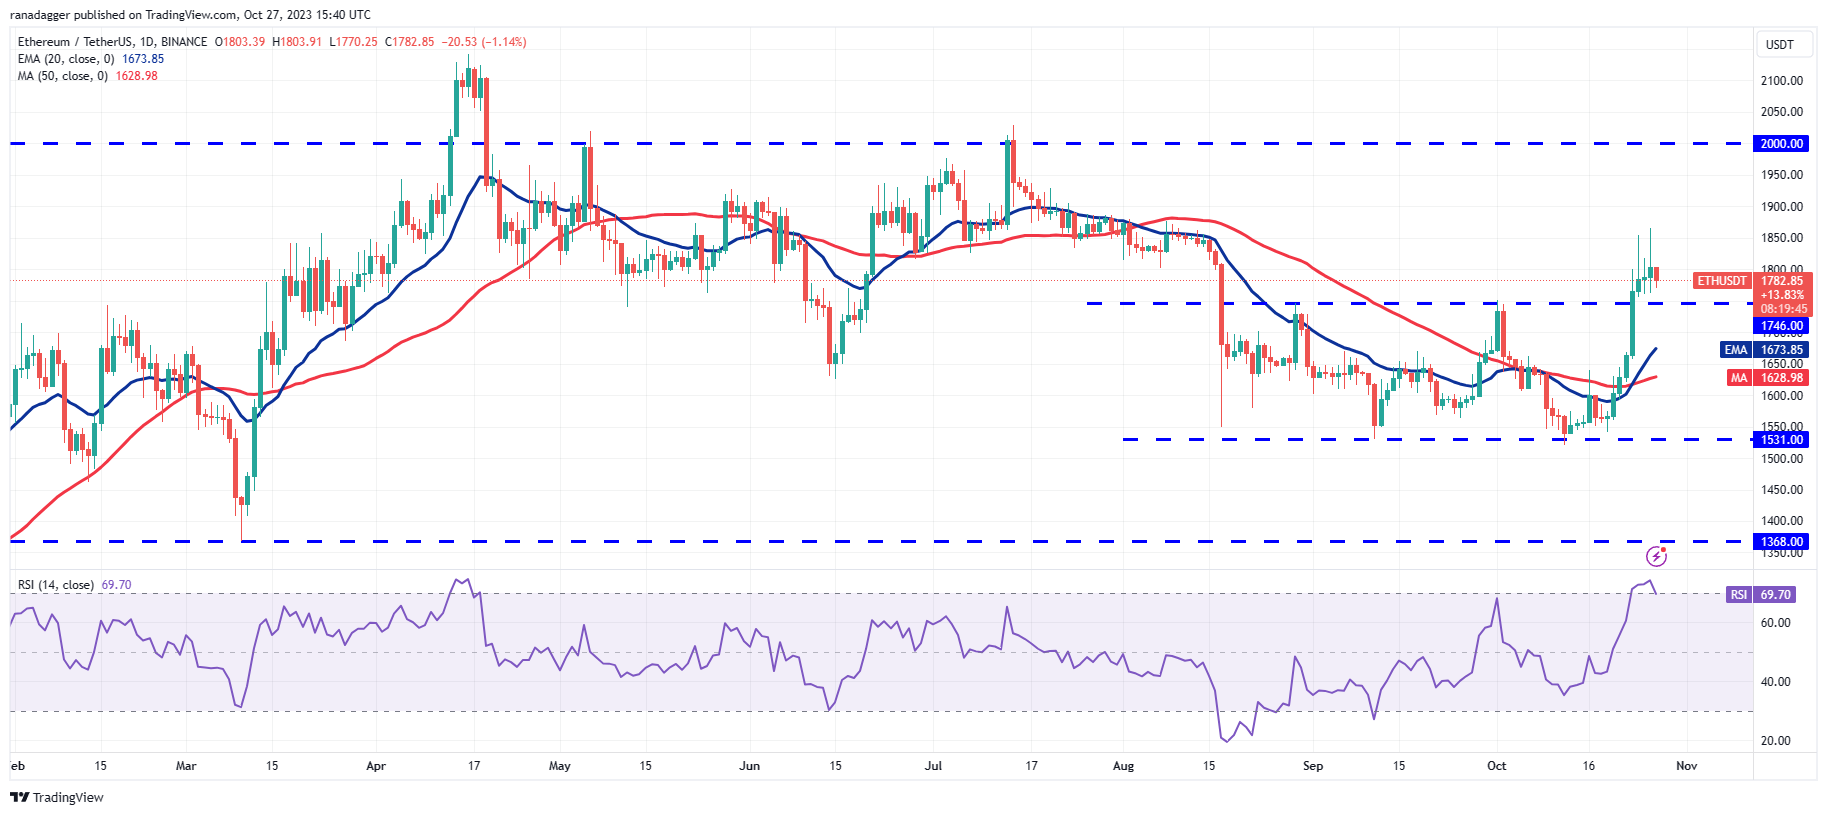 ETH/USDT daily chart. Source: TradingView
The rising 20-day EMA ($1,674) and the RSI approaching the overbought zone suggest that bulls are in control. If the price rebounds from $1,746, the bulls will once again attempt to push the ETH/USDT pair above $1,855. If this level is surpassed, the pair may soar toward the psychologically significant level of $2,000.
If bears wish to thwart the upward movement, they must quickly drive the price back below the breakout level of $1,746. The pair could then decline to the 20-day EMA.
BNB price analysis
BNB (BNB) declined from $235 on Oct. 24, indicating that bears are active at this level. The sellers attempted but failed to maintain the price below the robust support at $223.
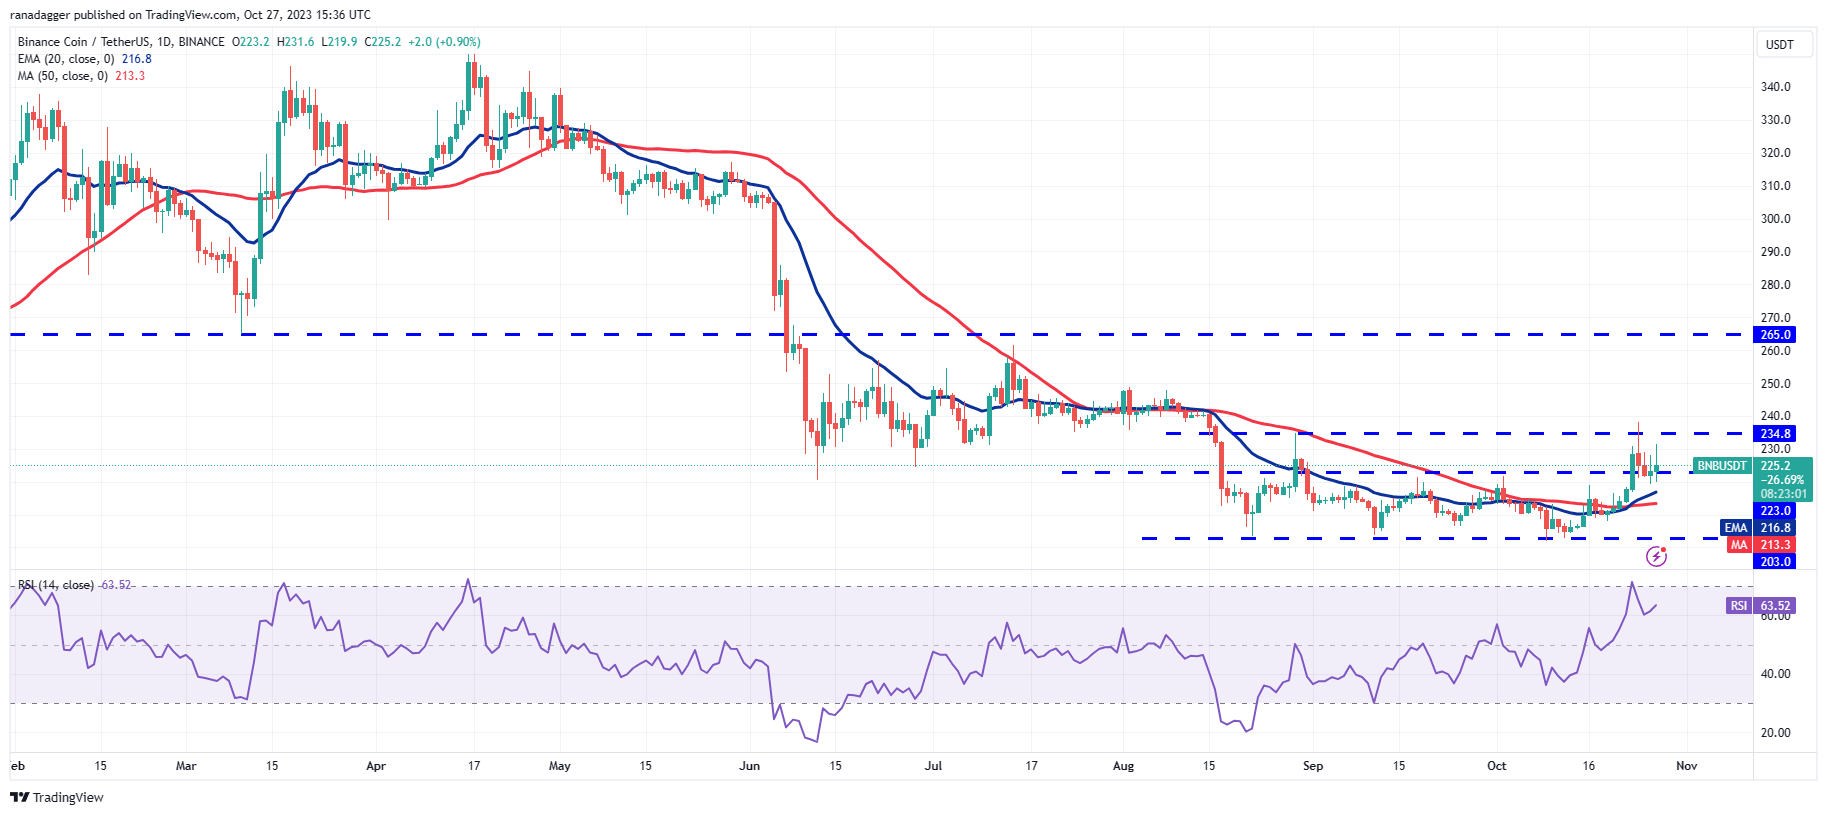 BNB/USDT daily chart. Source: TradingView
This suggests that buyers are vigorously defending the support at $223. If the price bounces off this level with strength, the BNB/USDT pair could once again attempt to rise above the overhead resistance at $235. If successful, the pair may climb to $250 and subsequently to $265.
Conversely, if the price turns down again from $235, it will indicate that bears continue to sell at higher levels. A drop below $223 will shift the advantage back to the bears. The pair may then fluctuate between $203 and $235 for a longer period.
XRP price analysis
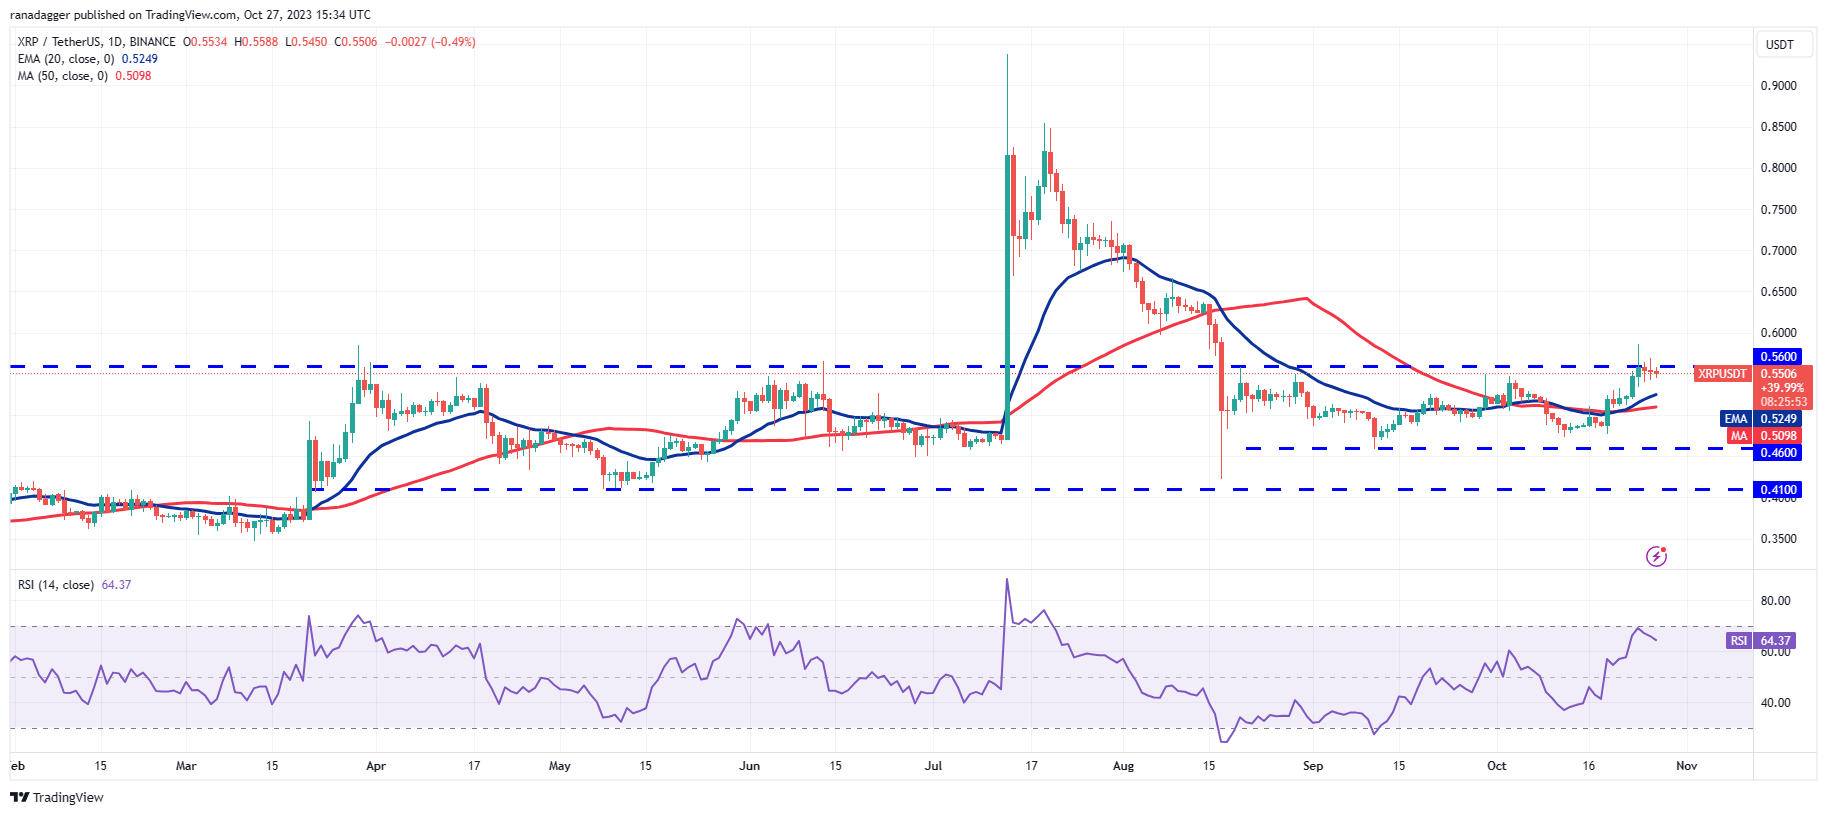
XRP (XRP) has been experiencing a fierce contest between the bulls and the bears near the overhead resistance of $0.56.
 XRP/USDT daily chart. Source: TradingView
The bears are attempting to pull the price down to the 20-day EMA ($0.52), which is a crucial level to monitor. If the price rebounds sharply from this level, it will indicate that every minor dip is being purchased. The bulls will then again try to push the price above $0.56.
If they succeed, it will signal the beginning of a new upward movement. The XRP/USDT pair could then rise to $0.71. This optimistic outlook will be invalidated in the near term if the price declines and falls below the 50-day SMA ($0.51). That would indicate a range-bound movement between $0.46 and $0.56 in the near future.
Solana price analysis
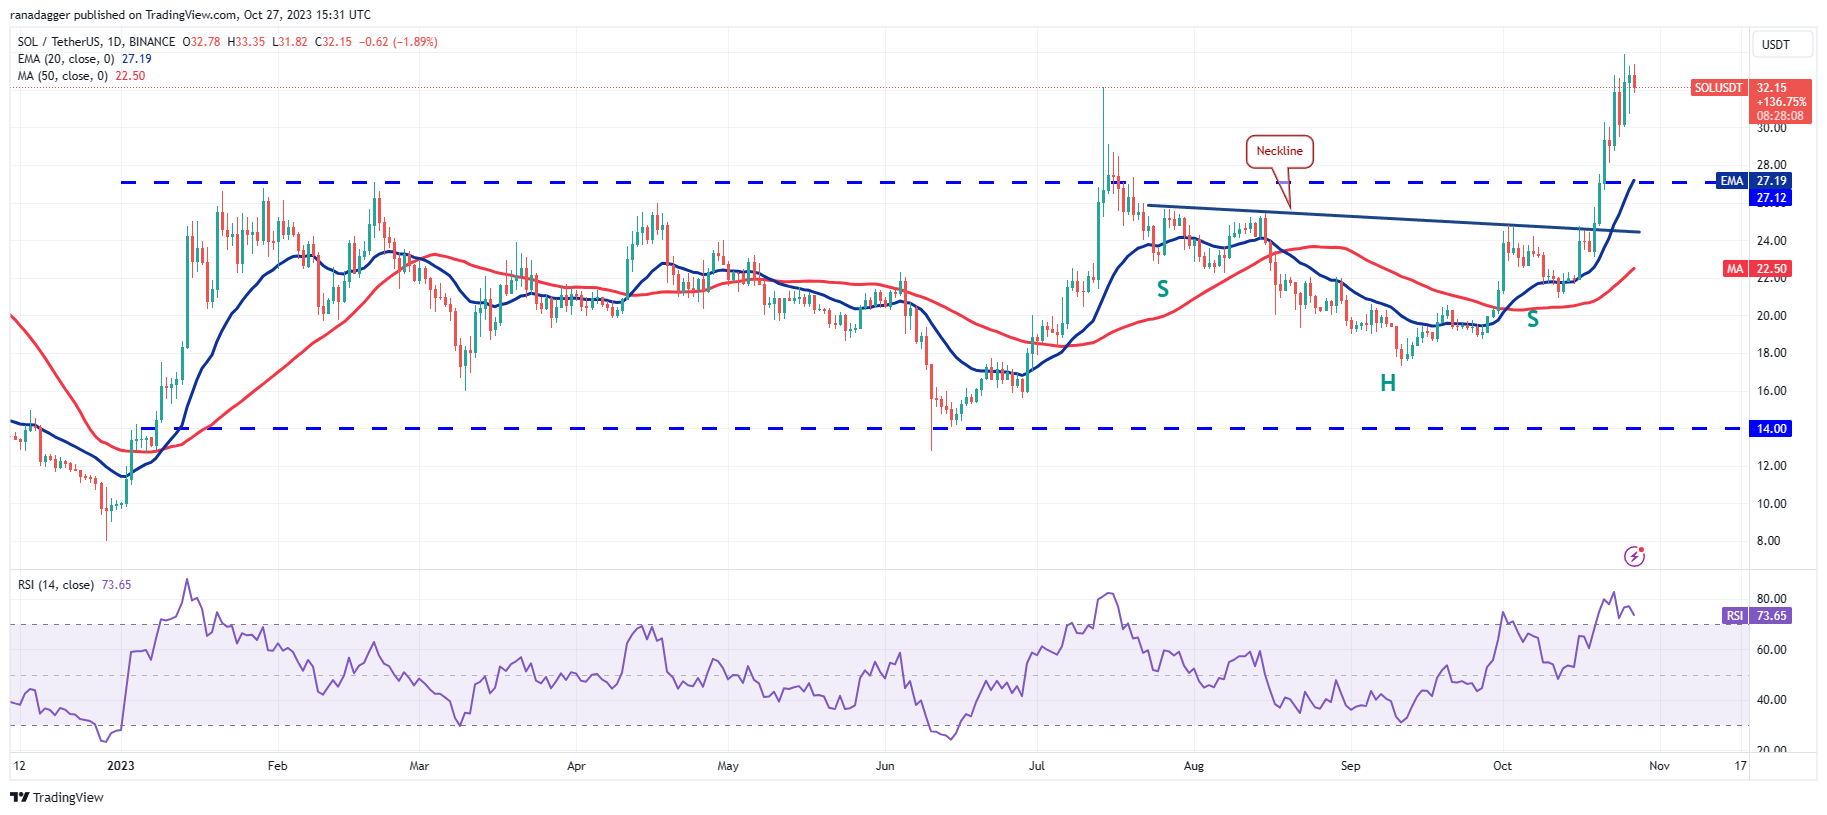
Solana (SOL) has been trading close to the pattern target of $32.81 for several days. The bulls have not yielded ground to the bears, suggesting that they expect another upward movement.
Related Posts
 SOL/USDT daily chart. Source: TradingView
The RSI remains in the overbought zone, indicating that the SOL/USDT pair may spend additional time in consolidation or experience a minor dip. If the price stays above $30, the likelihood of a rally to $38.79 increases.
Conversely, if the price falls below $30, the bears will attempt to pull the price down to the 20-day EMA ($27.20). If this support fails, it will indicate that sellers are re-entering the market.
Cardano price analysis
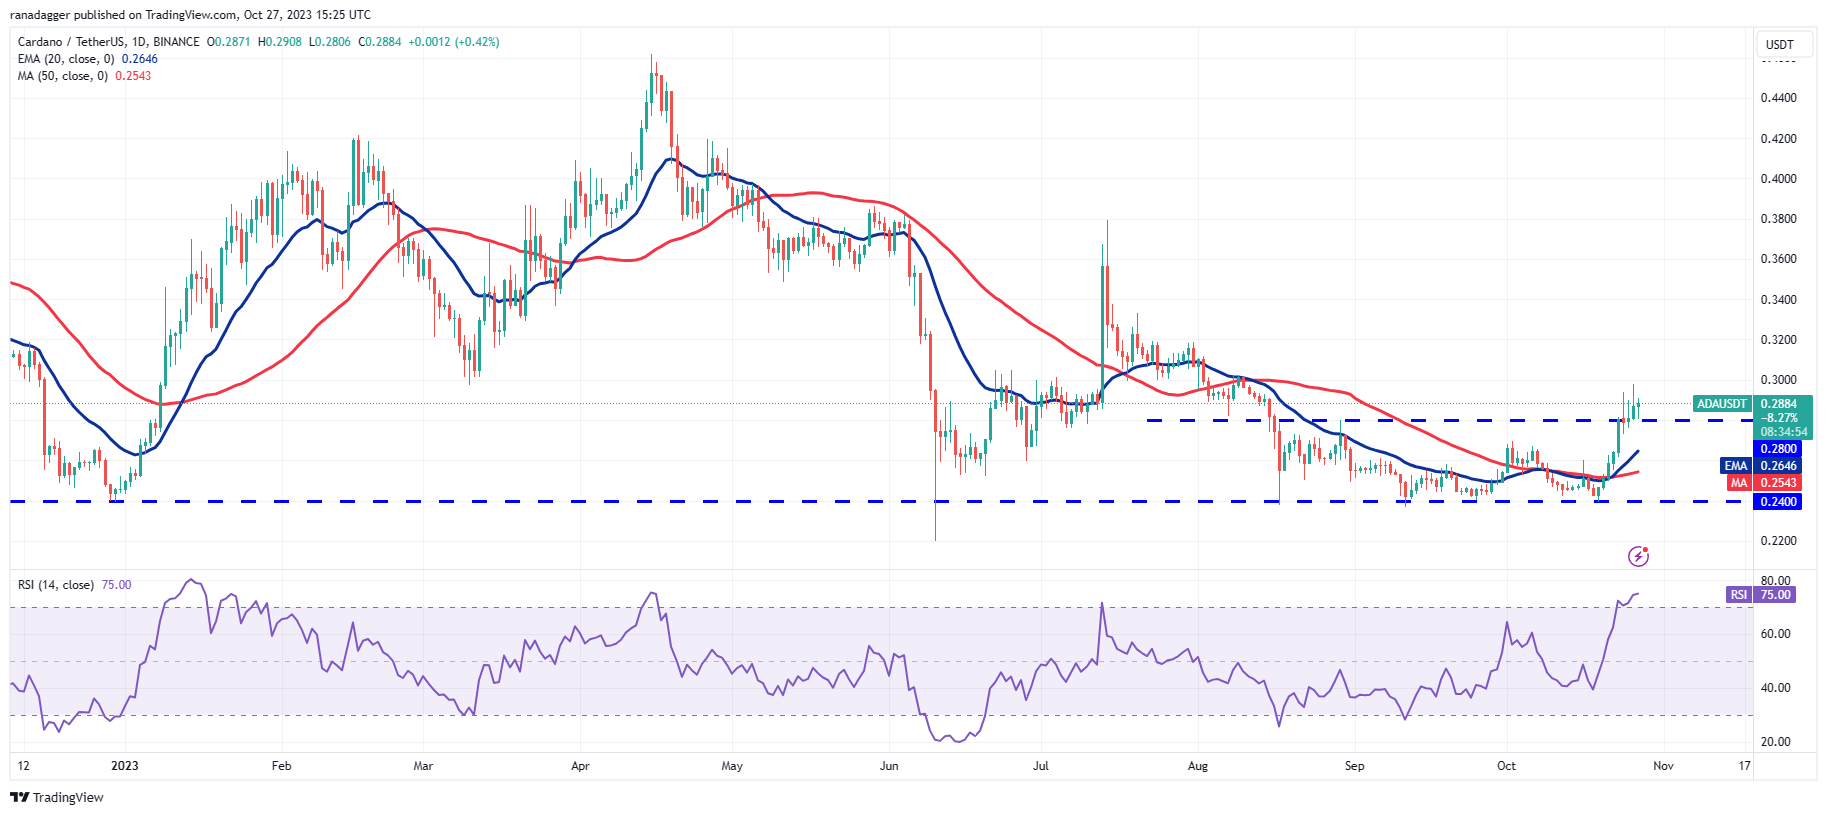
Cardano (ADA) has been trading above the $0.28 level for several days, but the bulls have not managed to initiate a strong relief rally.
 ADA/USDT daily chart. Source: TradingView
Buyers attempted to initiate a new upward movement on Oct. 26, but the bears sold at higher levels, as indicated by the long wick on the candlestick. Encouraged by this, sellers will try to pull the price back below the breakout level of $0.28. If they succeed, the ADA/USDT pair may decline to the 20-day EMA ($0.26).
Alternatively, if the price rebounds from $0.28 and rises above $0.30, it will indicate that the bulls have converted the level into support. The pair may then begin its ascent toward $0.32. This level may present a significant barrier, but if surpassed, the next target is likely to be $0.38.
Dogecoin price analysis
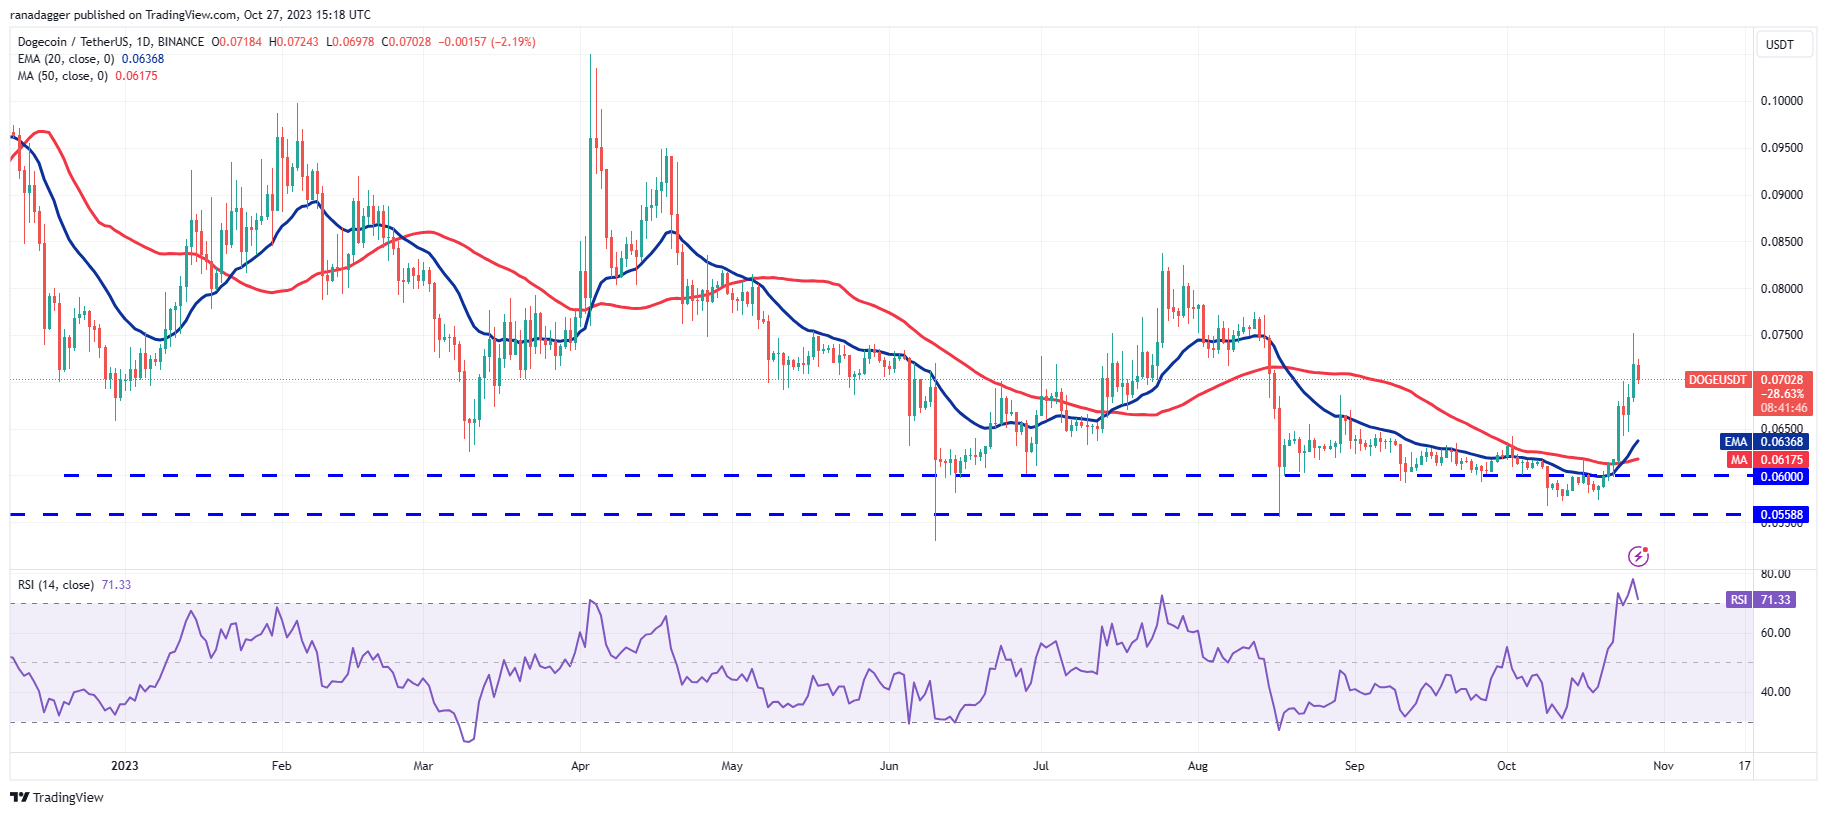
Dogecoin (DOGE) has been undergoing a robust recovery over the past few days, reflecting strong buying activity from the bulls.
 DOGE/USDT daily chart. Source: TradingView
Buyers pushed the price above the nearest resistance of $0.07 on Oct. 26, but the long wick on the candlestick indicates selling at higher levels. The bears are attempting to pull the price back below $0.07 on Oct. 27. If they succeed, the DOGE/USDT pair could drop to the 20-day EMA ($0.06).
Conversely, if the price rebounds from $0.07, it will suggest that sentiment has shifted positively and every minor dip is being bought. This could drive the price to $0.08.
Related: FLOKI price soars 140% in a week — Are memecoins like DOGE, PEPE finally waking up?
Toncoin price analysis
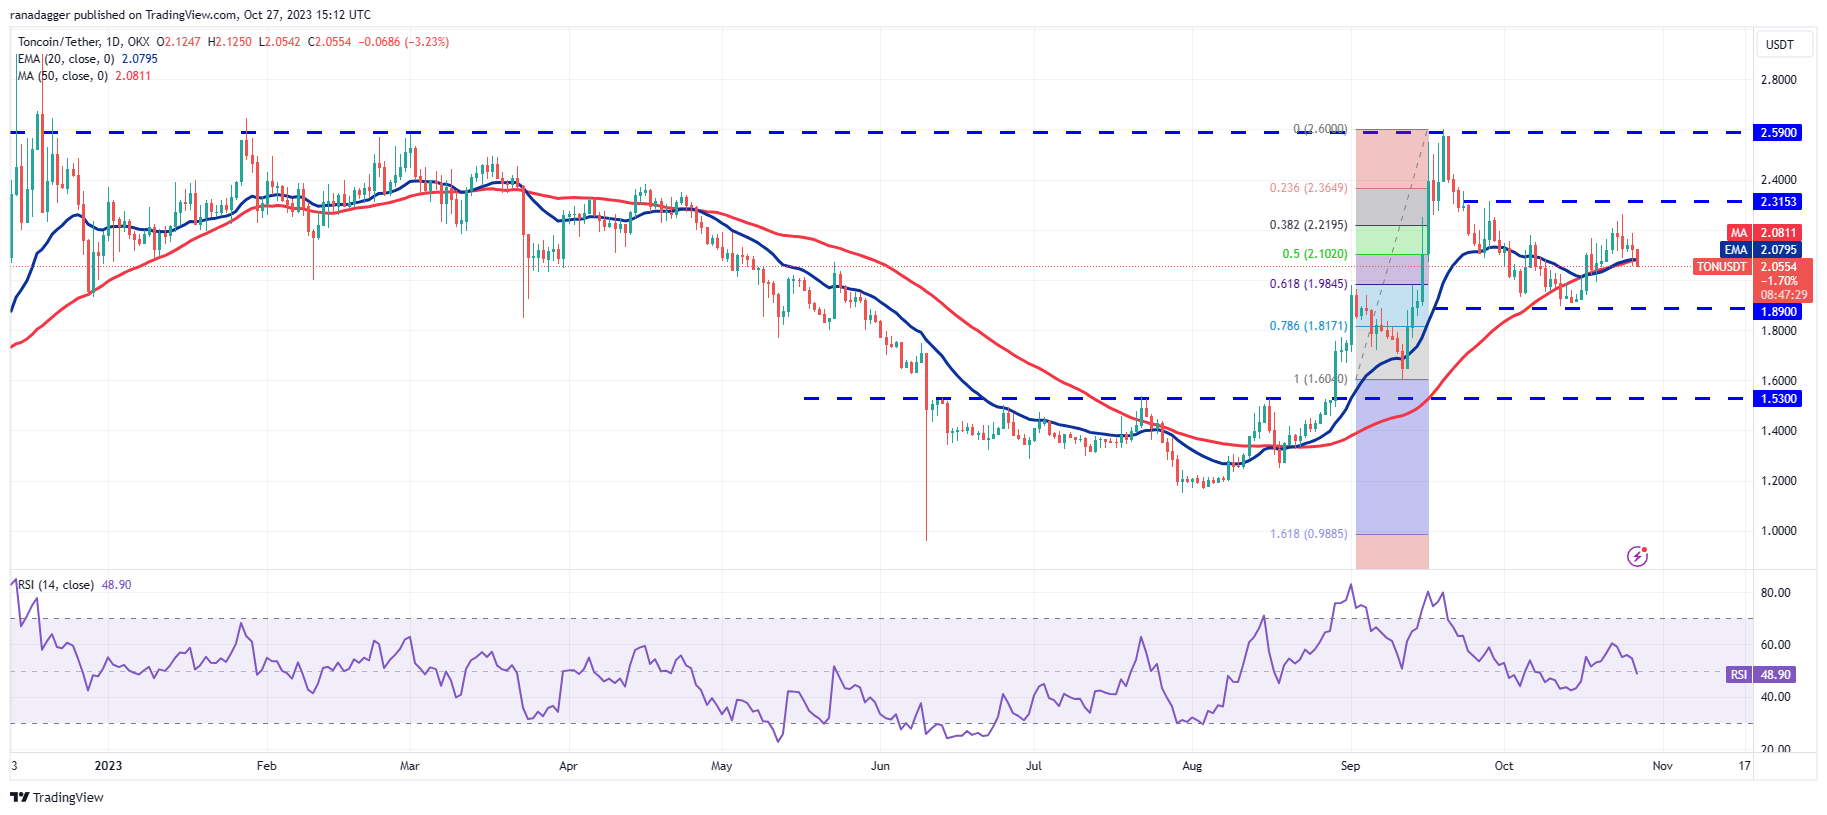
Toncoin (TON) found support at the moving averages in recent days, but the bulls were unable to initiate a strong rebound.
 TON/USDT daily chart. Source: TradingView
This may have attracted selling from the bears, who have pushed the price back below the moving averages on Oct. 27. The TON/USDT pair may decline to the critical support at $1.89. Such a move will indicate that the pair may consolidate between $1.89 and $2.31 for a few days.
In contrast, if the price sharply rises from the current level, it will suggest that the bulls are buying on minor dips. This would enhance the chances of a breakout above $2.31. The pair may then surge to $2.59.
Chainlink price analysis
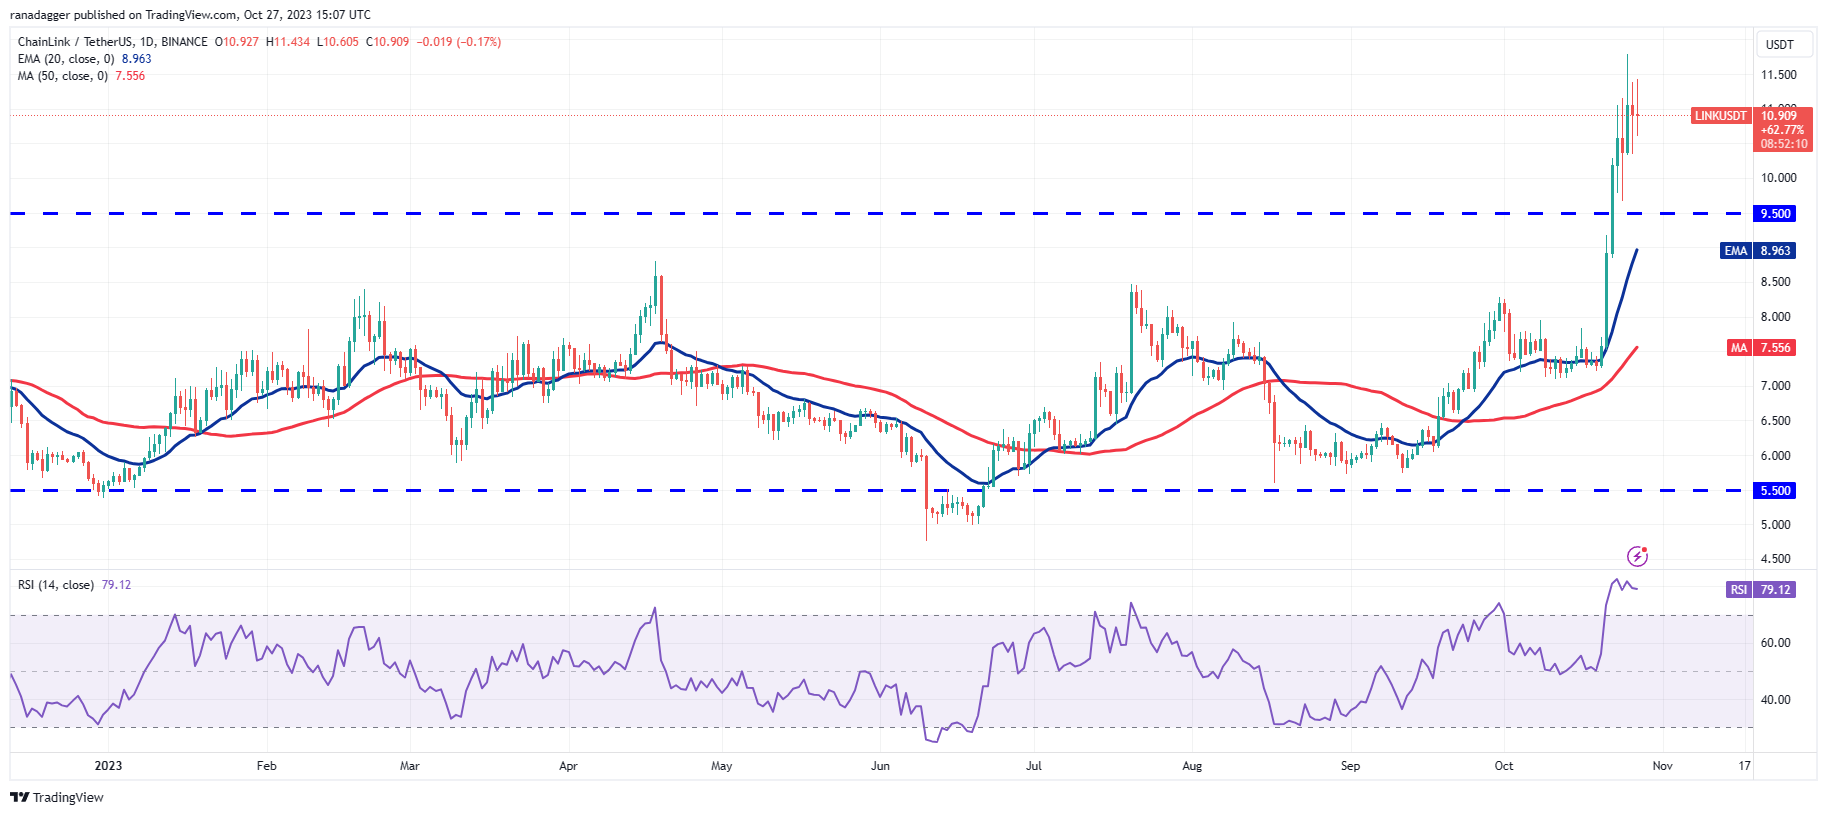
Chainlink (LINK) has been encountering selling pressure near the $11.50 level, as evidenced by the long wick on the candlesticks from recent days.
 LINK/USDT daily chart. Source: TradingView
A minor positive aspect is that the bulls have not surrendered much ground. This indicates that buyers are not rushing to take profits, as they expect the uptrend to persist. Occasionally, when an asset breaks out from a prolonged consolidation, it may remain in the overbought zone for an extended duration. This is a possibility for the LINK/USDT pair.
The key support to monitor on the downside is $9.50, followed by the 20-day EMA ($8.97). Buyers are anticipated to defend this area vigorously.
Polygon price analysis
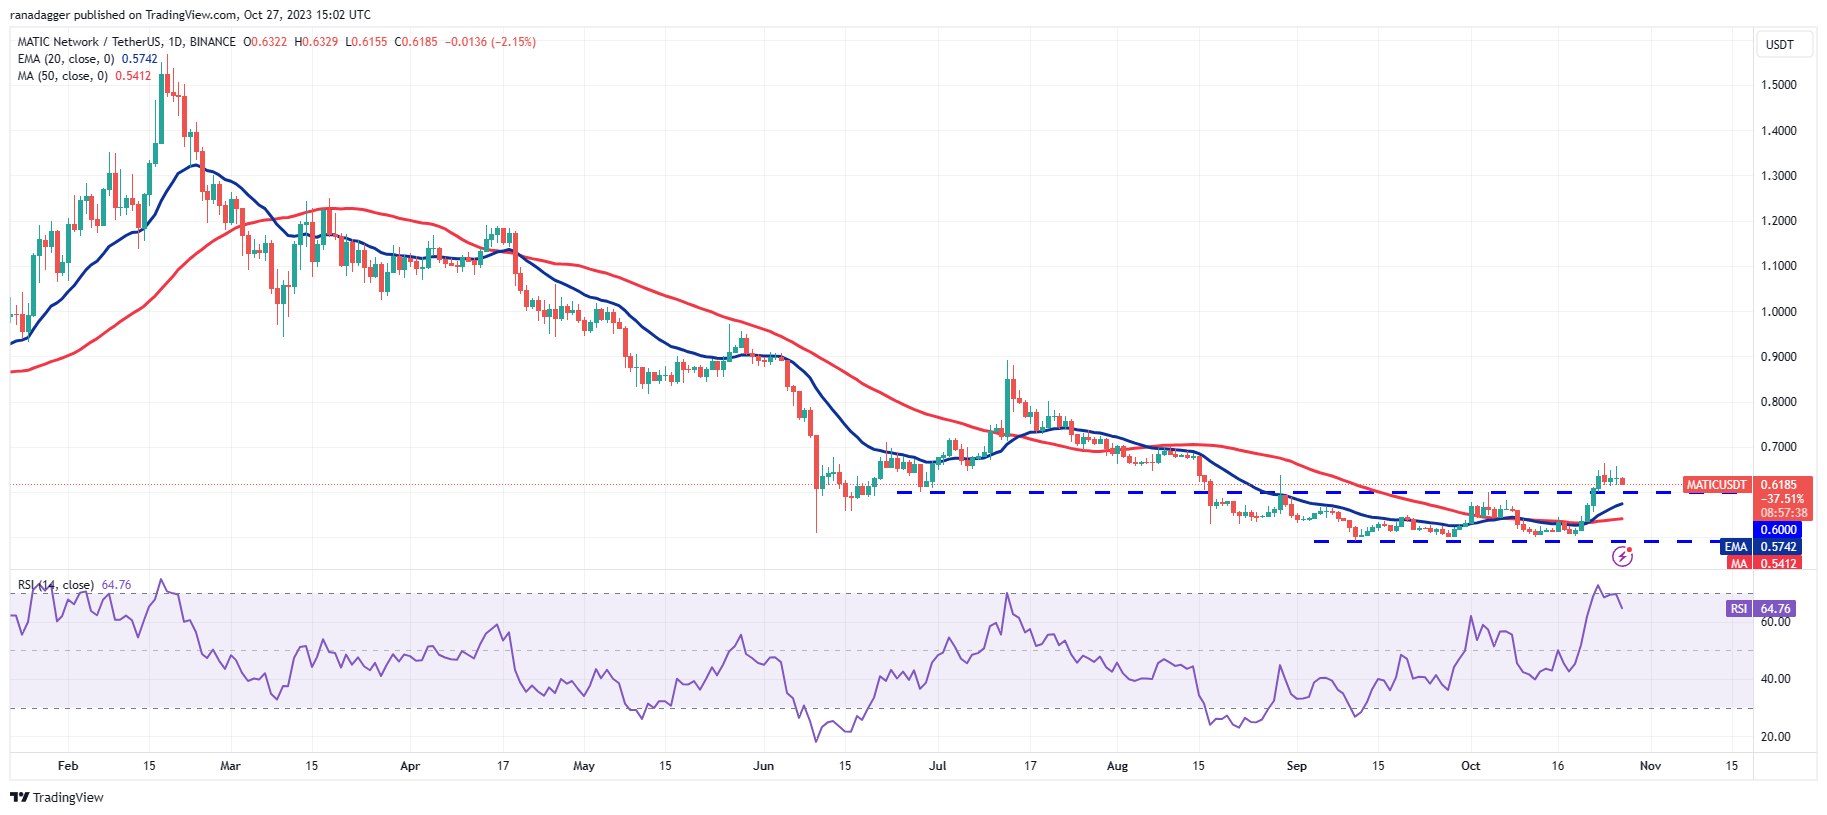
Polygon (MATIC) broke above the $0.60 resistance on Oct. 22, but the bulls are struggling to sustain the upward movement. This indicates reluctance to continue buying at elevated levels.
 MATIC/USDT daily chart. Source: TradingView
The critical level to observe on the downside is $0.60. If the price rebounds strongly from this level, it will indicate that the bulls have converted $0.60 into support. This will increase the likelihood of a breakout above $0.67. The MATIC/USDT pair may then surge to $0.77.
Meanwhile, the bears are likely to have alternative plans. They will attempt to push the price back below the breakout level of $0.60. If they succeed, several aggressive bulls may become trapped, and the pair may plummet to the 20-day EMA ($0.57).
This article does not contain investment advice or recommendations. Every investment and trading move involves risk, and readers should conduct their own research when making a decision.