Disclaimer: Information found on CryptoreNews is those of writers quoted. It does not represent the opinions of CryptoreNews on whether to sell, buy or hold any investments. You are advised to conduct your own research before making any investment decisions. Use provided information at your own risk.
CryptoreNews covers fintech, blockchain and Bitcoin bringing you the latest crypto news and analyses on the future of money.
On Oct. 23, Bitcoin (BTC) surged past the resistance range of $31,000 to $32,400, surprising many in the market. Typically, prices tend to stabilize or hesitate near significant overhead resistance levels, but this instance deviated from that pattern.
Market sentiment is optimistic as traders expect the approval of a Bitcoin spot exchange-traded fund (ETF) to occur soon. Bloomberg ETF analyst Eric Balchunas noted in a post on X (formerly Twitter) on Oct. 23 that the listing of BlackRock’s spot Bitcoin ETF on the Depository Trust & Clearing Corporation (DTCC) was “all part of the process” for bringing the ETF to market. He remarked that it was “hard not to view this as them getting signal that approval is certain/imminent.” However, a spokesperson from the DTCC later clarified that the listing of the ETF has been in place since August and does not indicate any regulatory approval.
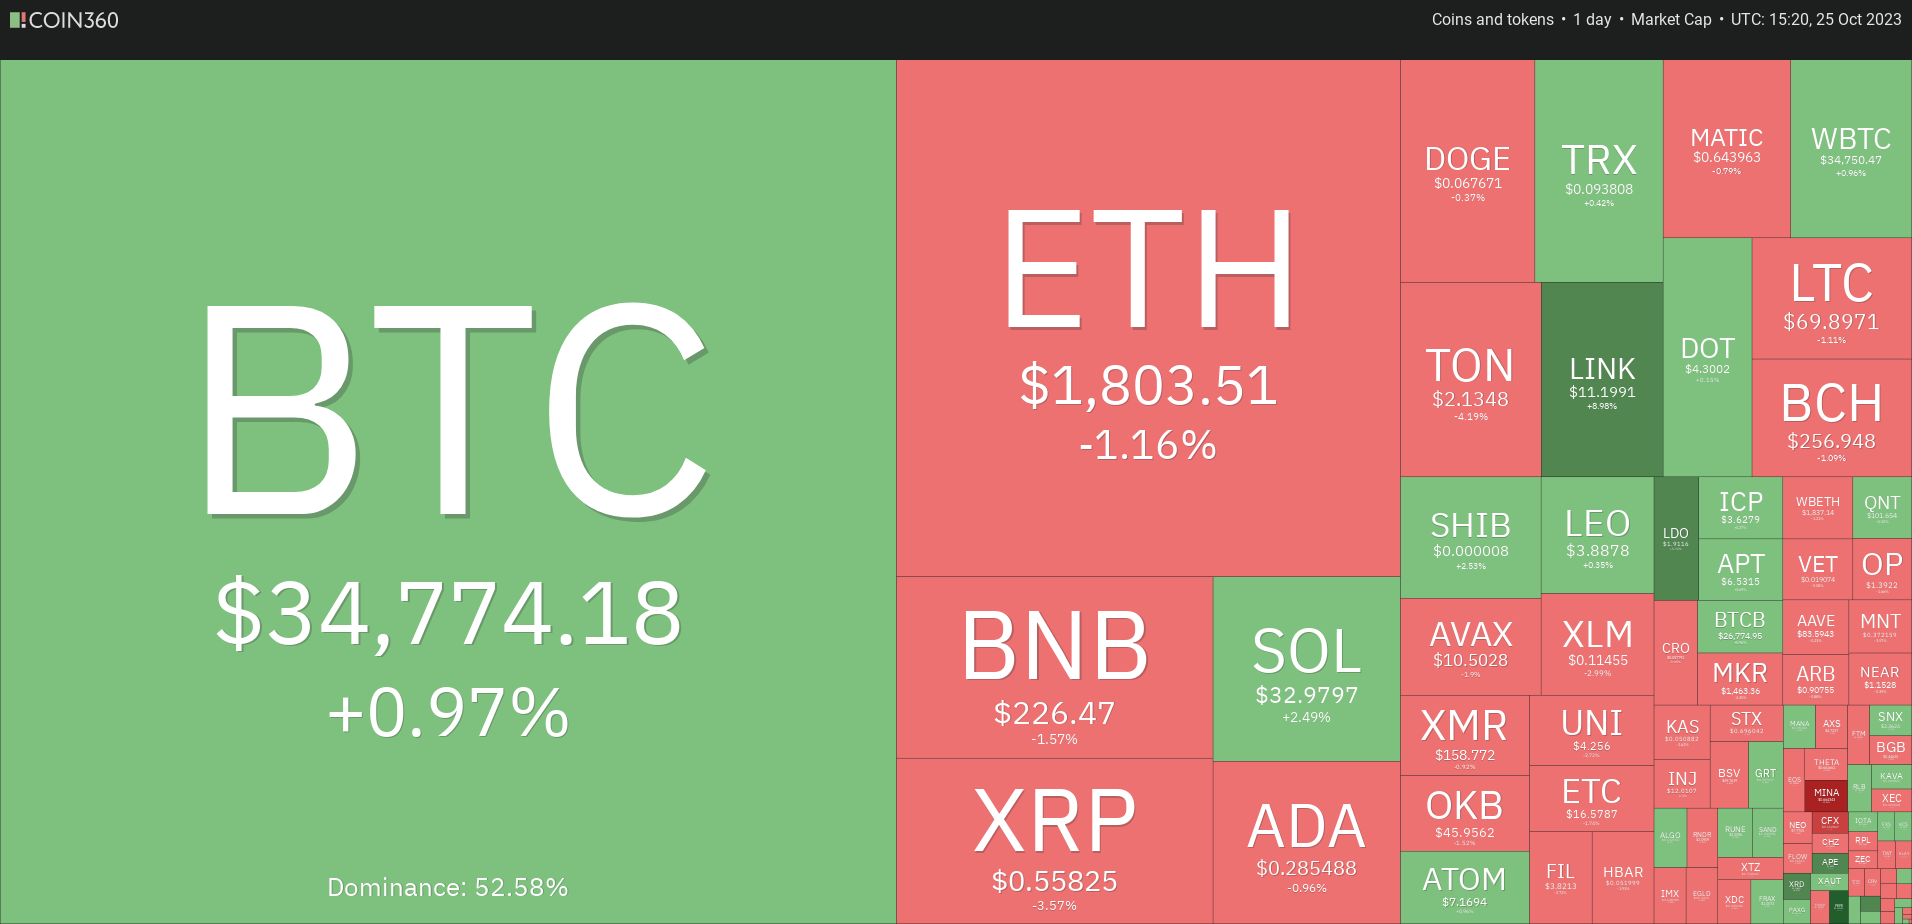 Daily cryptocurrency market performance. Source: Coin360
The rush to acquire Bitcoin ahead of the anticipated approval for a spot Bitcoin ETF stems from analysts’ expectations that prices will surge following the green light. Galaxy Digital research associate Charles Yu mentioned in a blog post that Bitcoin’s price could increase by 74.1% in the first year after an ETF launches in the United States.
Is the recent surge in Bitcoin indicative of the start of a sustained upward trend, or is it time to take profits? How will altcoins react as Bitcoin shows strength?
Let’s examine the charts of the top 10 cryptocurrencies to gain insights.
Bitcoin price analysis
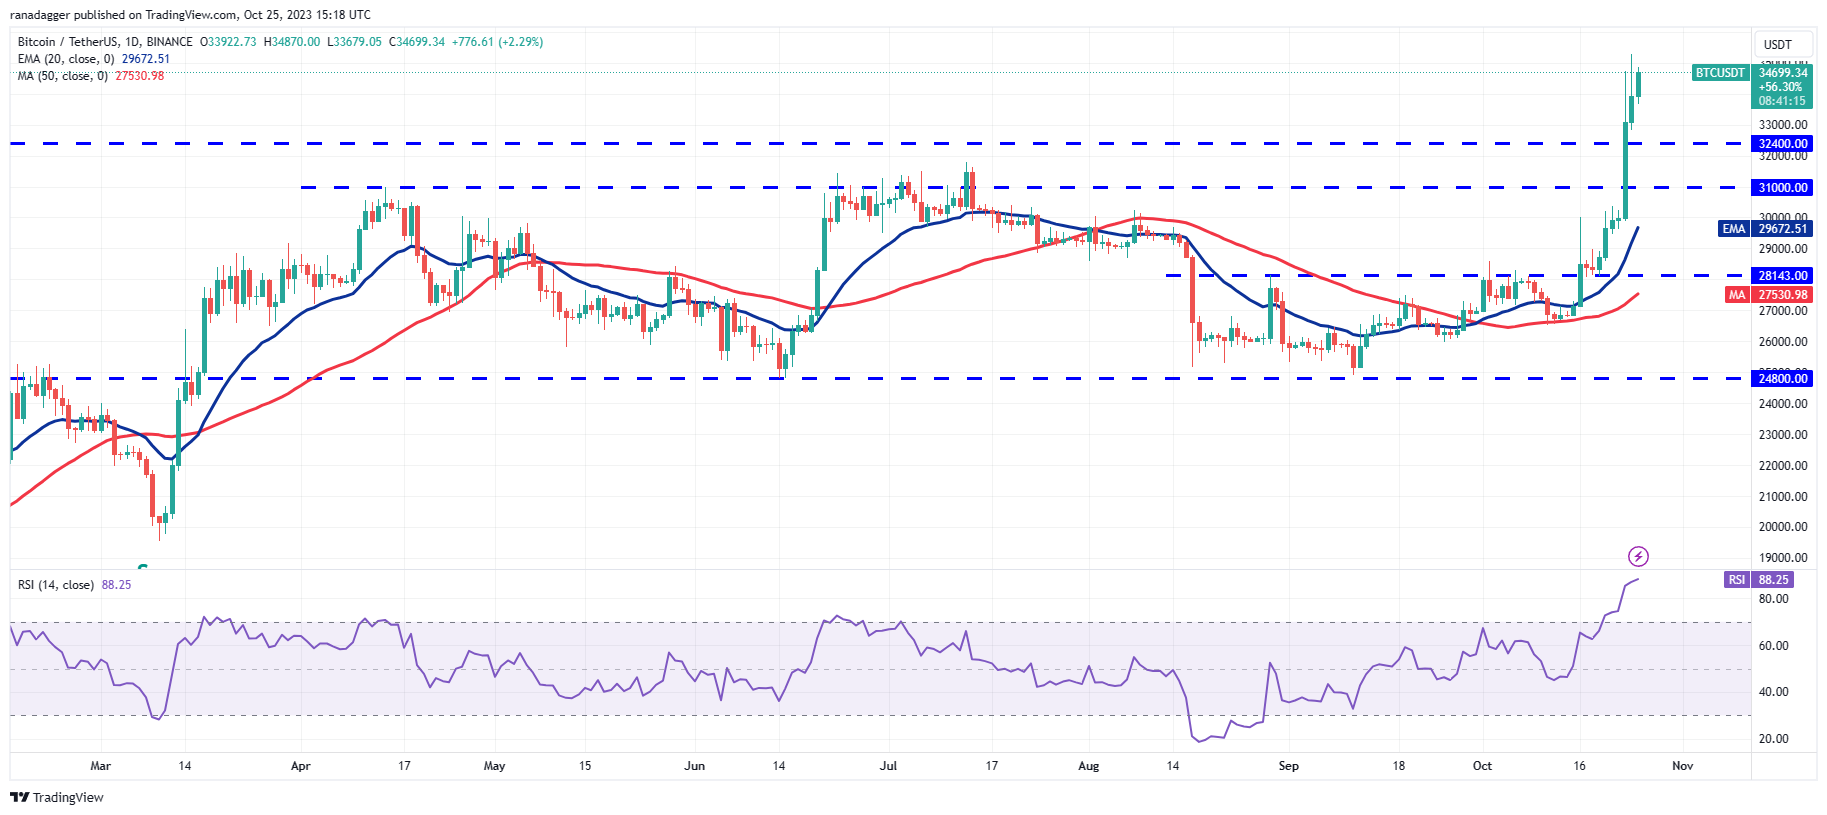
Bitcoin surged past the significant resistance level of $31,000 to $32,400 on Oct. 23, signaling a potential continuation of the uptrend.
 BTC/USDT daily chart. Source: TradingView
The recent sharp increase has pushed the relative strength index (RSI) deep into overbought territory. In the early phases of a new bullish trend, the RSI can remain in the overbought zone for an extended period.
Key support levels to monitor on the downside are $32,400 and then $31,000. Buyers are expected to defend this area vigorously. If the price rebounds from this support zone, bulls will aim to push the BTC/USDT pair towards $40,000.
On the other hand, a drop below $31,000 would suggest that the recent breakout might have been a bull trap.
Ether price analysis
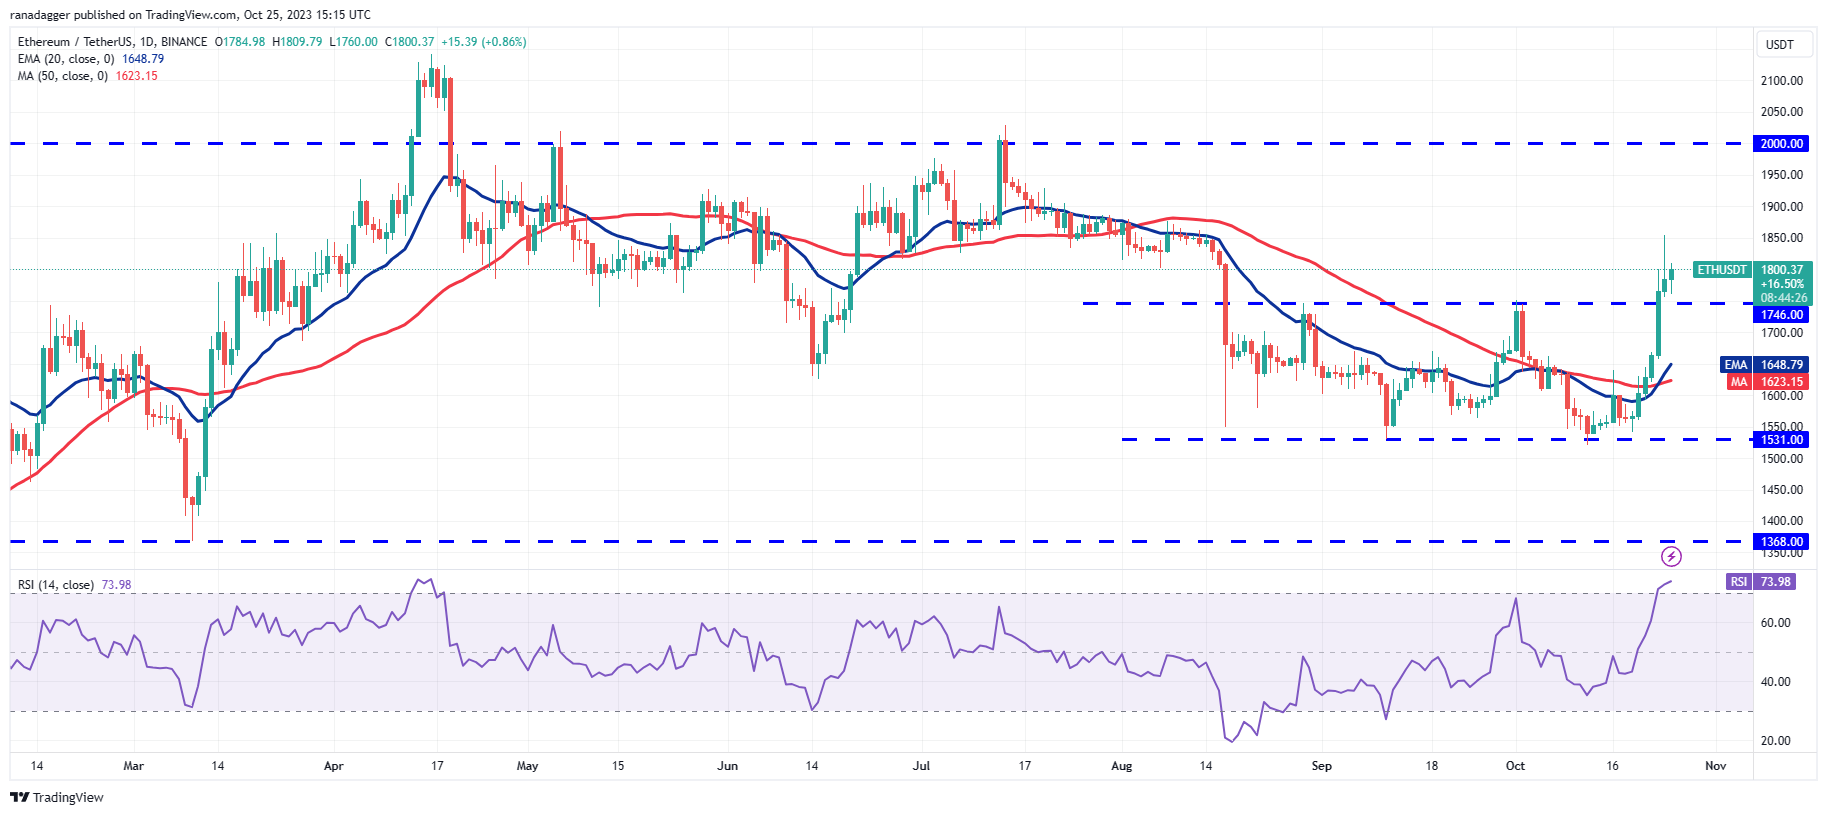
Ether’s (ETH) range broke to the upside with a move above $1,746 on Oct. 23, indicating a possible trend change.
 ETH/USDT daily chart. Source: TradingView
Bulls attempted to extend the rally on Oct. 24, but the long wick on the candlestick indicates strong selling at higher levels. The crucial level to observe on the downside is $1,746. If bulls maintain this level during the retest, the ETH/USDT pair may rise above $1,855, potentially paving the way for a rally to $1,900 and then $2,000.
However, bears may have different intentions. They will likely attempt to pull the price back below $1,746 to trap aggressive bulls. The pair could then decline to the 20-day EMA ($1,648), suggesting that consolidation may continue for a while.
BNB price analysis
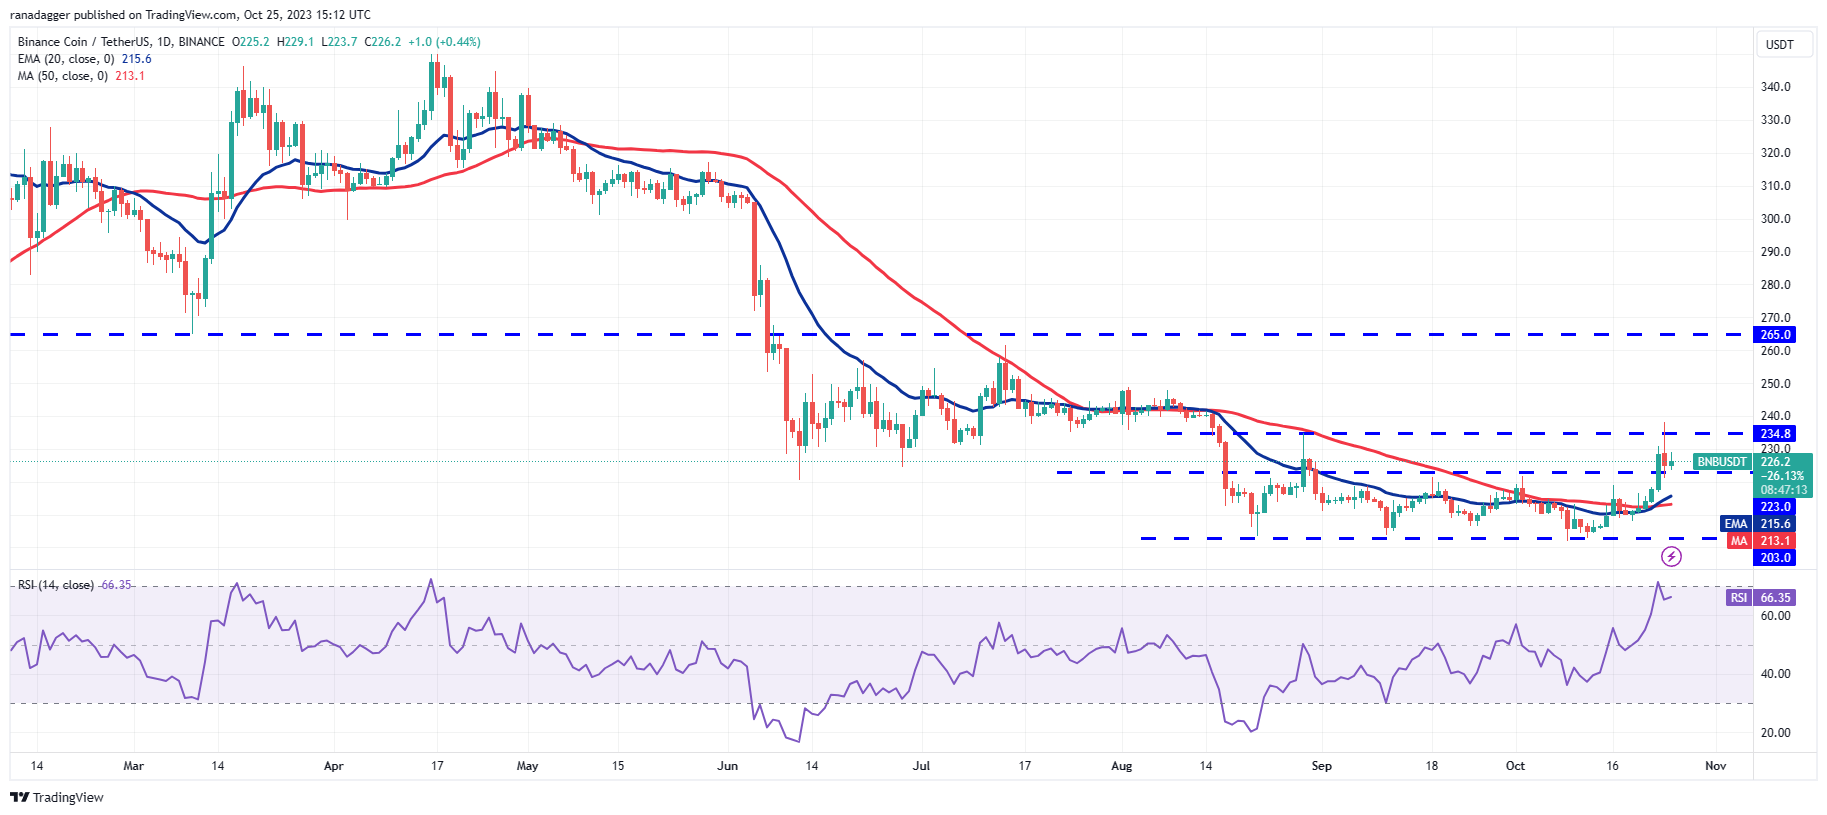
BNB (BNB) climbed above the immediate resistance of $223 on Oct. 23, but bulls were unable to sustain the momentum and surpass the hurdle at $235.
 BNB/USDT daily chart. Source: TradingView
Sellers are attempting to pull the price back below $223. If successful, it would indicate that the BNB/USDT pair may continue to fluctuate between $203 and $235 for a longer period.
The 20-day EMA ($215) has begun to rise, and the RSI is in positive territory, suggesting that bulls have the advantage. If the price rebounds from $223, it will indicate that bulls are buying on dips, enhancing the likelihood of a rally above $235. The pair could then initiate a rise to $250 and eventually to $265.
XRP price analysis
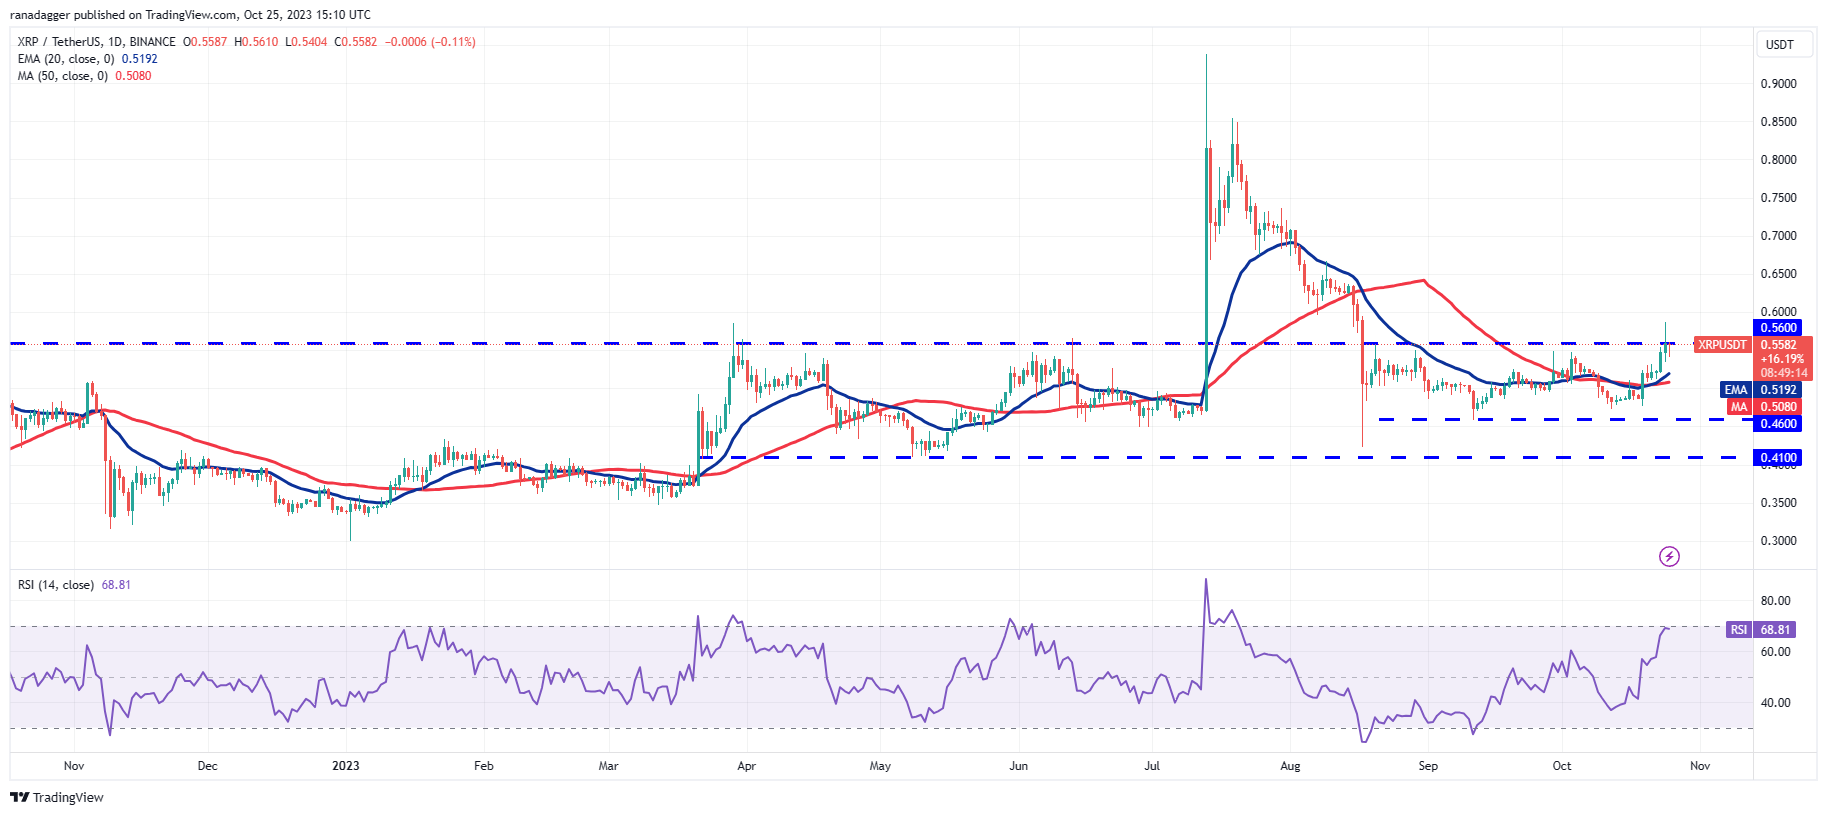
XRP (XRP) has been fluctuating within a broad range between $0.41 and $0.56 for several months. On Oct. 24, bulls pushed the price above the range’s resistance, but the long wick on the candlestick indicates that bears are defending this level.
 XRP/USDT daily chart. Source: TradingView
In a range, traders typically sell near the overhead resistance, which is evident in the XRP/USDT pair. If the price approaches the moving averages, it will suggest that the pair may remain within the $0.56 to $0.46 range for a few more days.
Conversely, if the price rebounds from the current level and breaks above $0.56, it will signal the beginning of a new upward movement. The pair may first rise to $0.66 and then attempt a rally to $0.71.
Solana price analysis
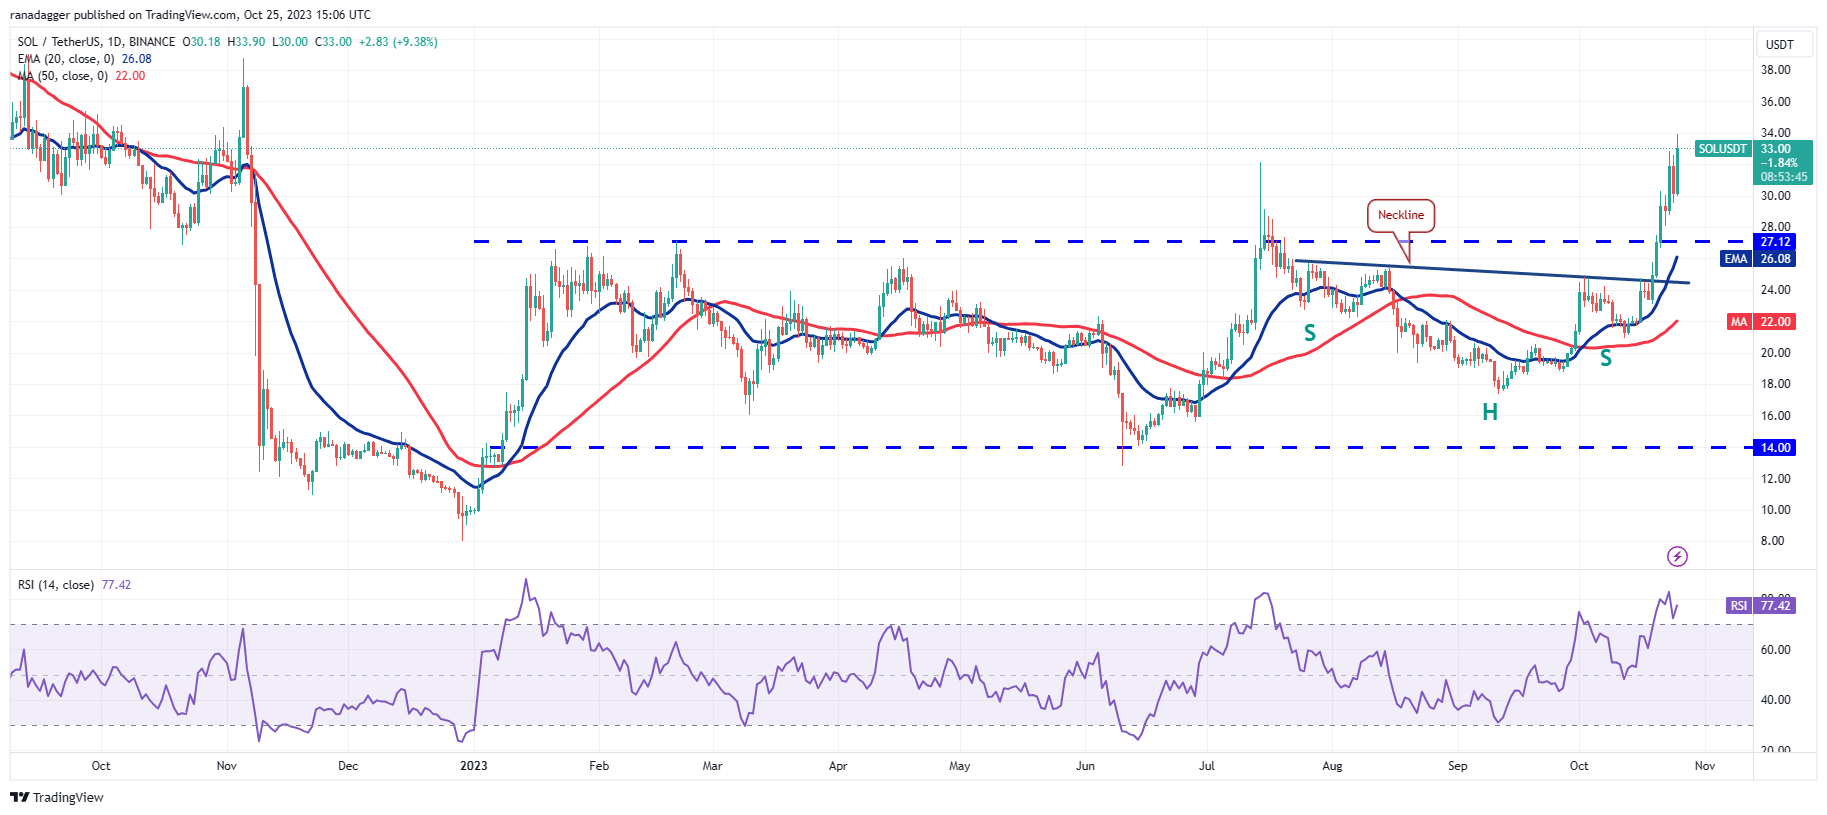
Solana (SOL) reached the pattern target of $32.81 on Oct. 23, where traders may have taken profits, initiating a brief correction on Oct. 24.
Related Posts
 SOL/USDT daily chart. Source: TradingView
This indicates that sentiment remains positive, with buyers purchasing every minor dip. Buyers pushed the price above $32.81 on Oct. 25, signaling the start of the next phase of the uptrend. The SOL/USDT pair may next surge to $38.79.
The RSI remains in overbought territory, suggesting that the pair may be at risk of a minor correction or consolidation soon. If the price falls below $29.50, the pair could drop to $27.12, a level likely to attract strong buying from bulls.
Cardano price analysis
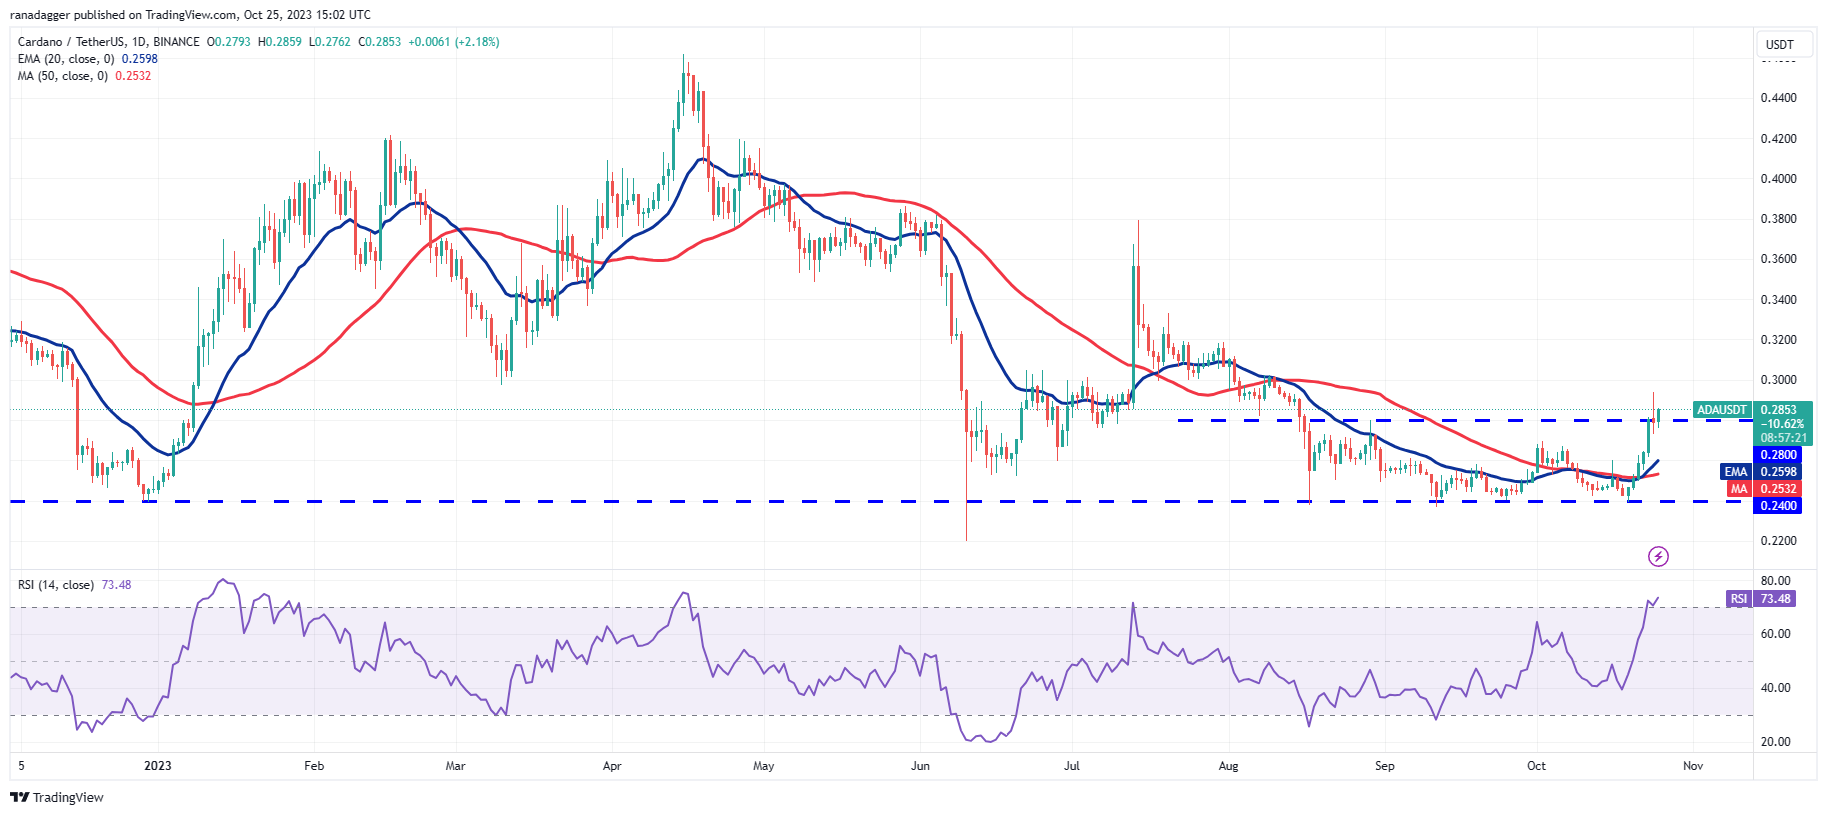
Cardano (ADA) rose above the $0.28 resistance on Oct. 24, but the long wick on the candlestick indicates that bears are selling at higher levels.
 ADA/USDT daily chart. Source: TradingView
The ADA/USDT pair is expected to face a challenging struggle near the $0.28 level. If the price declines and remains below this level, it will suggest that the market has rejected the breakout, potentially keeping the pair within the $0.24 to $0.28 range for a longer duration.
Conversely, if the price bounces off $0.28 and climbs above $0.30, it will indicate that bulls have converted the level into support, potentially initiating a new upward movement toward $0.32. If this level is surpassed, the pair may begin its ascent toward $0.38.
Dogecoin price analysis
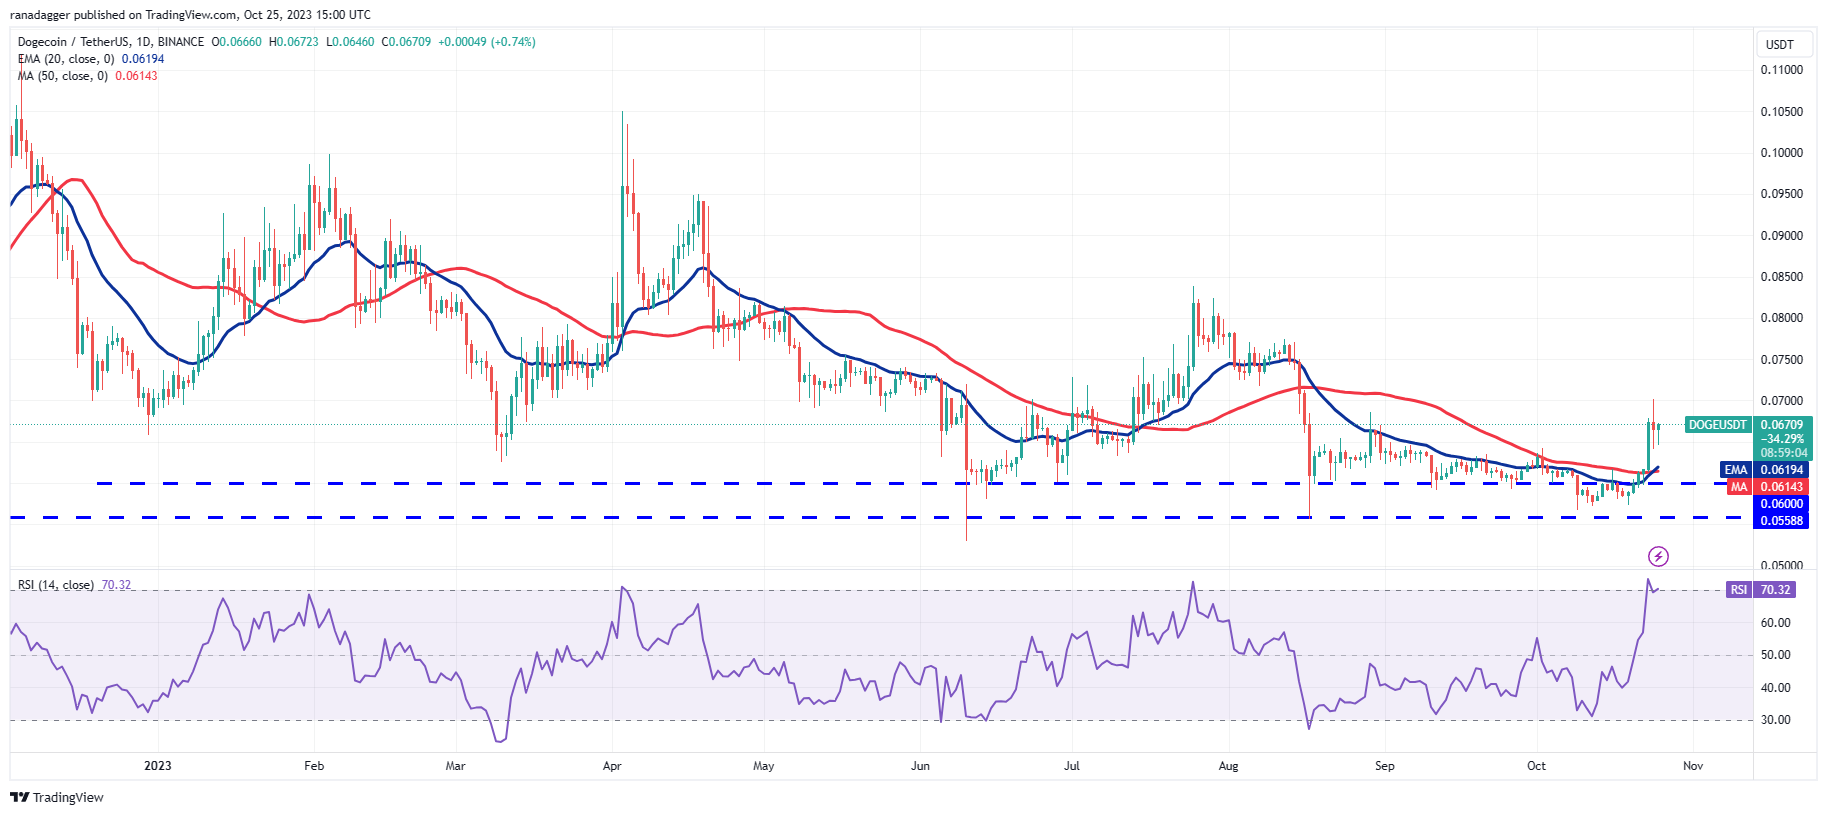
Dogecoin’s (DOGE) rally faced significant selling pressure at $0.07 on Oct. 24, as evidenced by the long wick on the day’s candlestick.
 DOGE/USDT daily chart. Source: TradingView
The DOGE/USDT pair may enter a phase of correction or consolidation in the near term. If the pair does not lose much ground during this period, it will suggest that bulls are not hastily closing their positions, enhancing the chances of a breakout above $0.07. The pair could then rise to $0.08.
The bullish crossover on the moving averages and the RSI in overbought territory indicate that bulls are in control. However, this advantage may shift to bears if they manage to pull the price below $0.06.
Related: Matrixport doubles down on $45K Bitcoin year-end prediction
Toncoin price analysis
Toncoin (TON) declined from $2.26 on Oct. 24, indicating that bears are defending the resistance at $2.31.
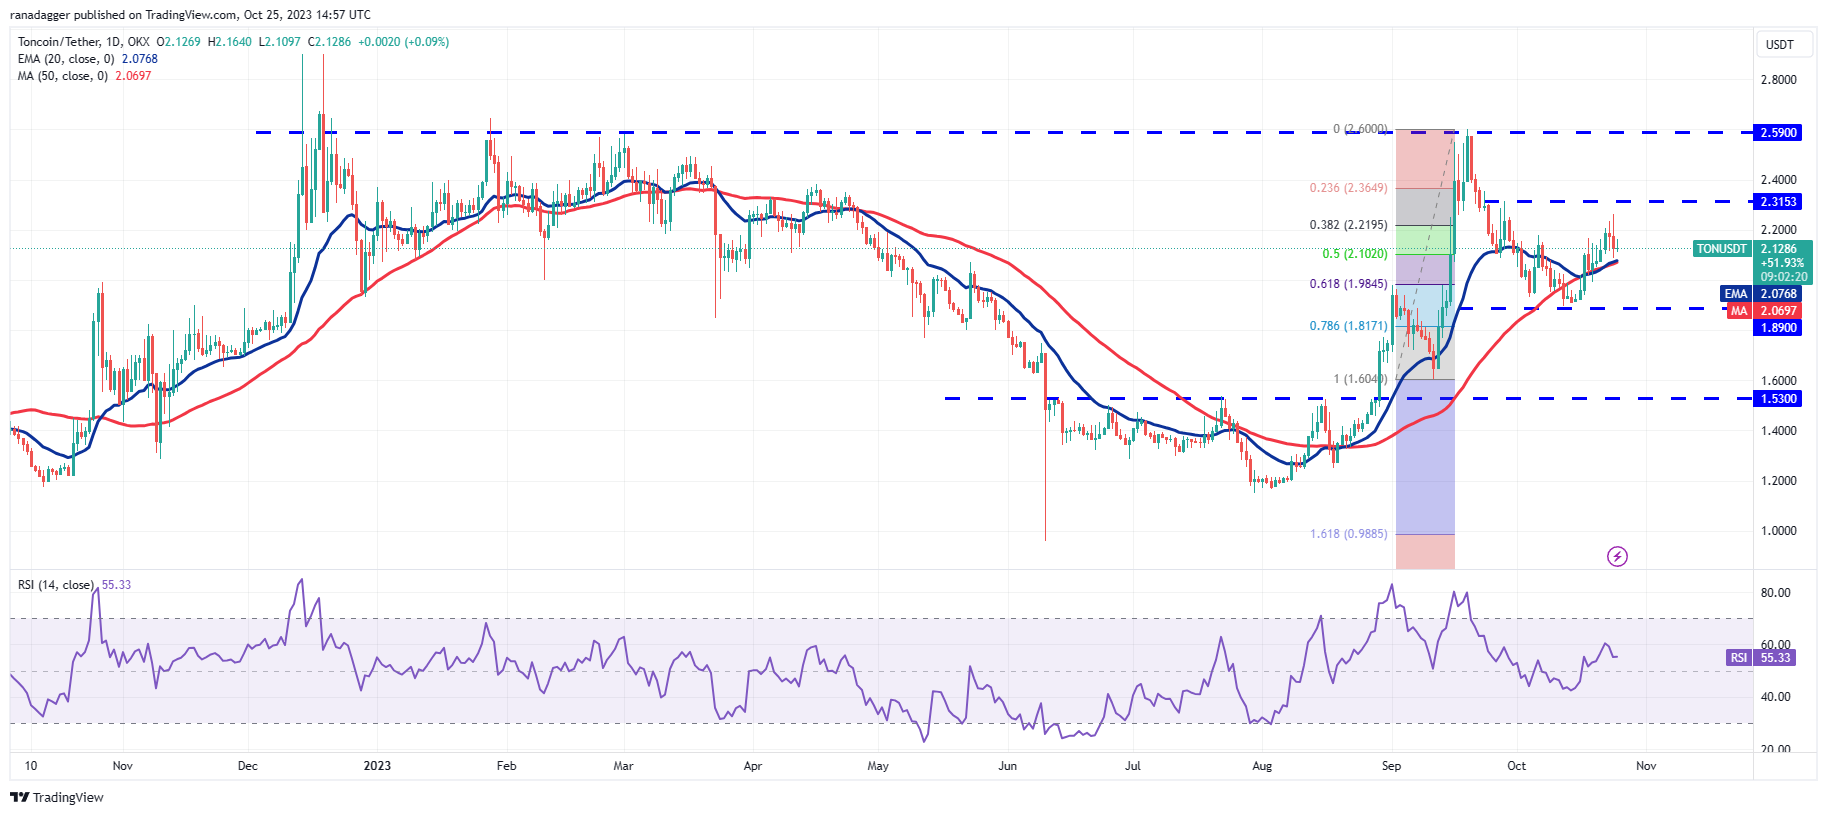 TON/USDT daily chart. Source: TradingView
The first support level on the downside is at the moving averages. If the price rebounds from this level, it will suggest that sentiment is positive and traders are buying the dips, increasing the likelihood of a breakout above $2.31. If this occurs, the TON/USDT pair could retest the strong resistance at $2.59.
Conversely, if the price declines and breaks below the moving averages, it will indicate that the pair may consolidate between $1.89 and $2.31 for a period. Bears will regain control if they manage to push the price below $1.89.
Chainlink price analysis
Chainlink (LINK) broke out of a multi-month consolidation on Oct. 22 when buyers pushed the price above the overhead resistance of $9.50.
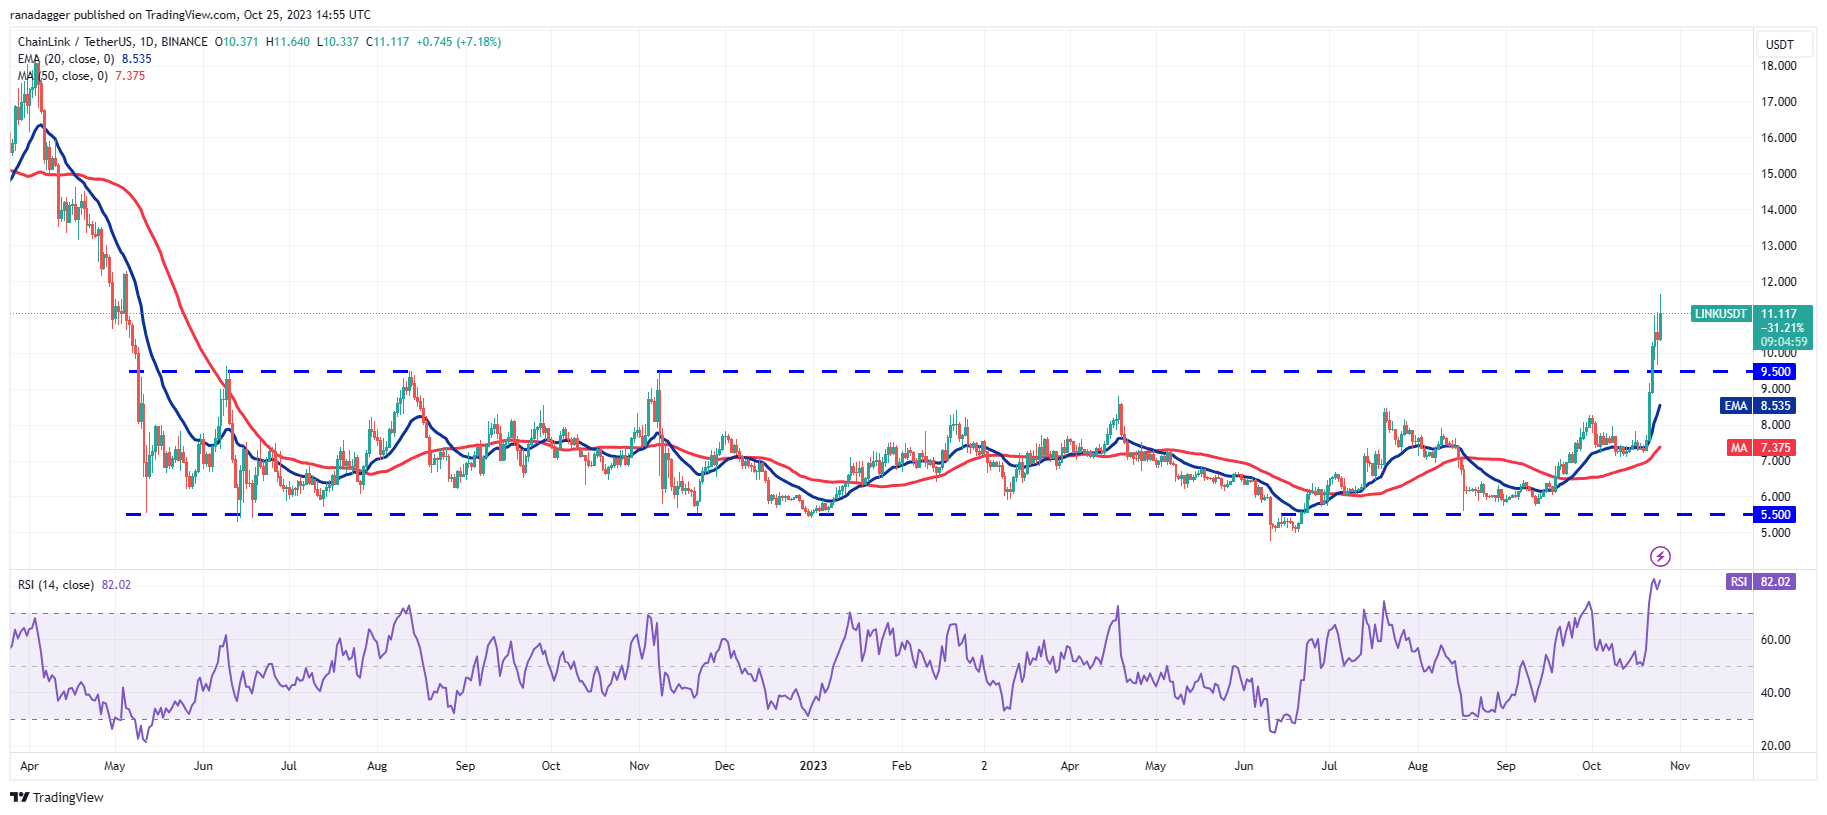 LINK/USDT daily chart. Source: TradingView
Sellers attempted to pull the price back below the breakout level of $9.50 on Oct. 24, but the long tail on the candlestick indicates aggressive buying at lower levels. Buying resumed on Oct. 25, and the LINK/USDT pair has continued to rise. The pattern target of the breakout from $9.50 is $13.50, but if this level is surpassed, the pair may reach $15.
If bears wish to halt the upward movement, they must pull the price back below $9.50. The overbought levels on the RSI signal that a minor correction or consolidation could be on the horizon.
Polygon price analysis
Polygon (MATIC) surged above the $0.60 resistance on Oct. 22, indicating accumulation at lower levels.
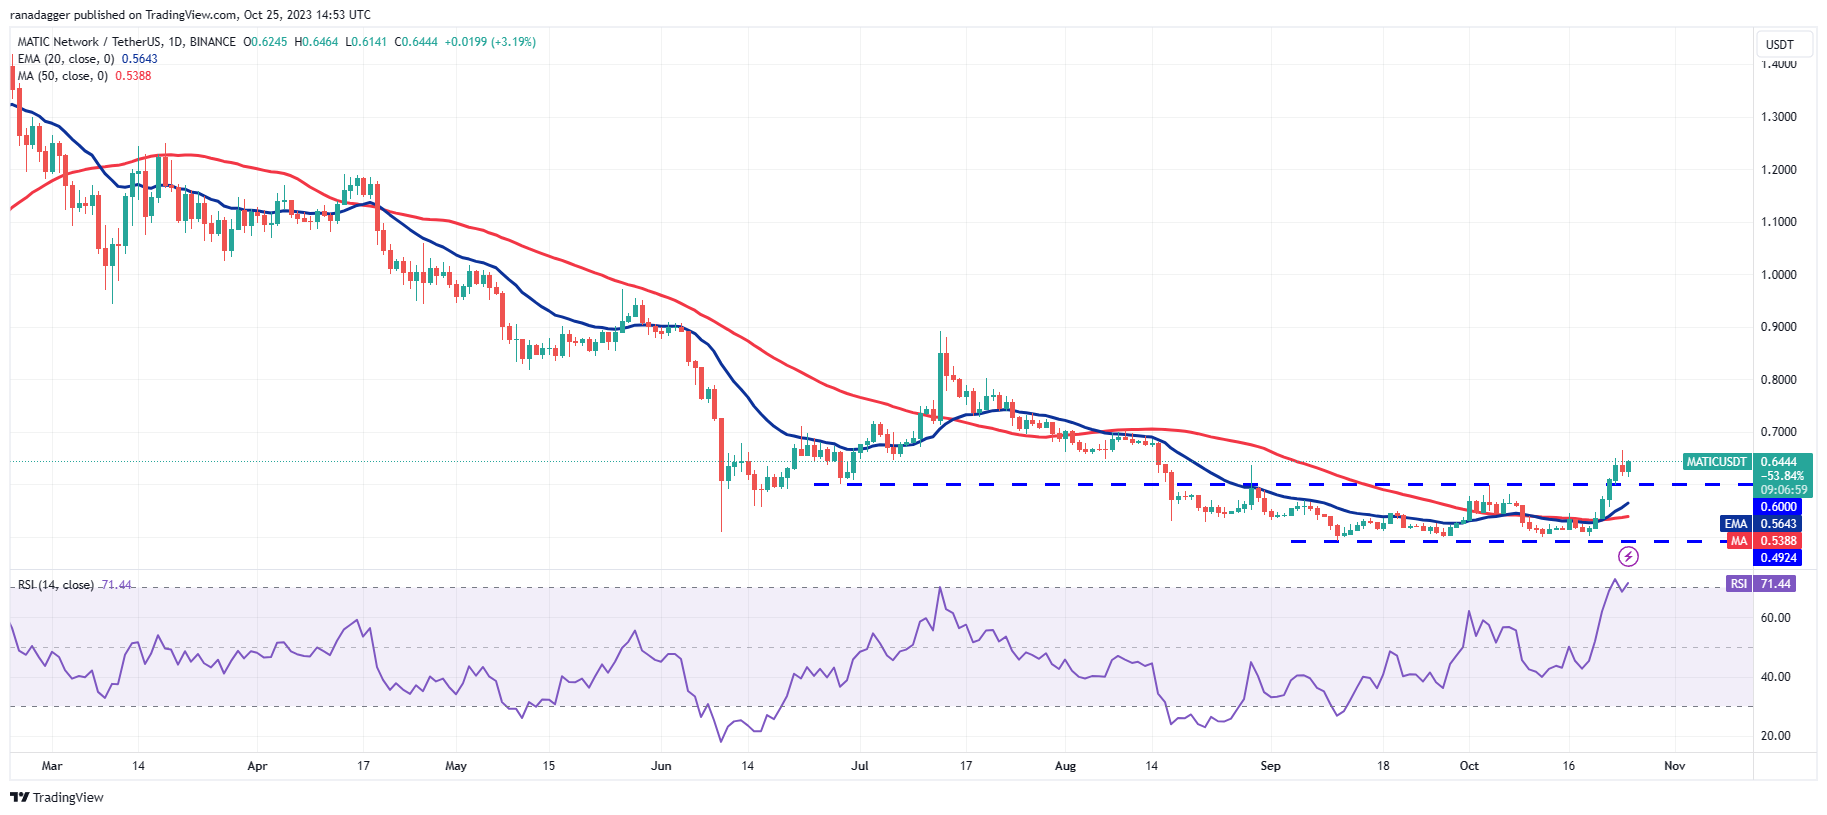 MATIC/USDT daily chart. Source: TradingView
The 20-day EMA ($0.56) has begun to rise, and the RSI is in overbought territory, suggesting a potential trend reversal. If buyers can maintain the price above $0.60, it will indicate the start of a new upward movement. The MATIC/USDT pair could rise to $0.70 and then to $0.80.
The critical level to monitor on the downside is $0.60. A drop below this level would imply that the rally above $0.60 may have been a false breakout, potentially trapping aggressive bulls and resulting in a decline to the moving averages.
This article does not contain investment advice or recommendations. Every investment and trading move involves risk, and readers should conduct their own research when making a decision.