Disclaimer: Information found on CryptoreNews is those of writers quoted. It does not represent the opinions of CryptoreNews on whether to sell, buy or hold any investments. You are advised to conduct your own research before making any investment decisions. Use provided information at your own risk.
CryptoreNews covers fintech, blockchain and Bitcoin bringing you the latest crypto news and analyses on the future of money.
On September 30, U.S. lawmakers in both the House and Senate reached a temporary agreement, preventing a government shutdown for 45 days. This development may have contributed to Bitcoin’s (BTC) significant surge on October 1. Furthermore, Bitcoin’s historically robust performance in October might have further enhanced market sentiment.
The U.S. stock markets are also experiencing favorable conditions in October. According to data from the Stock Trader’s Almanac, the S&P 500 Index (SPX) has averaged a 0.9% increase in October from 1950 to 2021. However, this does not imply that bullish investors can be complacent, as the stock market faced one of its most severe downturns during the Black Monday crash in October 1987.
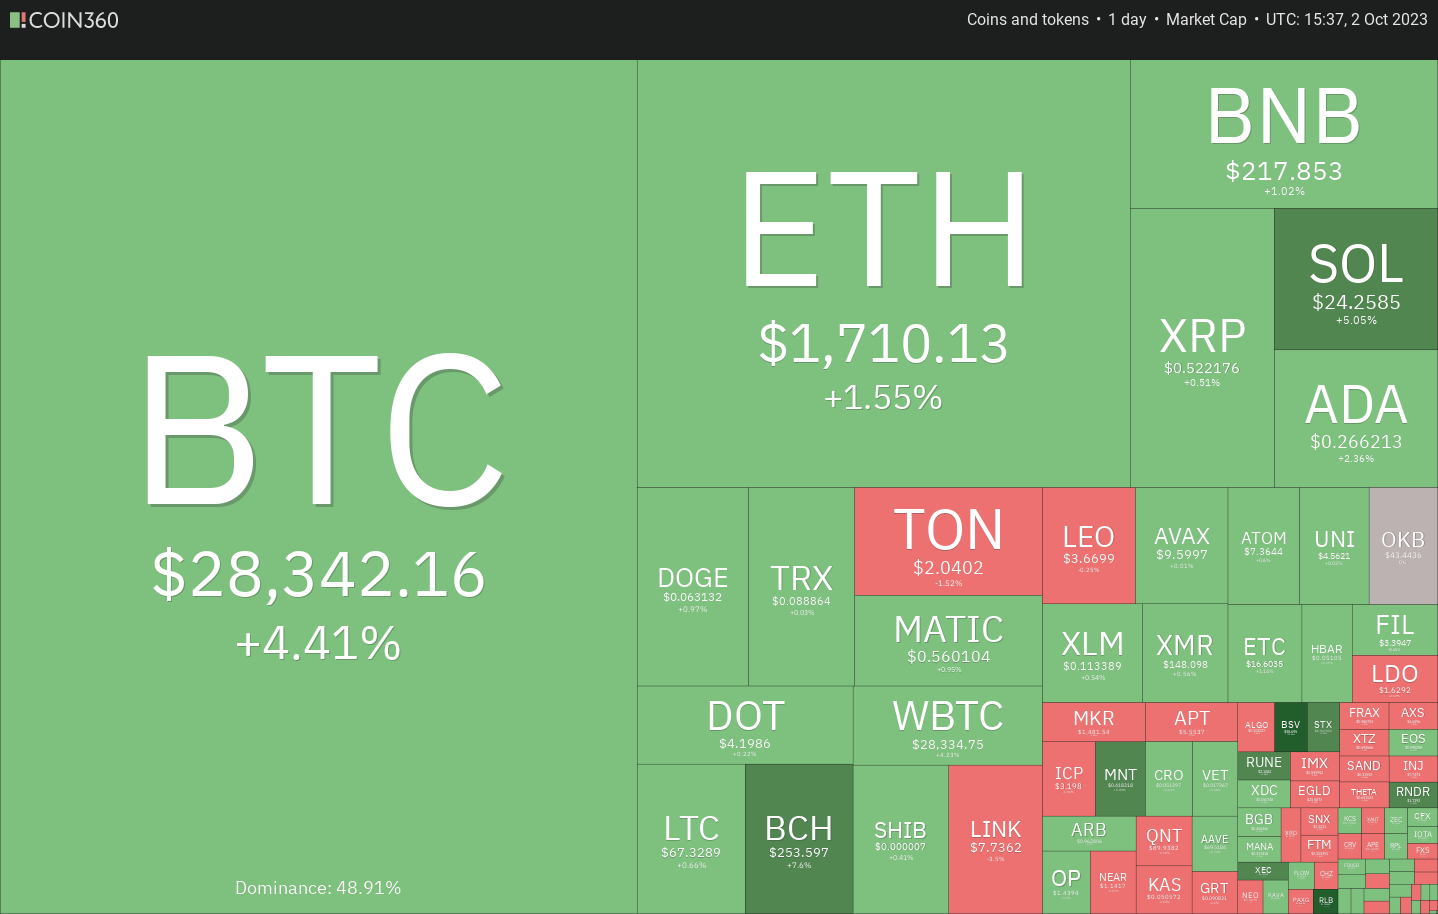 Daily cryptocurrency market performance. Source: Coin360
While a short-term upward movement is feasible in the cryptocurrency markets, it is improbable that it will initiate a sustained rally. Higher price levels are likely to see profit-taking, as the soaring U.S. dollar index (DXY) may keep bullish investors cautious.
What are the key overhead resistance levels in Bitcoin and altcoins that could entice sellers? Let’s examine the charts to uncover the details.
S&P 500 Index price analysis
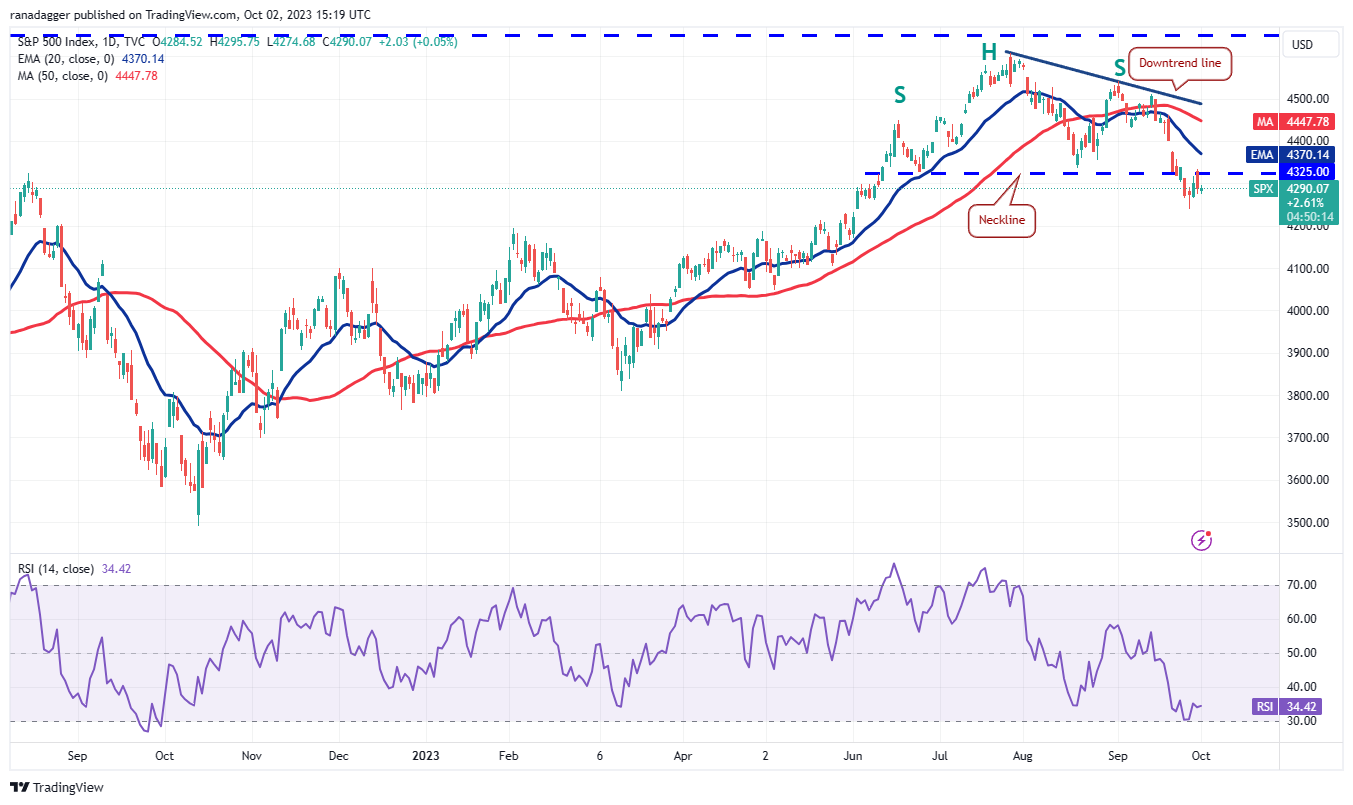
The S&P 500 Index fell below the significant support level of 4,325 on September 22, completing a bearish head and shoulders pattern, which signals the onset of a downward trend.
 SPX daily chart. Source: TradingView
Typically, the price rebounds and retests the breakdown level, which in this instance is 4,325. This occurred on September 29. The neckline of the pattern is expected to see a fierce contest between bulls and bears.
If the price declines and breaks below 4,238, it will indicate that bears are in control. This could accelerate selling, and the index may drop to the pattern target of 4,043.
Any recovery attempt is likely to encounter selling pressure at 4,325 and subsequently at the 20-day exponential moving average ($4,370). A breakthrough above this resistance would be the initial sign of strength. The index could then rise towards the downtrend line.
U.S. dollar index price analysis
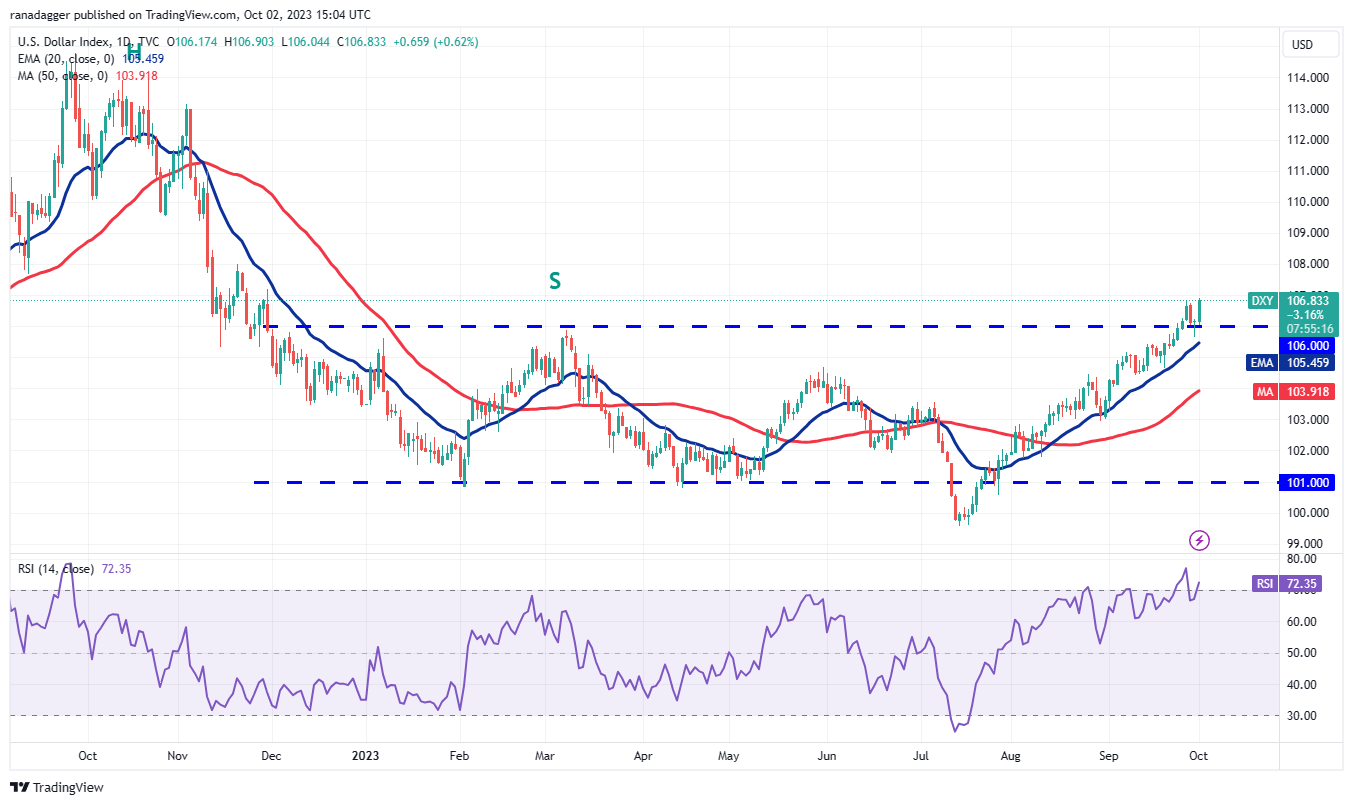
The U.S. dollar index has experienced a remarkable surge in recent days. The bulls pushed the price above the overhead resistance of 106 on September 26, signaling the beginning of a new uptrend.
 DXY daily chart. Source: TradingView
Sellers attempted to pull the price back below the breakout level of 106 on September 29, but the long tail on the candlestick indicates strong buying at lower levels. The bulls will aim to convert the 106 level into support. If successful, the index could rise to 108.
The bears are unlikely to concede easily. They will attempt to drag the price back below 106 and then the 20-day EMA. If they succeed, it could trap aggressive bulls. The index may then fall to the 50-day simple moving average ($103).
Bitcoin price analysis
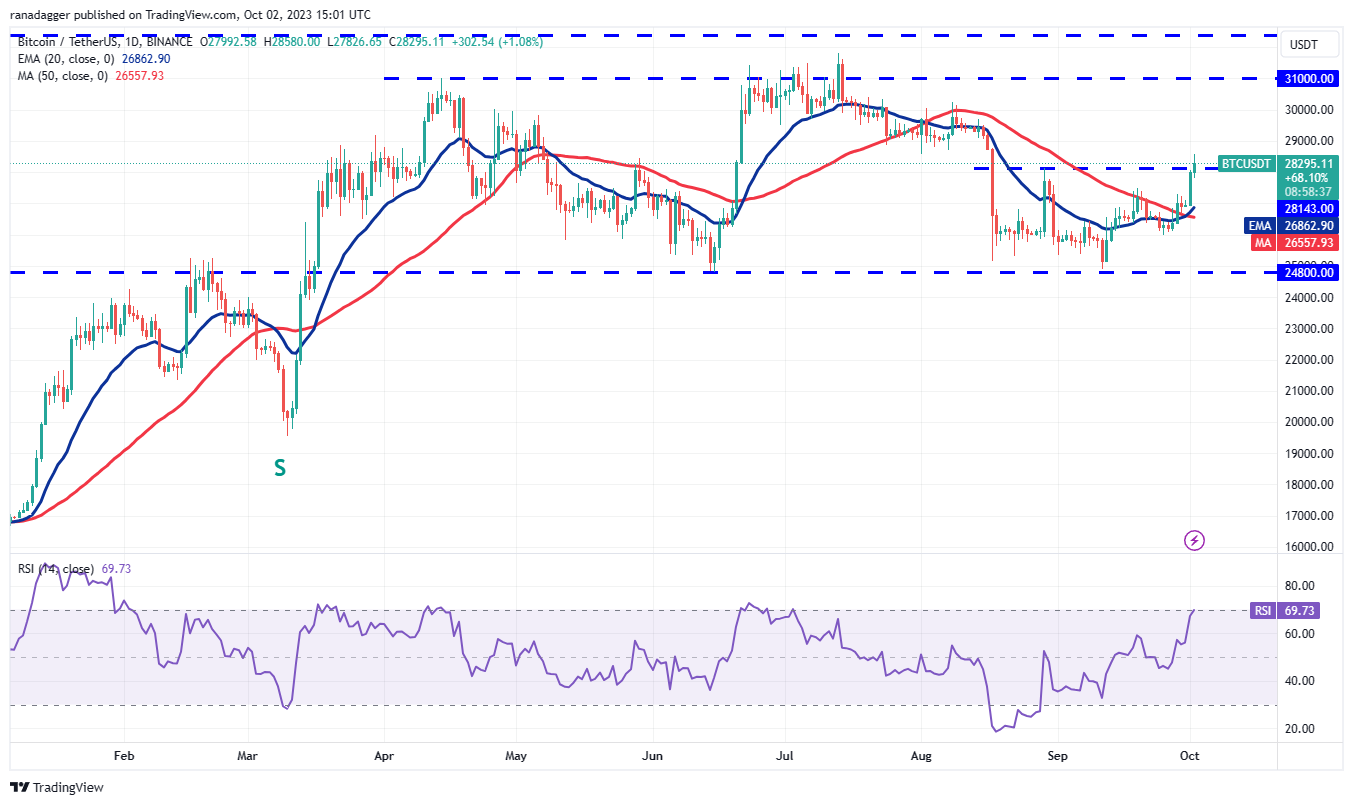
Bitcoin surged past the immediate resistance of $27,500 on October 1 and continued its rally above $28,143 on October 2. The ease with which $28,143 was surpassed suggests that further gains may be forthcoming.
 BTC/USDT daily chart. Source: TradingView
The bulls will attempt to elevate the price to $31,000, where they are likely to face significant resistance from the bears. A sharp decline from this level would indicate that the BTC/USDT pair remains confined within the broader range of $31,000 to $24,800.
The initial support on the downside is at $28,143, followed by the 20-day EMA ($26,862). If the price falls back below $28,143, it may trap aggressive bulls, potentially pulling the price down to the 20-day EMA. Sellers will need to push the price below this level to gain control.
Ether price analysis
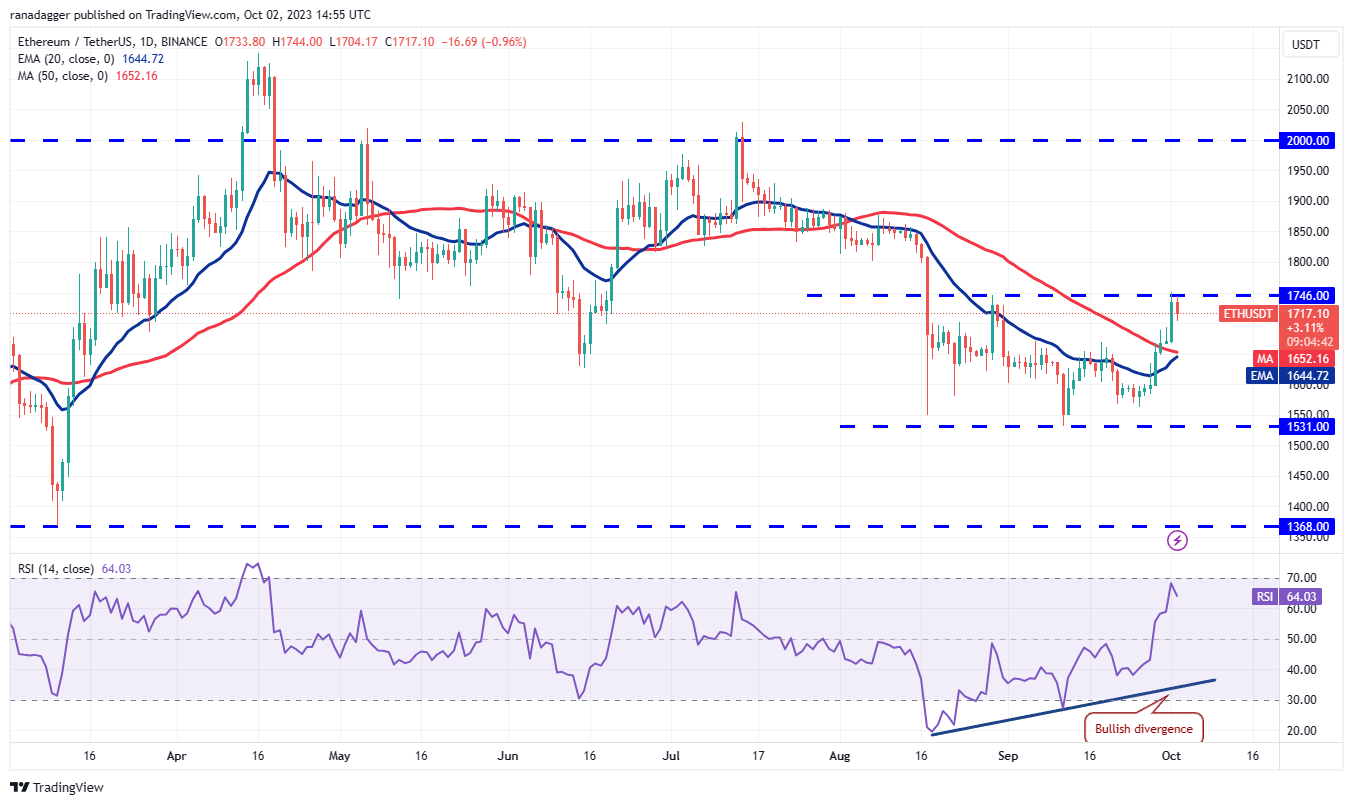
Ether (ETH) broke through the 50-day SMA ($1,652) on September 29 and followed with another sharp rally on October 1, pushing the price to the overhead resistance at $1,746.
 ETH/USDT daily chart. Source: TradingView
The 20-day EMA ($1,644) has turned upward, and the relative strength index (RSI) is above the 64 level, indicating that bulls are in control. This enhances the likelihood of a rally above $1,746. If achieved, the ETH/USDT pair will complete a double bottom pattern, which has a target objective of $1,959.
Sellers will strive to halt the recovery at $1,746. They must pull the price back below the moving averages to weaken the positive momentum. The pair may then remain within the range for an extended period.
BNB price analysis
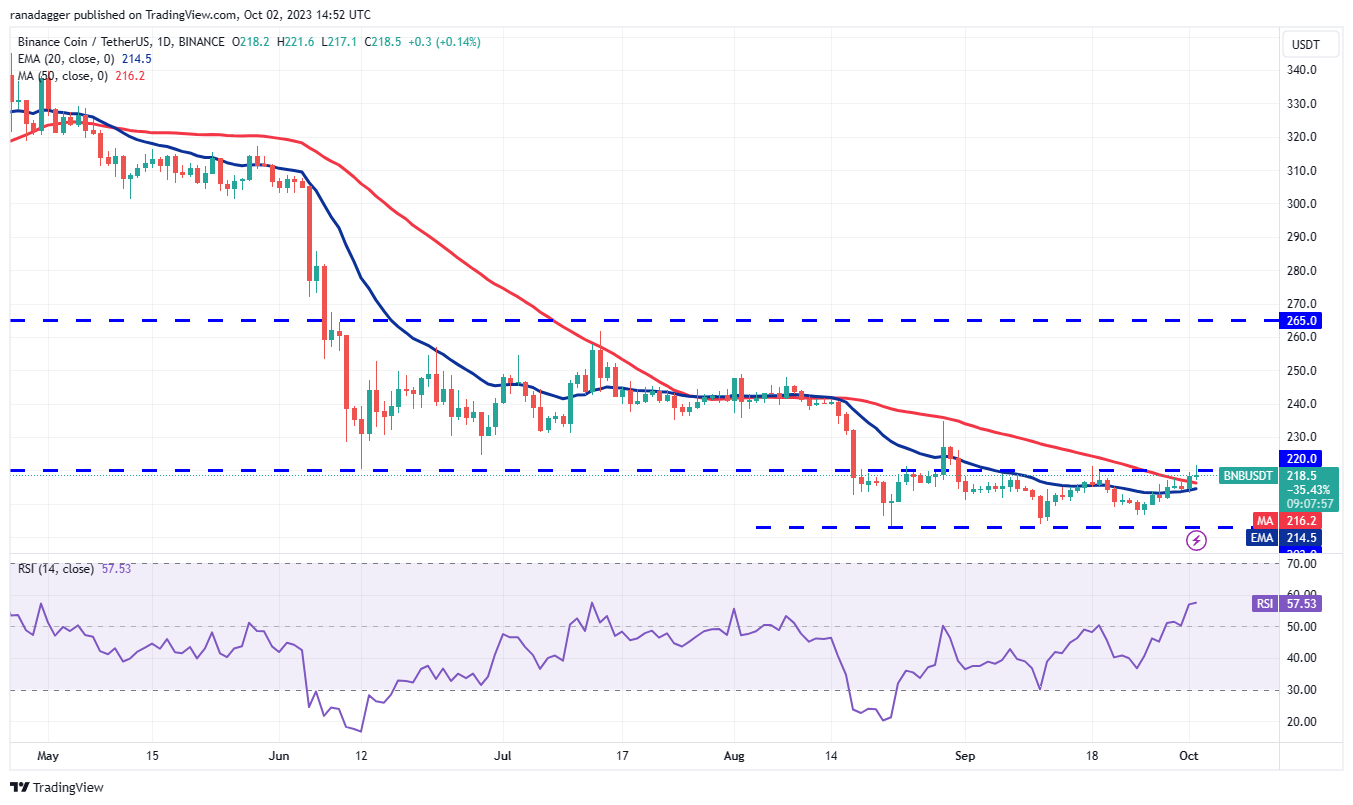
BNB (BNB) declined from the 50-day SMA ($216) on September 29 and 30 but found support at the 20-day EMA ($214). This indicates a positive sentiment where dips are being bought.
 BNB/USDT daily chart. Source: TradingView
Related Posts
The moving averages are nearing a bullish crossover, and the RSI is in positive territory, suggesting that bulls have the advantage. A break and close above $220 would indicate the beginning of a new uptrend. The BNB/USDT pair could initially rally to $235 and subsequently to $250.
Conversely, if the price declines from $220, the bears will again attempt to pull the pair below the 20-day EMA. If they succeed, it will indicate that the consolidation may continue for several more days.
XRP price analysis
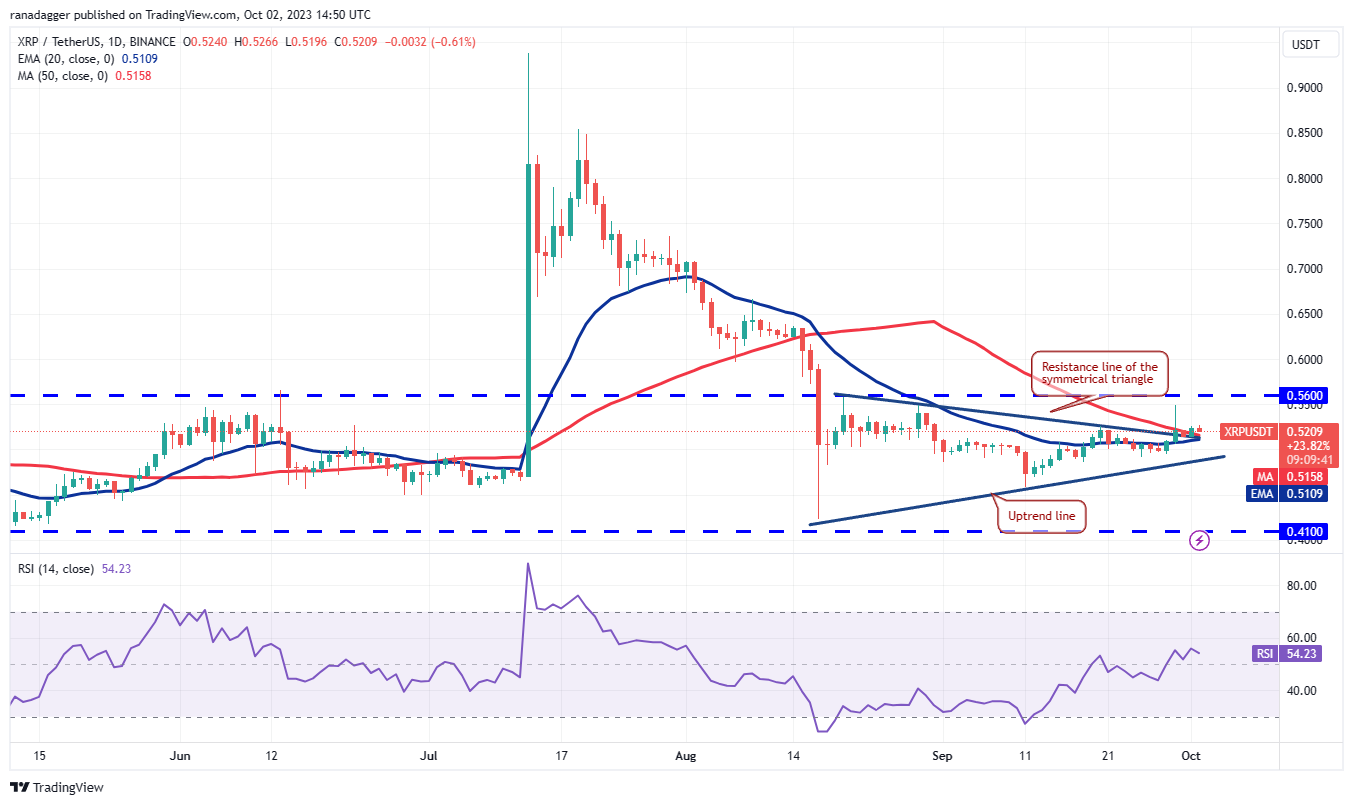
XRP (XRP) broke above the symmetrical triangle pattern on September 29, and the bulls maintained the retest of the breakout level on September 30. This indicates that bulls are re-entering the market.
 XRP/USDT daily chart. Source: TradingView
Buyers will next attempt to push the price to the overhead resistance at $0.56. This is a crucial level to monitor, as a rally above it could signal the beginning of a new uptrend toward the pattern target of $0.64.
Conversely, if the price declines from $0.56, it will suggest that the bears are still active and continue to sell on rallies. This could confine the XRP/USDT pair within the range of $0.41 to $0.56 for a longer duration.
Solana price analysis
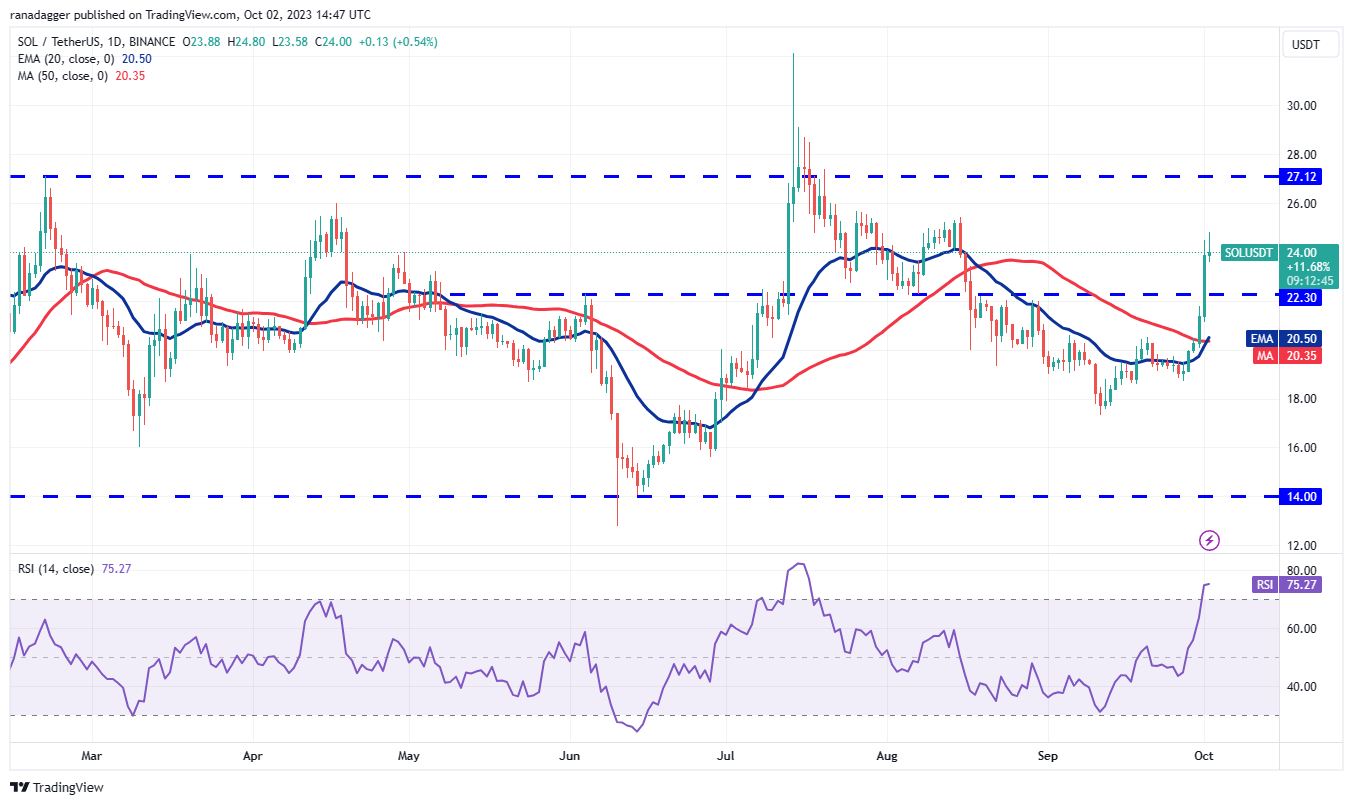
Solana (SOL) surged past the $22.30 overhead resistance on October 1, indicating that the bulls are making a comeback.
 SOL/USDT daily chart. Source: TradingView
The sharp upward movement has pushed the RSI into the overbought territory, suggesting that the rally may soon encounter resistance. The bears may attempt to halt the recovery at $25.50 and again at $27.12. A decline from this level would indicate that the range between $14 and $27.12 remains intact.
The key support to monitor on the downside is the 20-day EMA ($20.50). Sellers will need to pull the SOL/USDT pair back below this level to weaken the bullish momentum.
Related: BTC price knocks on $28.5K as trader says Bitcoin 'reeks of disbelief'
Cardano price analysis
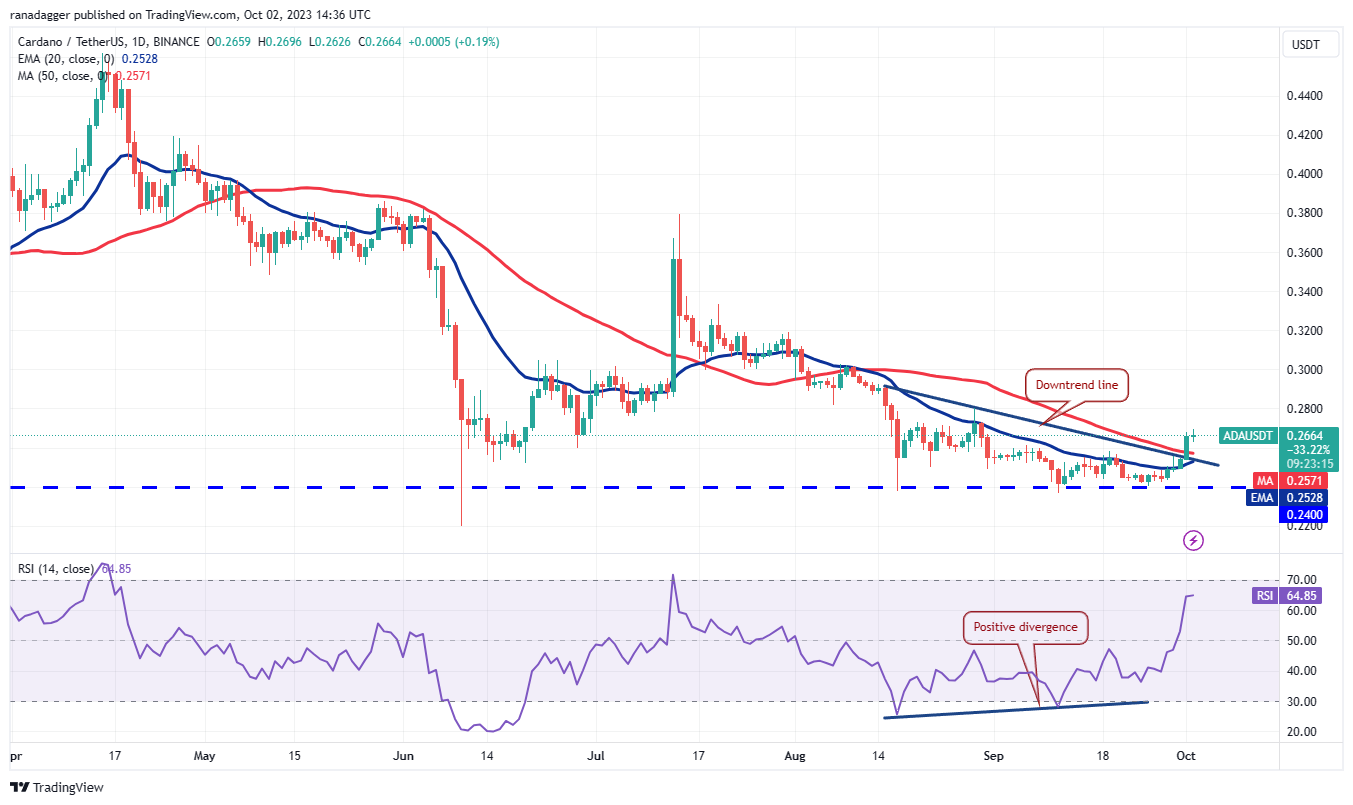
Cardano (ADA) surged above the downtrend line and the 50-day SMA ($0.25) on October 1, invalidating the developing bearish descending triangle pattern.
 ADA/USDT daily chart. Source: TradingView
Typically, the failure of a bearish setup is a positive indicator as bulls who have been waiting on the sidelines jump in to buy. However, prior to that, the price may decline and retest the breakout level.
If the level holds, it will indicate that the bulls have converted the downtrend line into support. The ADA/USDT pair could then initiate an upward movement to $0.29 and subsequently to $0.32.
Conversely, if the price declines and re-enters the triangle, it will suggest that the markets have rejected the higher levels. The pair may then retest the significant support at $0.24.
Dogecoin price analysis
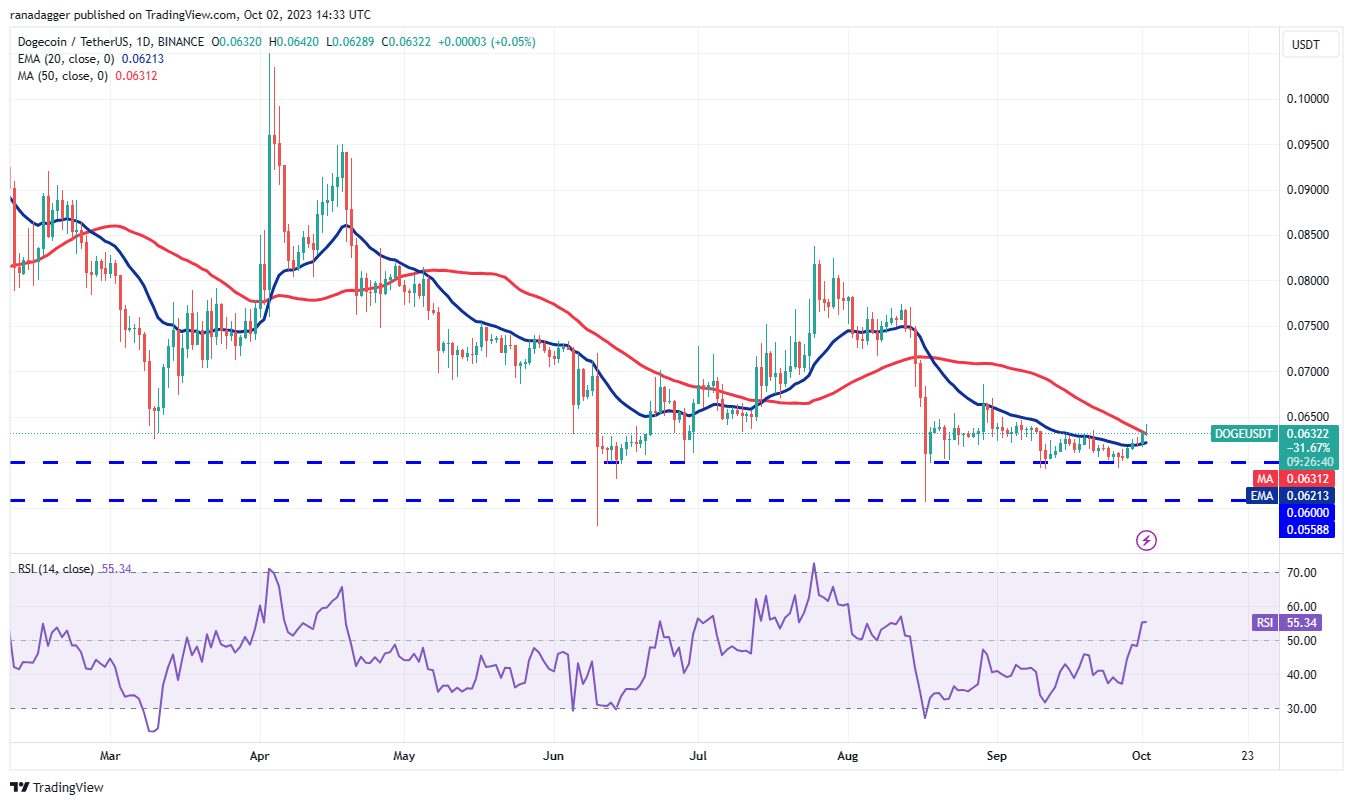
Dogecoin (DOGE) rose above the 20-day EMA ($0.06) on September 29 and reached the 50-day SMA ($0.06) on October 1. This indicates that the bulls are attempting to initiate an upward movement.
 DOGE/USDT daily chart. Source: TradingView
The 20-day EMA is relatively flat, but the RSI has moved into positive territory, suggesting that momentum is shifting positively. A close above the 50-day SMA would pave the way for a potential rally to $0.07. This level may present a minor obstacle, but if surpassed, the DOGE/USDT pair is likely to rise to $0.08.
Time is running out for the bears. If they wish to prevent the rally, they must quickly pull the price back below the 20-day EMA. The pair may then retest the critical support at $0.06.
Toncoin price analysis
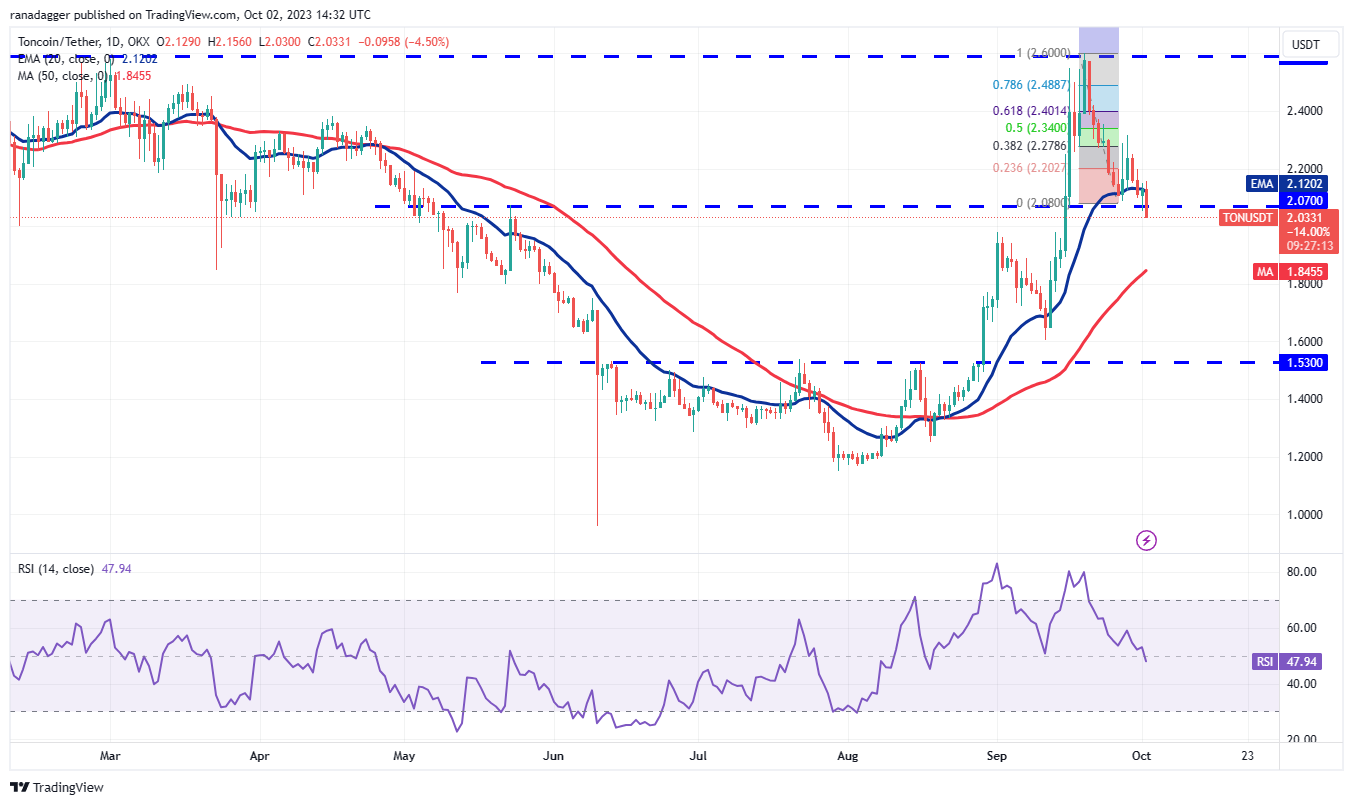
Toncoin’s (TON) relief rally stalled at $2.31 on September 28, indicating that bears are selling at higher levels. The price declined, but the bulls maintained the $2.07 support on October 1.
 TON/USDT daily chart. Source: TradingView
The bears resumed their selling on October 2, pulling the price below the crucial support at $2.07. If the price remains below this level, selling pressure could intensify, and the TON/USDT pair risks falling to the 50-day SMA ($1.84).
On the upside, the bulls must push the price above $2.31 to open the possibility of retesting the overhead resistance at $2.59. This level may again attract aggressive selling from the bears.
This article does not contain investment advice or recommendations. Every investment and trading move involves risk, and readers should conduct their own research when making a decision.