Disclaimer: Information found on CryptoreNews is those of writers quoted. It does not represent the opinions of CryptoreNews on whether to sell, buy or hold any investments. You are advised to conduct your own research before making any investment decisions. Use provided information at your own risk.
CryptoreNews covers fintech, blockchain and Bitcoin bringing you the latest crypto news and analyses on the future of money.
Trust in the U.S. financial system appears to be diminishing rapidly, with investors searching for the next potential failure. Bill Ackman, CEO of hedge fund management company Pershing Square, warned that there is little time left to address the issue.
The U.S. stock markets have shown susceptibility to negative news regarding regional banks, as evidenced by the sell-off over the last three days. In contrast, Bitcoin (BTC) has remained resilient, trading close to its significant resistance level at $31,000.
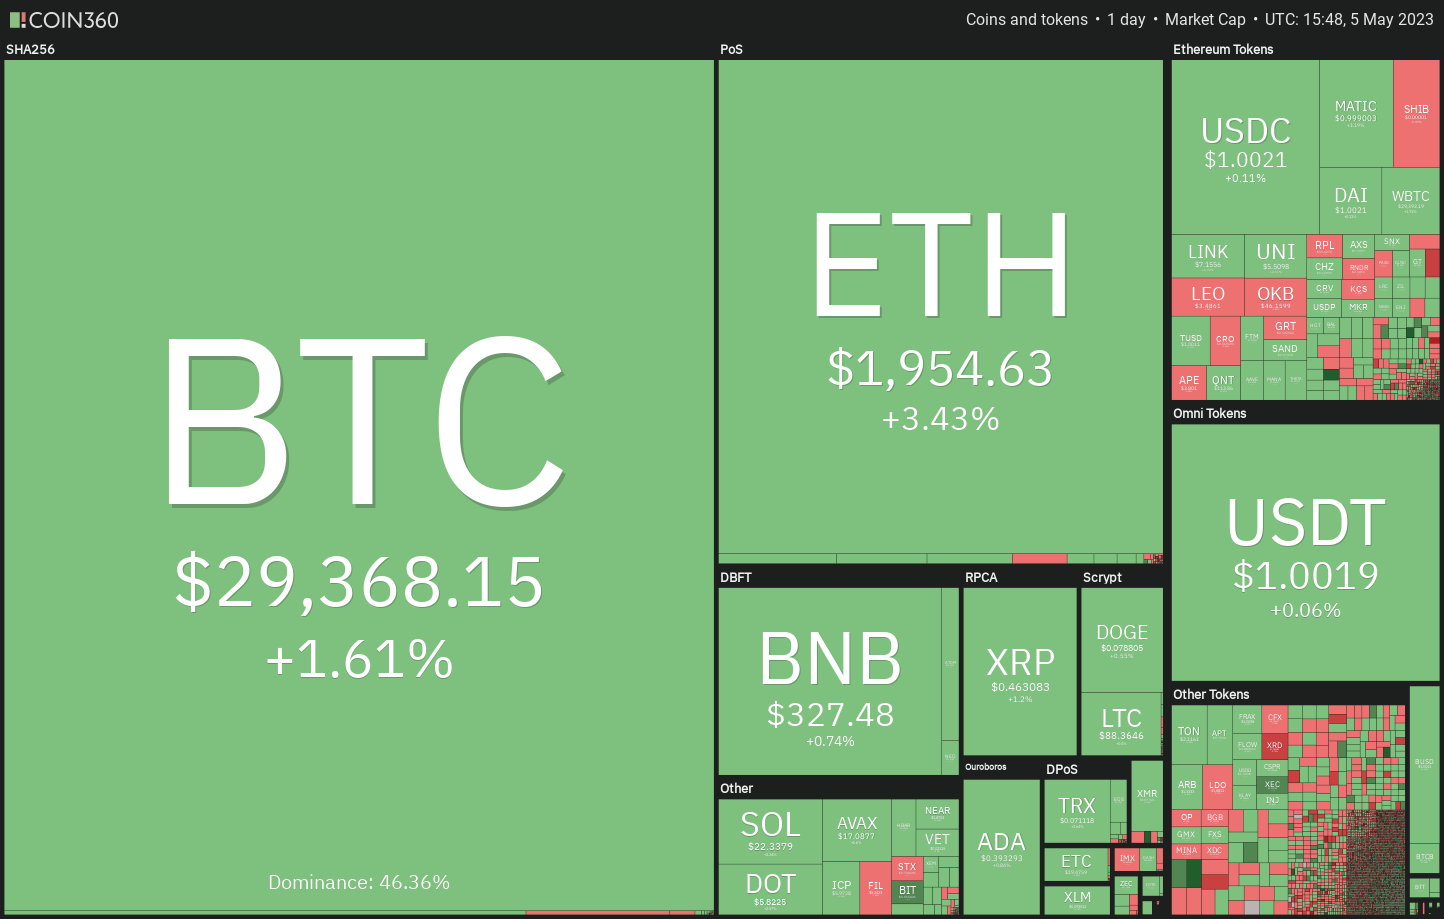 Daily cryptocurrency market performance. Source: Coin360
Bitcoin is not the sole asset showing strong performance. Gold has approached its historical peak during the week, indicating that Bitcoin is currently acting as a safe-haven asset, with investors incorporating it into their portfolios alongside gold.
Can Bitcoin break through the $31,000 barrier and continue its upward trajectory? Will altcoins follow Bitcoin’s lead? Let’s analyze the charts of the top-10 cryptocurrencies to find out.
Bitcoin price analysis
Bitcoin remains within a symmetrical triangle pattern, reflecting uncertainty among buyers and sellers. Typically, the trend that existed prior to the triangle’s formation tends to resume, suggesting a potential breakout to the upside.
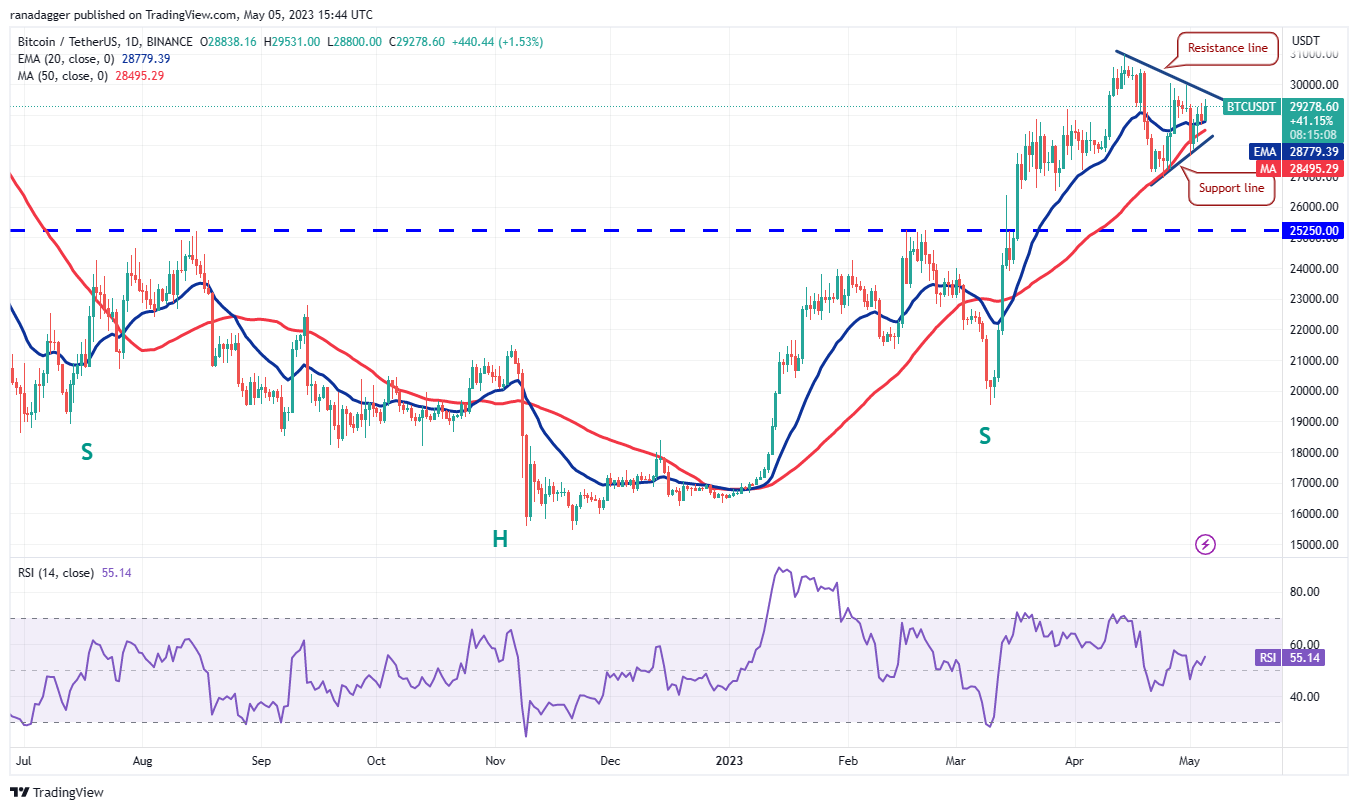 BTC/USDT daily chart. Source: TradingView
If the price closes above the triangle, the BTC/USDT pair could surge to $32,400. Bears are anticipated to mount a strong defense at this level, as a move above $32,400 could propel the rally to $40,000.
Conversely, if the price declines from the resistance line, it may indicate that the pair could continue its erratic price movements within the triangle for a few more days.
A break and close below the triangle would signify that bears have gained the upper hand. The pair may then drop to $25,250.
Ethereum price analysis
The bulls managed to push Ether (ETH) above the resistance line of the symmetrical triangle pattern on May 5, indicating that they absorbed the selling pressure and emerged victorious.
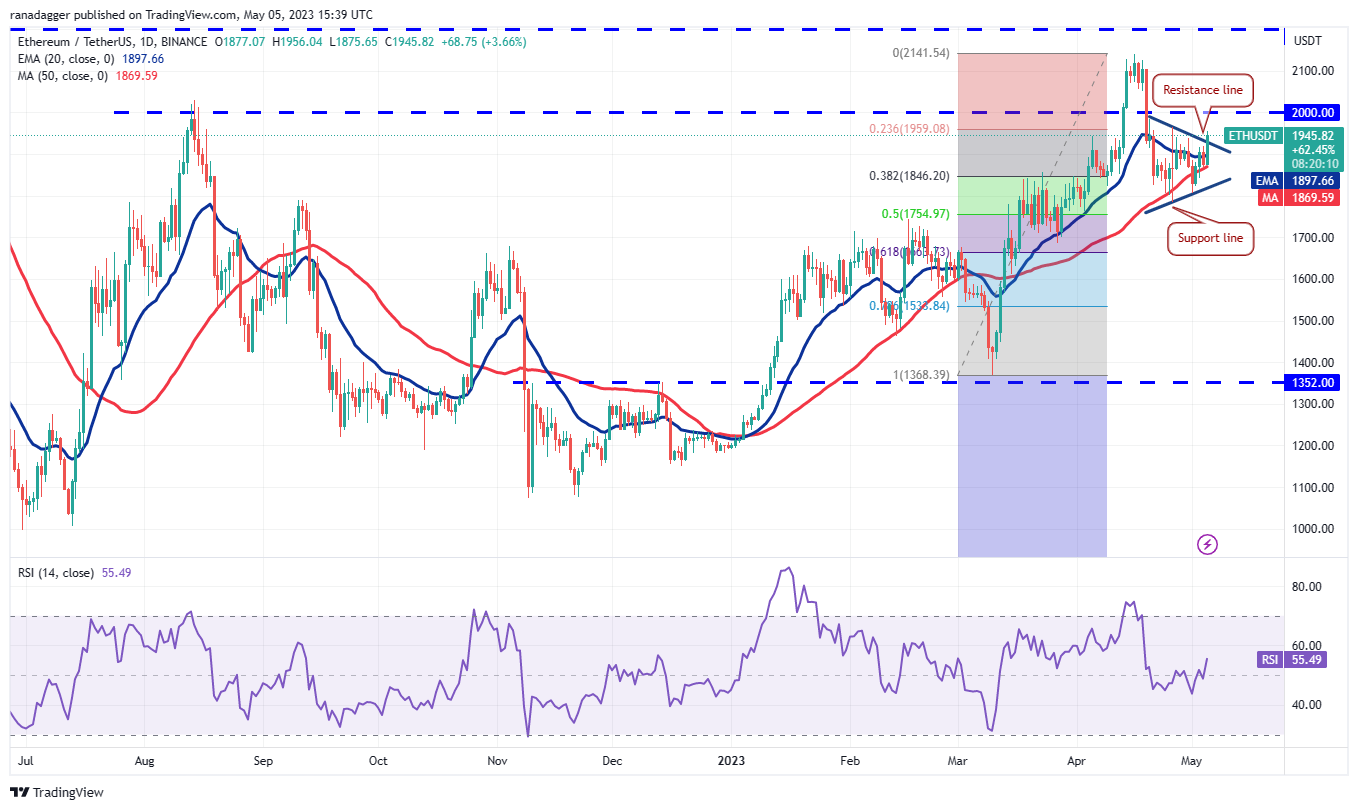 ETH/USDT daily chart. Source: TradingView
If buyers maintain the price above the triangle, the ETH/USDT pair could initially rise to $2,000 and then attempt to reach $2,200. Bears are likely to defend this level aggressively; if they fail, the pair may soar toward $3,000.
In contrast, if the price declines from the current level and re-enters the triangle, it would suggest that the breakout may have been a bull trap. The pair could then drop back to the support line, with a break below this level potentially leading to a target of $1,619.
BNB price analysis
BNB (BNB) is experiencing a fierce contest between bulls and bears near the support line of the symmetrical triangle pattern.
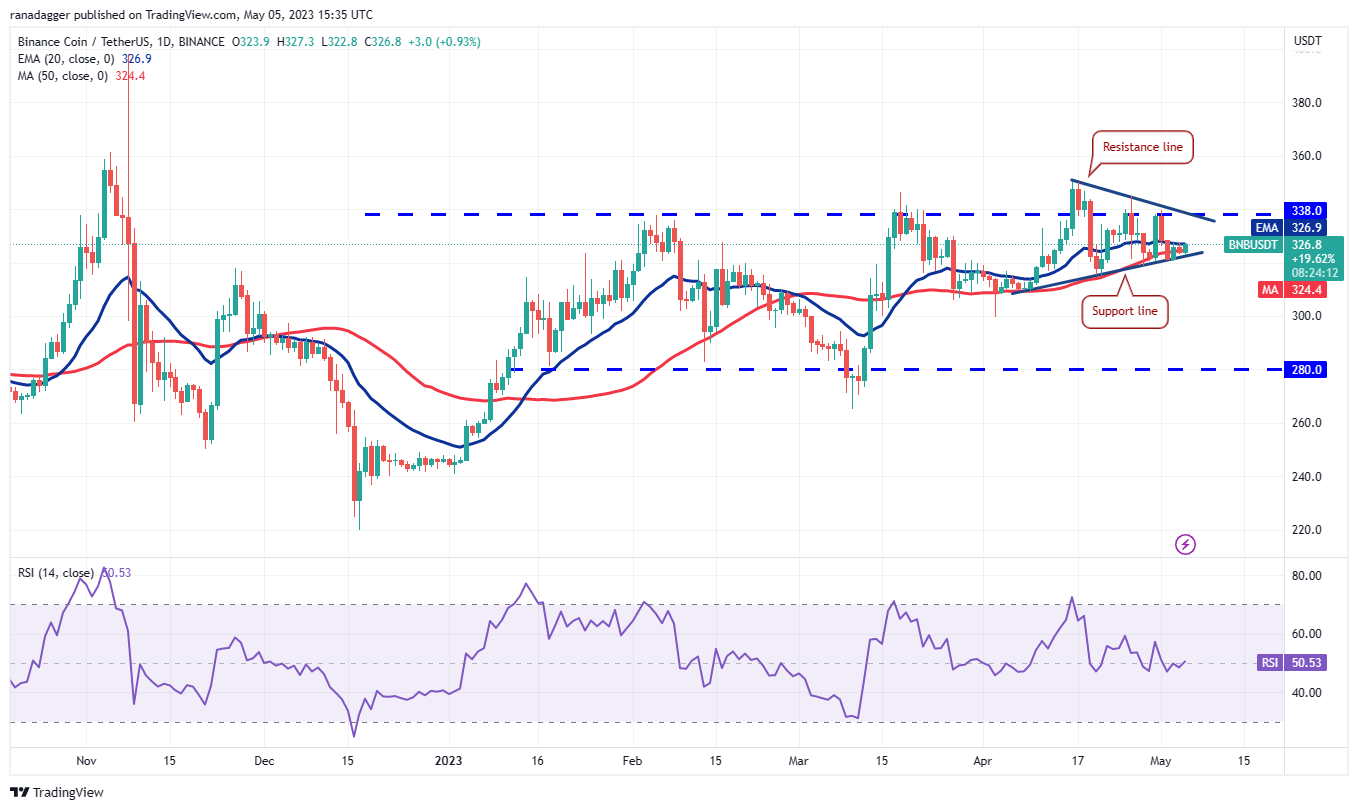 BNB/USDT daily chart. Source: TradingView
The flat 20-day EMA ($326) and the RSI near the midpoint do not provide a clear advantage to either bulls or bears. If the price breaks above the 20-day EMA, the BNB/USDT pair may continue to fluctuate within the triangle for some time.
A break below the triangle would indicate that bears have taken control, likely initiating a downward move to $300 and then to the pattern target of $280. For bulls to gain the upper hand, they must push the price above the triangle, which would clear the way for a potential rally to $350 and then $400.
XRP price analysis
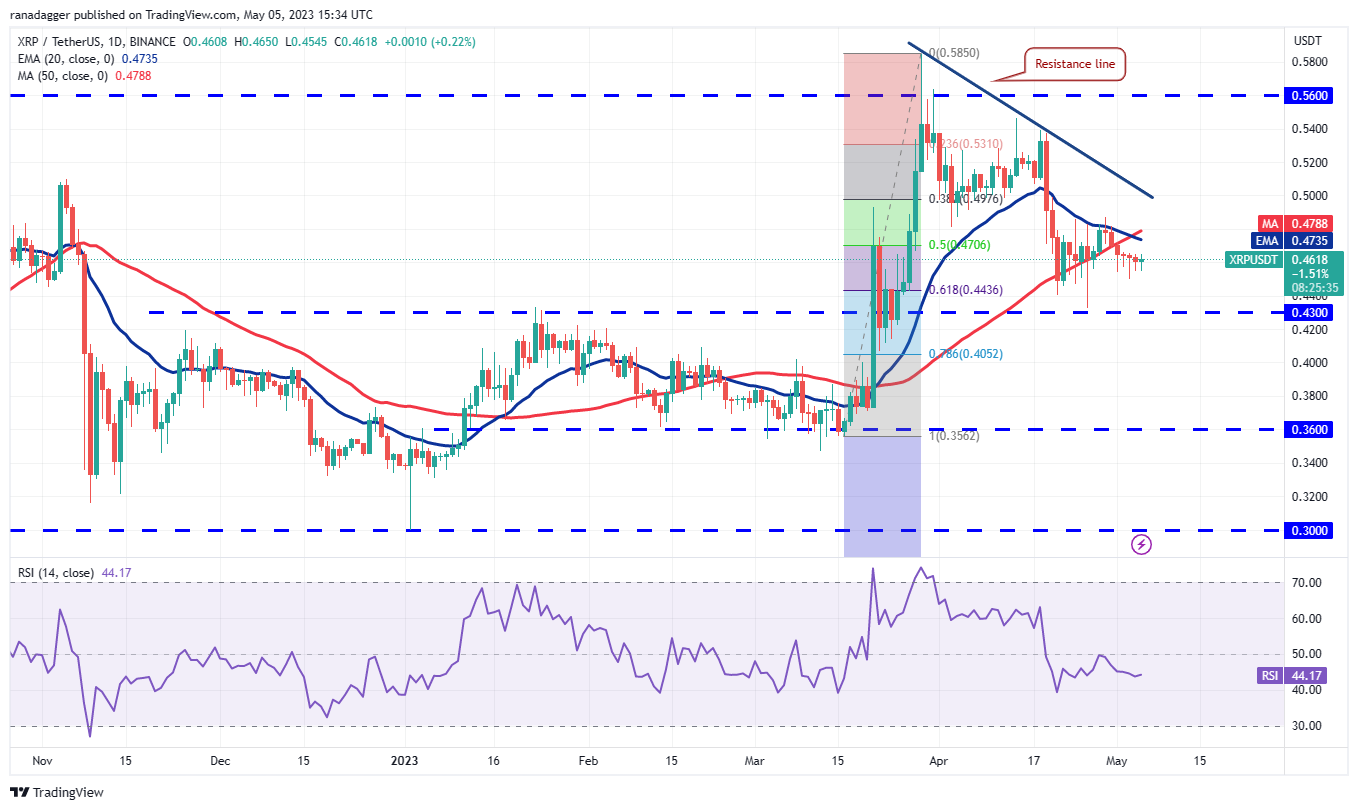
XRP (XRP) formed an inside-day candlestick pattern on May 4 and a Doji candlestick pattern on May 5, indicating that both bulls and bears are exercising caution and refraining from making significant bets.
 XRP/USDT daily chart. Source: TradingView
The moving averages have completed a bearish crossover, and the RSI is in negative territory, suggesting that bears hold a slight advantage. They will attempt to push the price down to the strong support at $0.43.
On the other hand, if the price rises from the current level and breaks above the 20-day EMA ($0.47), it will indicate strong buying interest at lower levels. The XRP/USDT pair may then rise to the resistance line, where buyers will need to overcome this barrier to enable a rally to $0.54.
Cardano price analysis
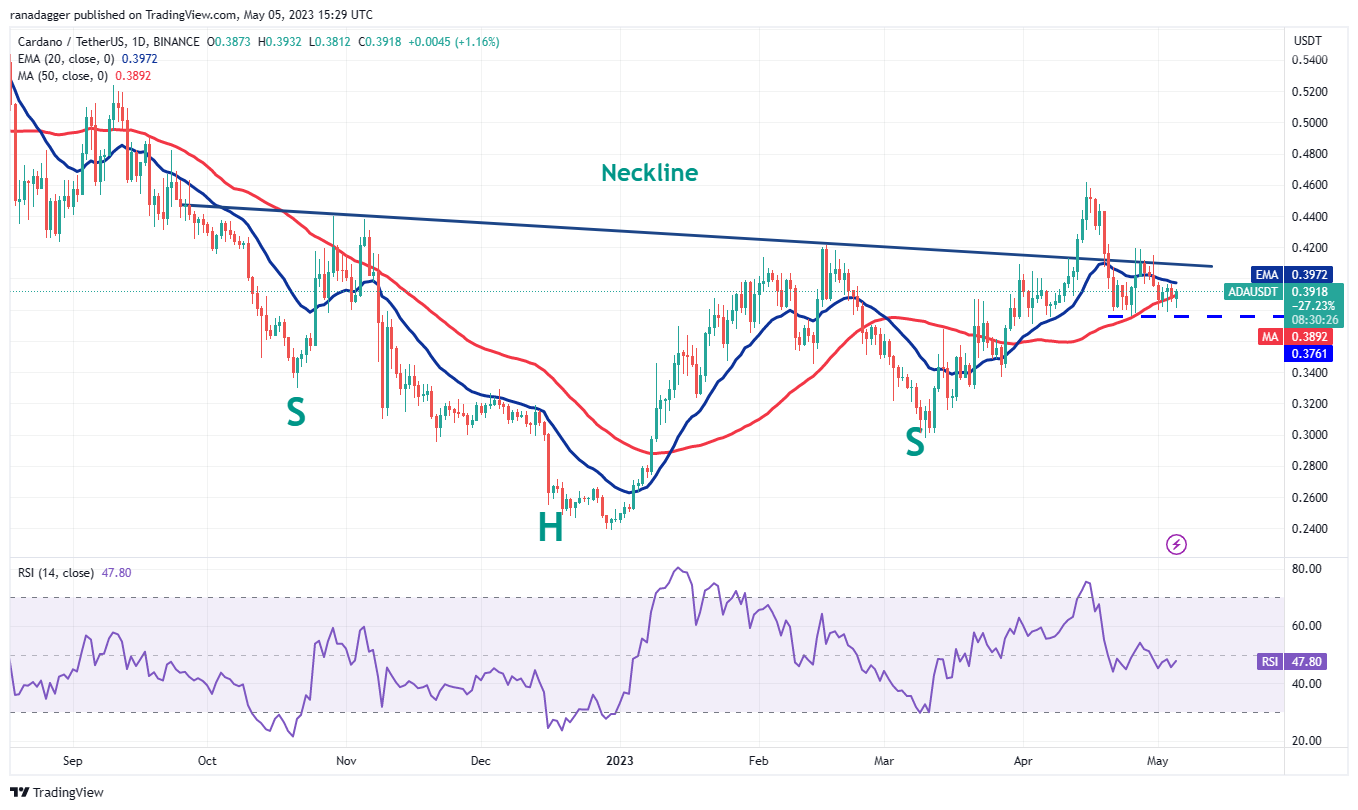
Cardano (ADA) fell below the 50-day simple moving average ($0.38) on May 3 and 5, but the long tail on the candlestick indicates that bulls are vigorously defending the support near $0.37.
 ADA/USDT daily chart. Source: TradingView
Related Posts
Buyers attempted to push the price above the 20-day EMA ($0.39) on May 4, but bears resisted. The declining 20-day EMA and the RSI just below the midpoint suggest a slight advantage for the bears. If the price declines and falls below $0.37, selling pressure could increase, and the ADA/USDT pair may drop to $0.33 and then $0.30.
If bulls wish to avert this decline, they must quickly push the price above the neckline of the inverse head and shoulders pattern, which could enhance the chances of a rally to $0.46 and subsequently $0.52.
Dogecoin price analysis
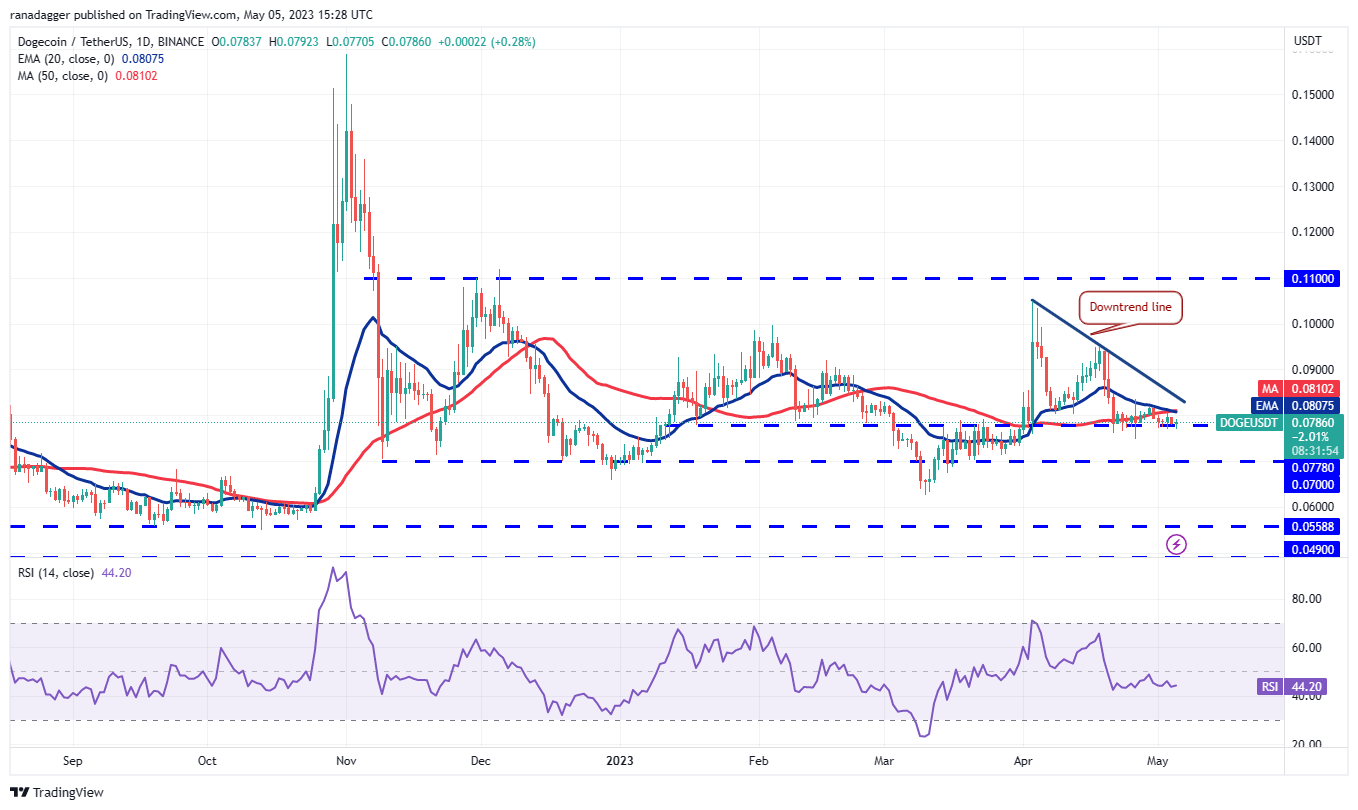
The bulls have succeeded in keeping Dogecoin (DOGE) above the immediate support near $0.08, but they have not managed to generate a significant rebound from this level, indicating a decrease in demand at higher prices.
 DOGE/USDT daily chart. Source: TradingView
A tight consolidation near a strong support level typically resolves to the downside. The declining 20-day EMA ($0.08) and the RSI in the negative zone also suggest that the path of least resistance is downward.
If the support near $0.08 fails, the DOGE/USDT pair may fall to the next significant support at $0.07. This negative outlook will be invalidated in the short term if buyers push the DOGE price above the downtrend line.
Polygon price analysis
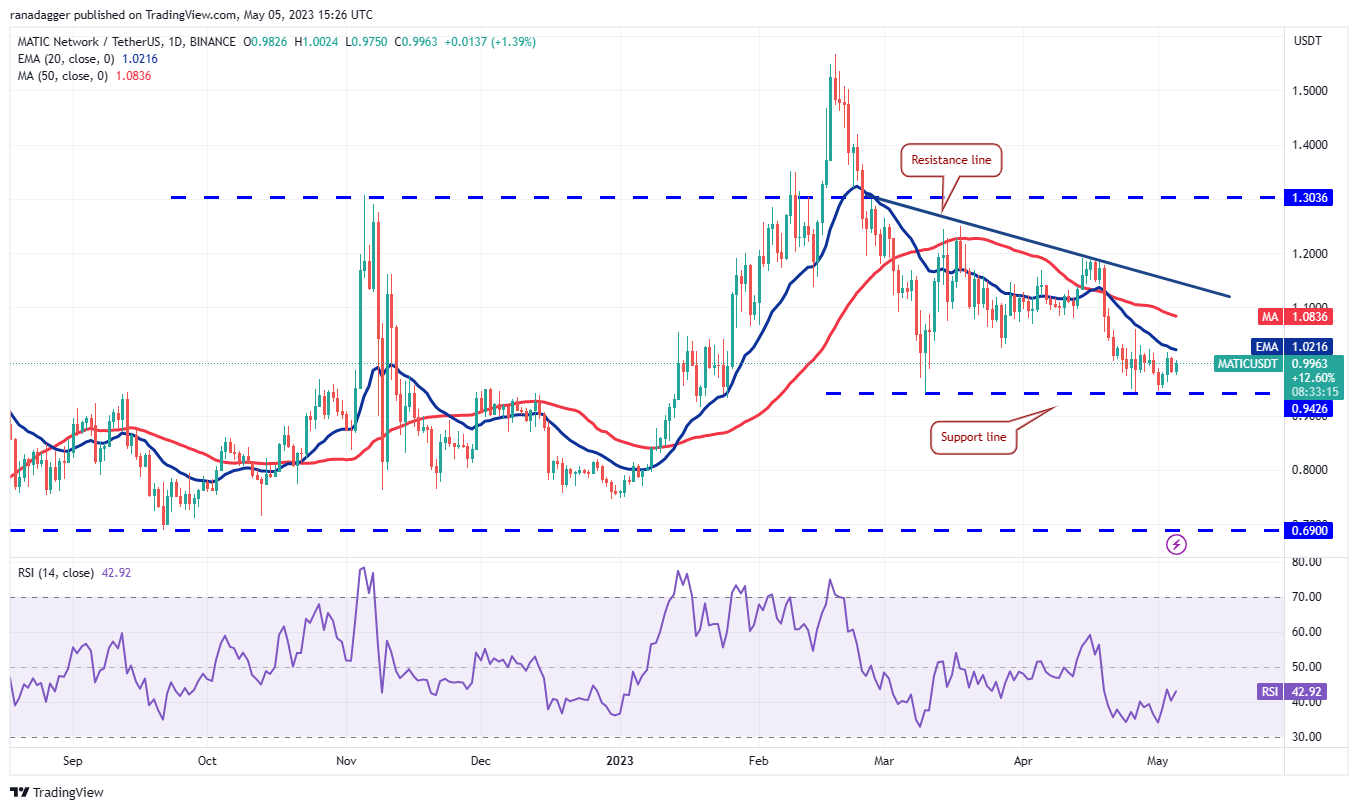
Polygon (MATIC) attempted to rise above the 20-day EMA ($1.02) on May 3 and 4, but bears successfully defended this level.
 MATIC/USDT daily chart. Source: TradingView
The declining moving averages and the RSI near 43 indicate that bears are in control. If the price declines and breaks below $0.94, the MATIC/USDT pair will complete a descending triangle pattern, potentially initiating a downward move toward $0.69.
Conversely, if the price rises above the 20-day EMA, it will suggest that buyers are still active at lower levels. The pair could then rally to the resistance line, where bears are likely to sell aggressively once more.
Related: SUI price drops 70% from market debut top amid excessive supply concerns
Solana price analysis
Solana (SOL) has been trading within a narrow range for the past three days, indicating indecision among buyers and sellers.
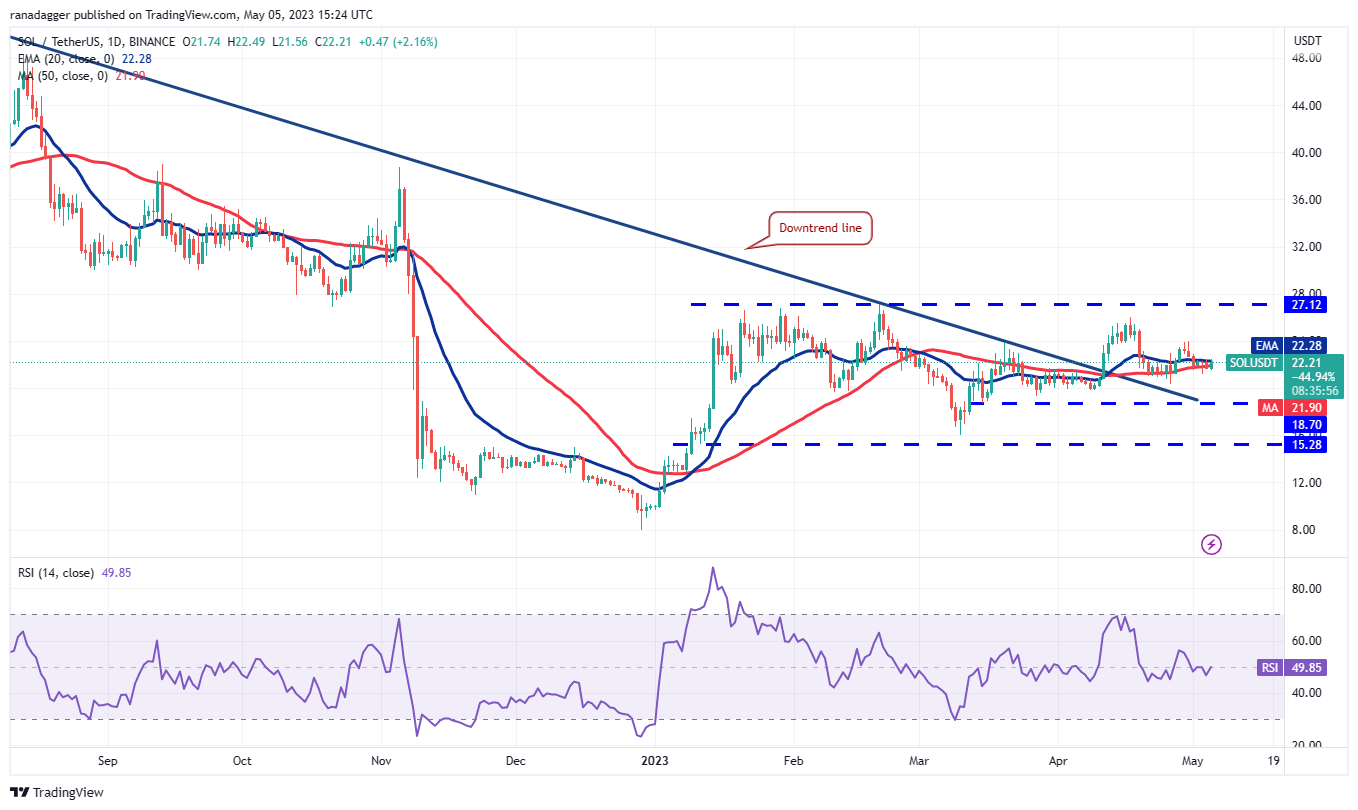 SOL/USDT daily chart. Source: TradingView
The flat moving averages and the RSI near the midpoint suggest that the SOL/USDT pair may remain confined within the broader range of $15.28 to $27.12 for some time. If the price drops and sustains below the 50-day SMA ($21.90), it will indicate that bears have the upper hand in the near term, potentially leading to a decline to $18.70.
Conversely, if buyers push the price above the 20-day EMA, the pair may begin its ascent toward $24 and then $27.12.
Polkadot price analysis
Sellers pulled Polkadot (DOT) below the $5.70 support on May 3, but the long tail indicates strong buying at lower levels. Bulls again thwarted the bears’ attempts to break the support on May 4 and 5.
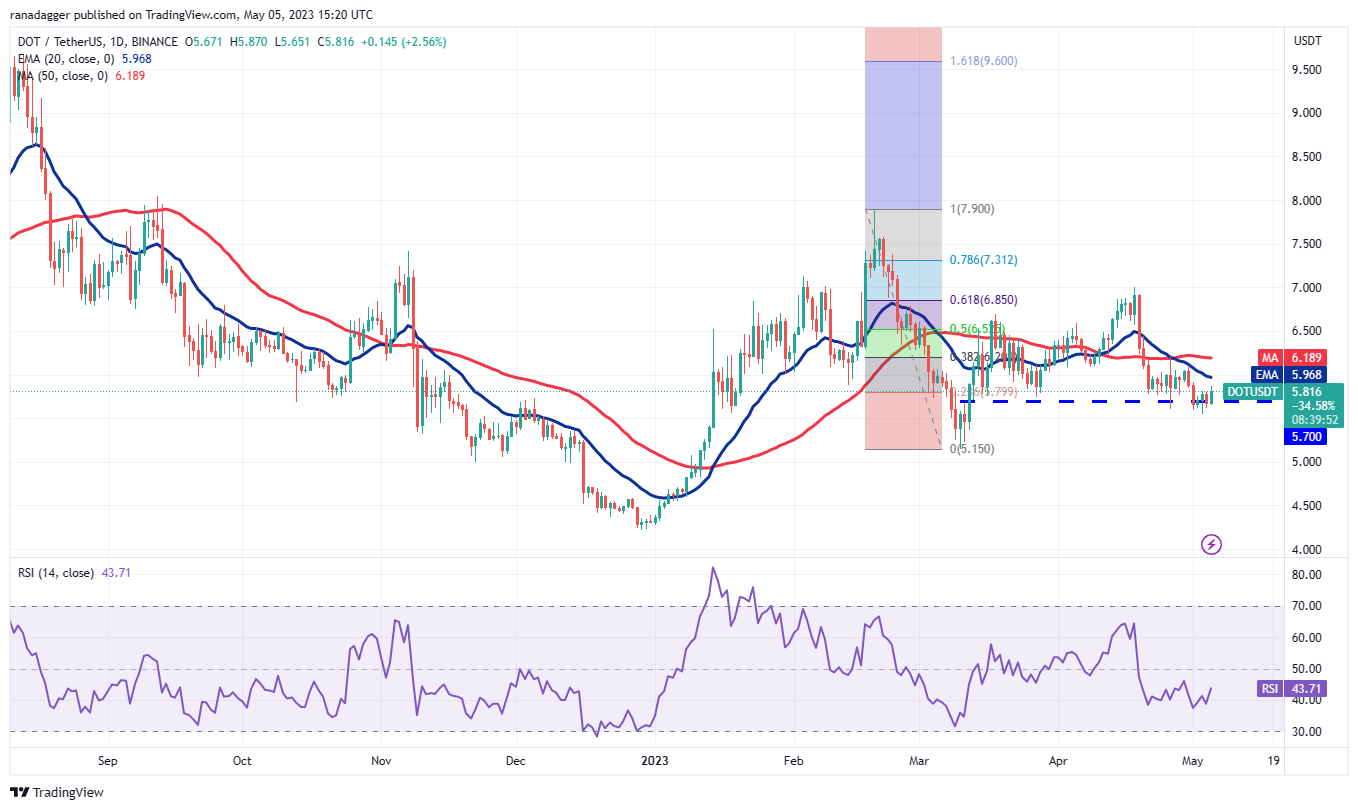 DOT/USDT daily chart. Source: TradingView
The repeated inability to maintain the price below $5.70 may attract buyers, who will then attempt to push the price above the 20-day EMA ($5.96). If successful, the DOT/USDT pair could rise to the 50-day SMA ($6.18). Buyers will need to overcome this resistance to gain the upper hand in the near term, with the next target on the upside being $7.
Alternatively, if the price declines from the 20-day EMA, it would suggest that bears continue to sell during minor rallies. Sellers will then likely attempt to pull the price below $5.70 and challenge the critical support at $5.15.
Litecoin price analysis
The long tail on Litecoin’s (LTC) May 3 and 5 candlestick indicates that bulls are vigorously defending the $85 level, but they are struggling to surpass the overhead resistance at the moving averages.
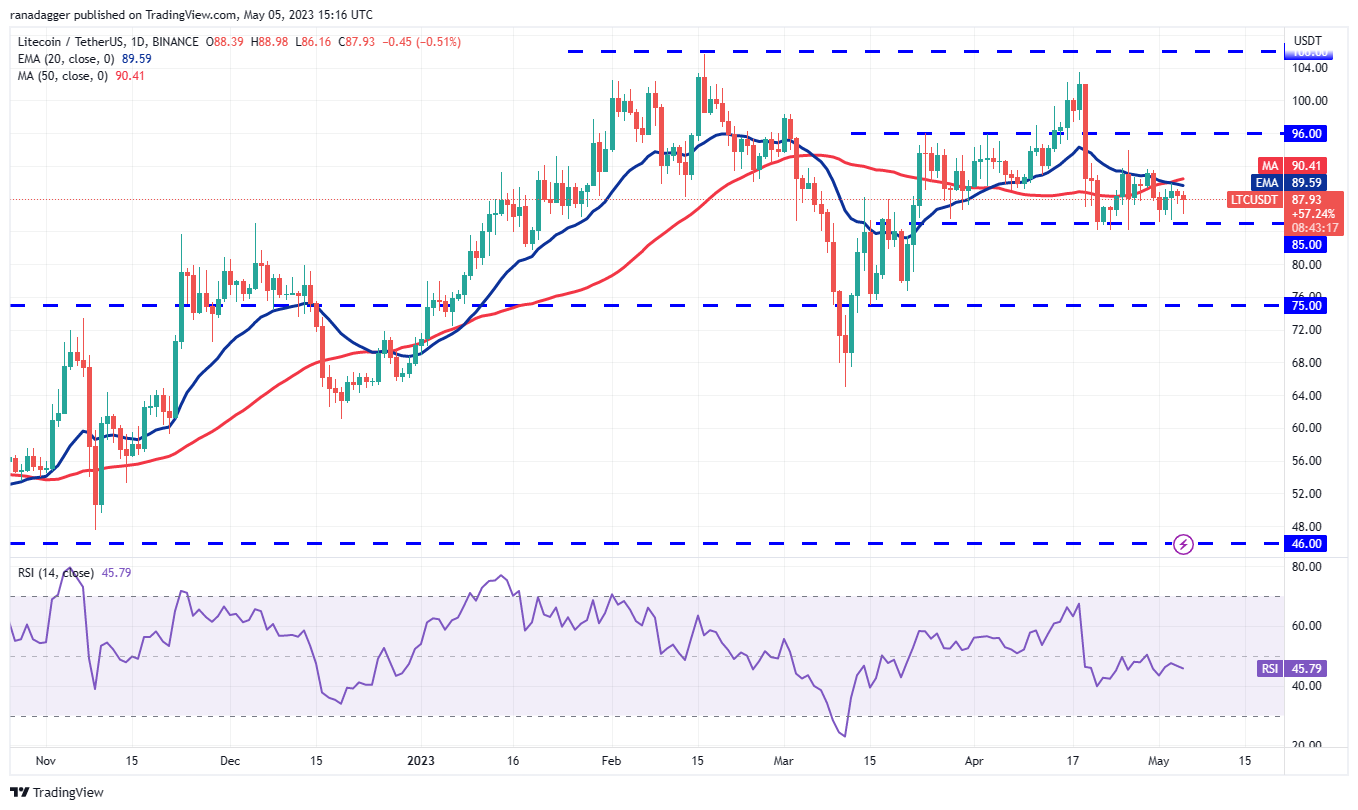 LTC/USDT daily chart. Source: TradingView
The LTC/USDT pair is trapped in a narrow range, with bulls buying on dips and bears selling on rallies. The 20-day EMA ($89) is trending downward, and the RSI is just below the midpoint, indicating a slight advantage for the bears. A break below the $85 level would suggest that bears have taken control, potentially leading to a drop to $75.
Conversely, if buyers push the price above the moving averages, the pair could rally to the overhead resistance at $96. If the price declines from this level, it would indicate a possible range-bound movement between $85 and $96 for several days.
This article does not contain investment advice or recommendations. Every investment and trading move involves risk, and readers should conduct their own research when making a decision.