Disclaimer: Information found on CryptoreNews is those of writers quoted. It does not represent the opinions of CryptoreNews on whether to sell, buy or hold any investments. You are advised to conduct your own research before making any investment decisions. Use provided information at your own risk.
CryptoreNews covers fintech, blockchain and Bitcoin bringing you the latest crypto news and analyses on the future of money.
On October 3, 10-year Treasury yields in the United States surged past 4.8%, marking their highest point since 2007. Jeffrey Gundlach, CEO of DoubleLine Capital, noted in a post on X (formerly Twitter) that the gap between the 2-year and 10-year Treasury yields has decreased from 109 basis points a few months prior to 35 basis points. He warned that this “should put everyone on recession alert.”
Arthur Hayes, the former CEO of the crypto exchange BitMEX, cautioned in a recent thread on X that the government may need to print money to stabilize the bond market, as a rapid bear steepener—where long-term interest rates rise more swiftly than short-term rates—could lead to the collapse of firms. Some investors speculate that this scenario might ignite a bull market in cryptocurrencies.
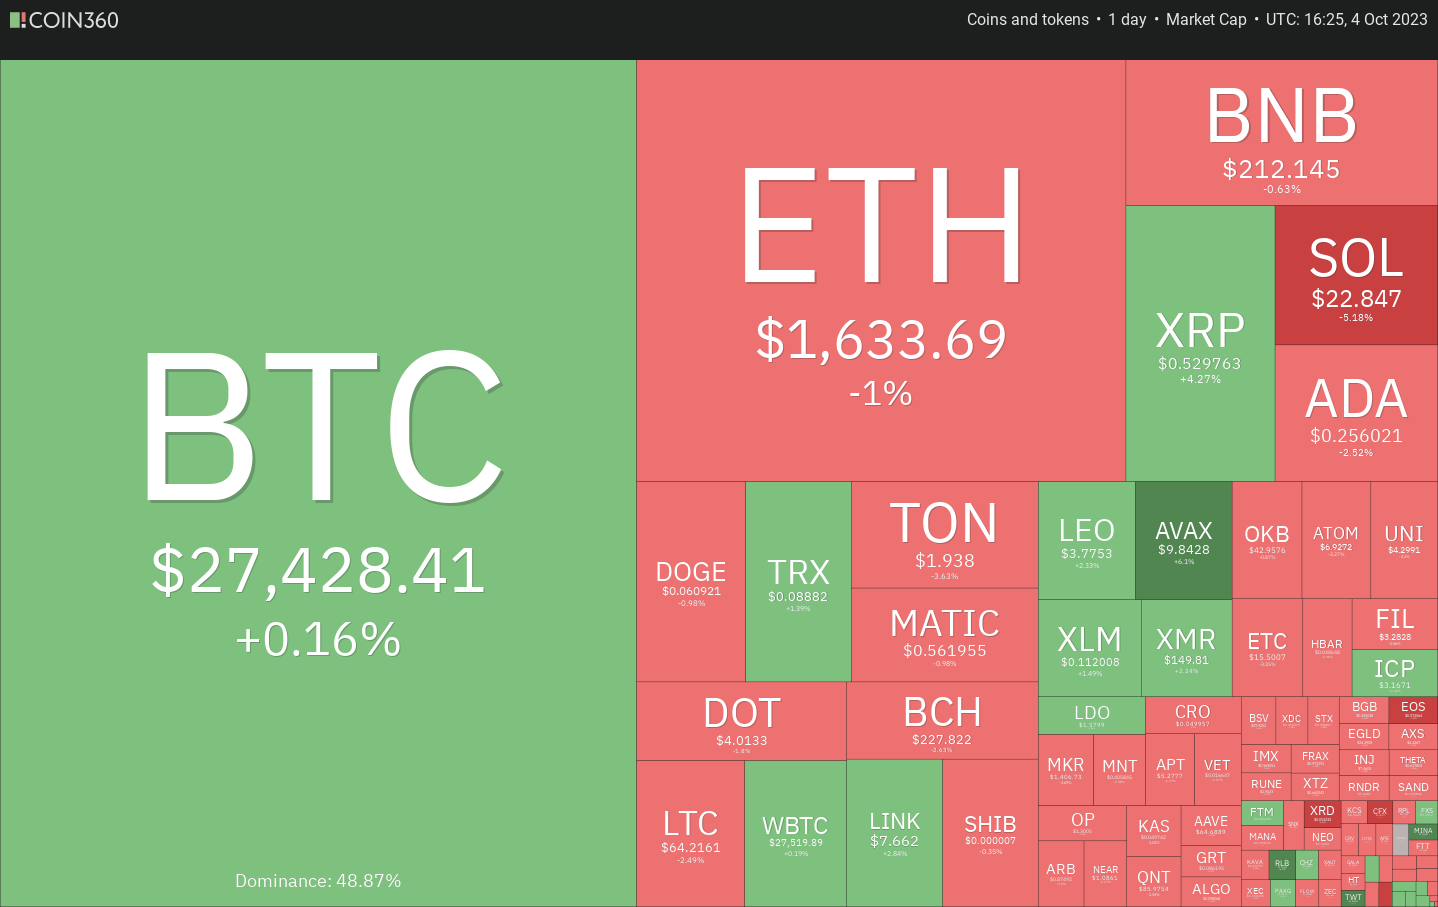 Daily cryptocurrency market performance. Source: Coin360
It appears that institutional investors are beginning to show increased interest in cryptocurrencies. The latest Digital Asset Fund Flows Weekly Report from CoinShares indicates inflows of $21 million into digital asset investment products for the first time in six weeks.
In this unpredictable macroeconomic landscape, let’s examine the charts to identify potential future movements.
Bitcoin price analysis
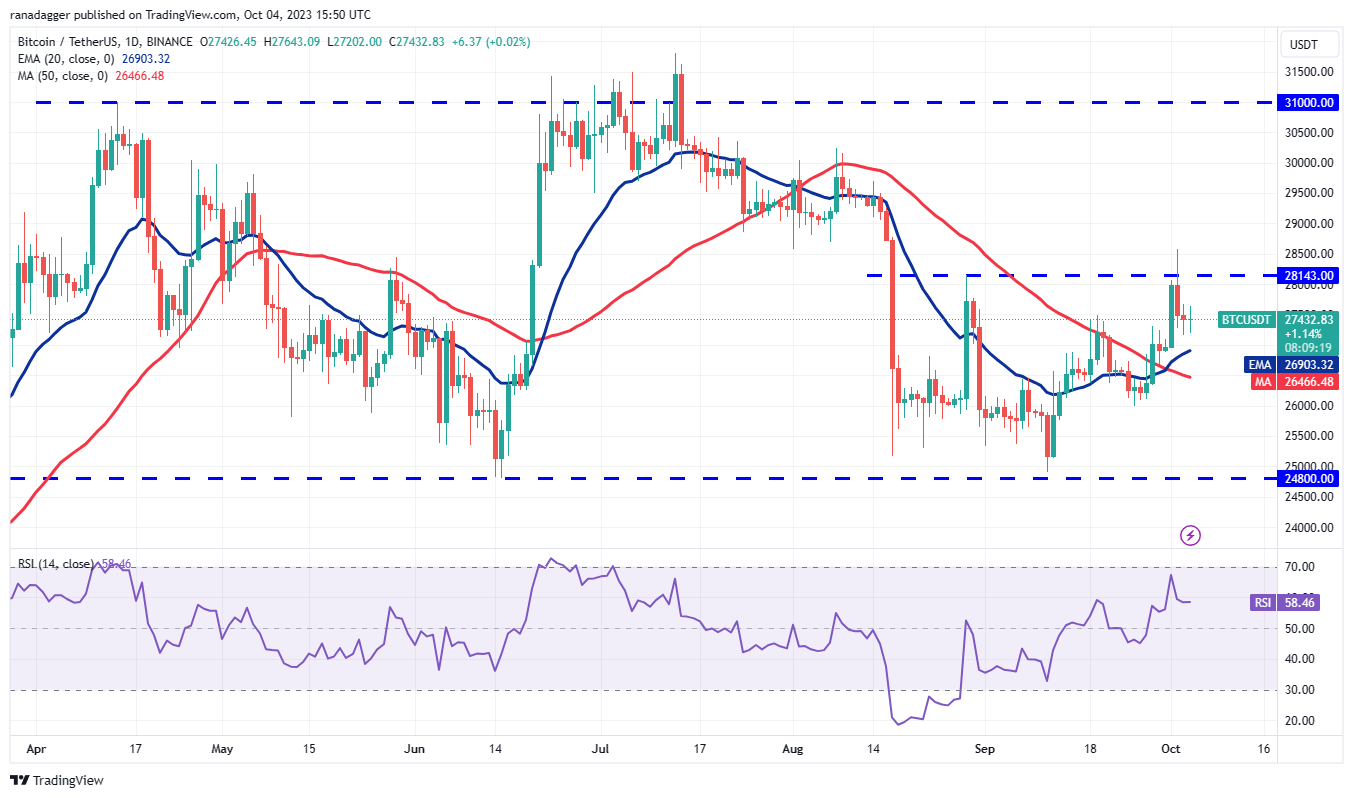
Bitcoin (BTC) climbed above $28,143 on October 2, but the long wick on the candlestick indicates that sellers are actively offloading at elevated levels. The bears attempted to capitalize on their position on October 3, yet the bulls maintained their support at $27,160.
 BTC/USDT daily chart. Source: TradingView
The upward-sloping 20-day exponential moving average ($26,903) and the relative strength index (RSI) remaining in positive territory suggest that the bulls are in control. Buyers will once again attempt to overcome the resistance at $28,143.
A close above this threshold would complete a short-term double bottom pattern, targeting an objective of $31,486.
This optimistic outlook will be negated if the price declines again from the resistance and falls below the 20-day EMA, which could pull the price down to $26,000. The BTC/USDT pair may then continue to consolidate within the range of $24,800 to $28,143 for a longer period.
Ether price analysis
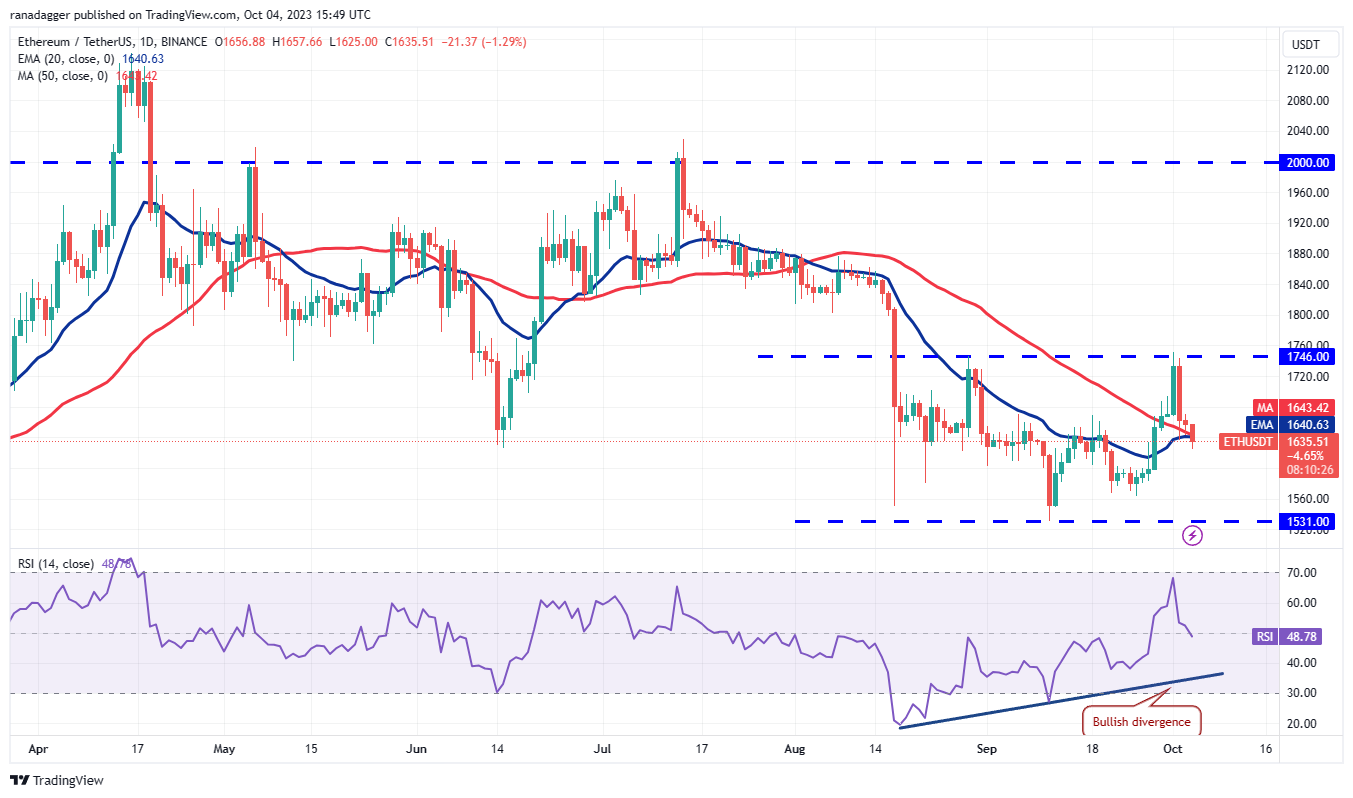
Ether (ETH) sharply retreated from the overhead resistance of $1,746 on October 2, indicating that sellers are vigorously defending this level.
 ETH/USDT daily chart. Source: TradingView
The 20-day EMA ($1,640) is leveling off, and the RSI is near the midpoint, suggesting a balance between supply and demand. If the price rebounds from the current level, the bulls will again attempt to breach the resistance at $1,746. If successful, the ETH/USDT pair will complete a double bottom pattern, targeting $1,961.
Conversely, if the price continues to decline and falls below the moving averages, it would indicate that the pair may remain within the range of $1,531 to $1,746 for an extended period.
BNB price analysis
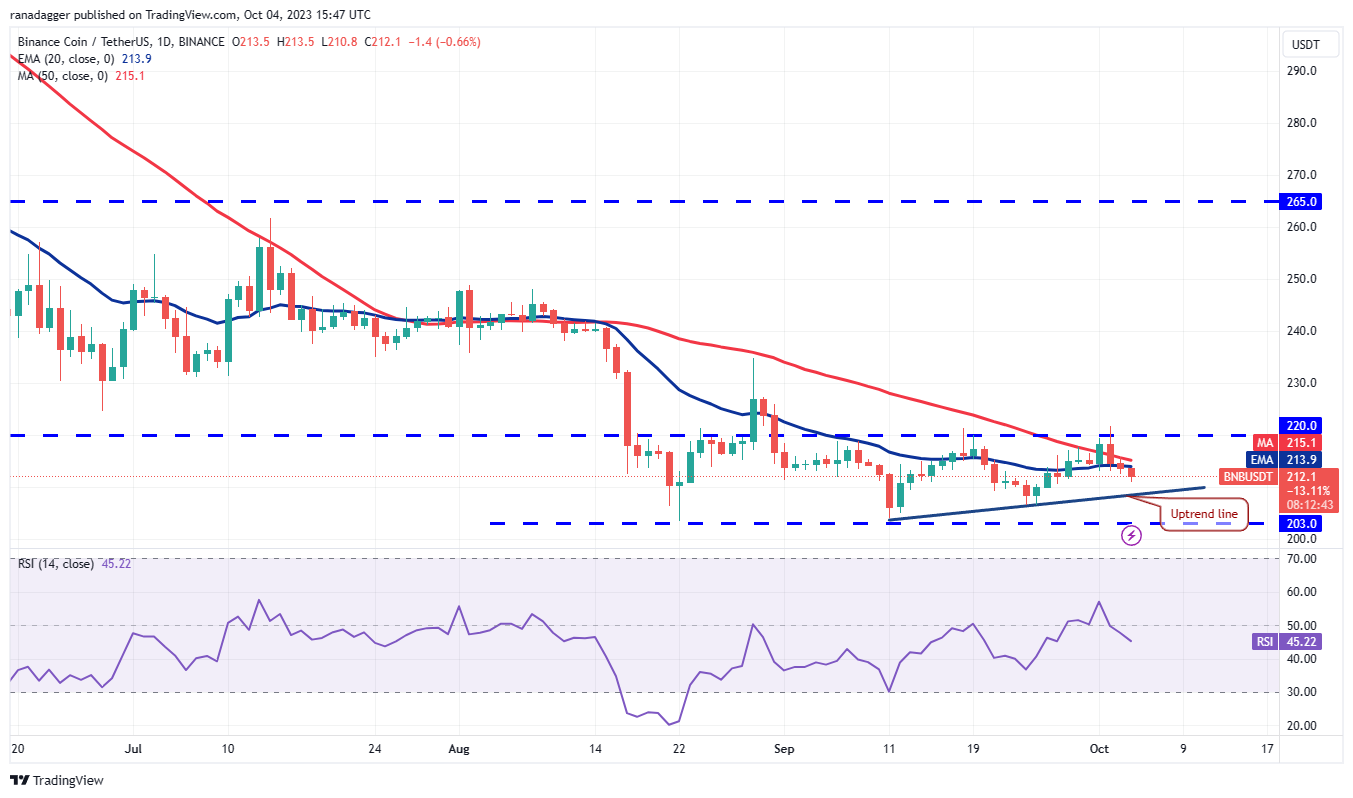
BNB (BNB) surged past the $220 resistance on October 2, but the bulls were unable to maintain the breakout, as evidenced by the long wick on the day’s candlestick.
 BNB/USDT daily chart. Source: TradingView
The inability of the bulls to keep the price above the 20-day EMA ($214) is a negative indicator, suggesting that traders are exiting positions. The BNB/USDT pair may next decline to the uptrend line.
If the price rebounds from this level, the bulls will again attempt to push the pair above $220. A close above this resistance could indicate the beginning of an upward movement to $235 and subsequently to $250. Conversely, if the price breaks below the uptrend line, the pair may fall to the significant support level at $203.
XRP price analysis
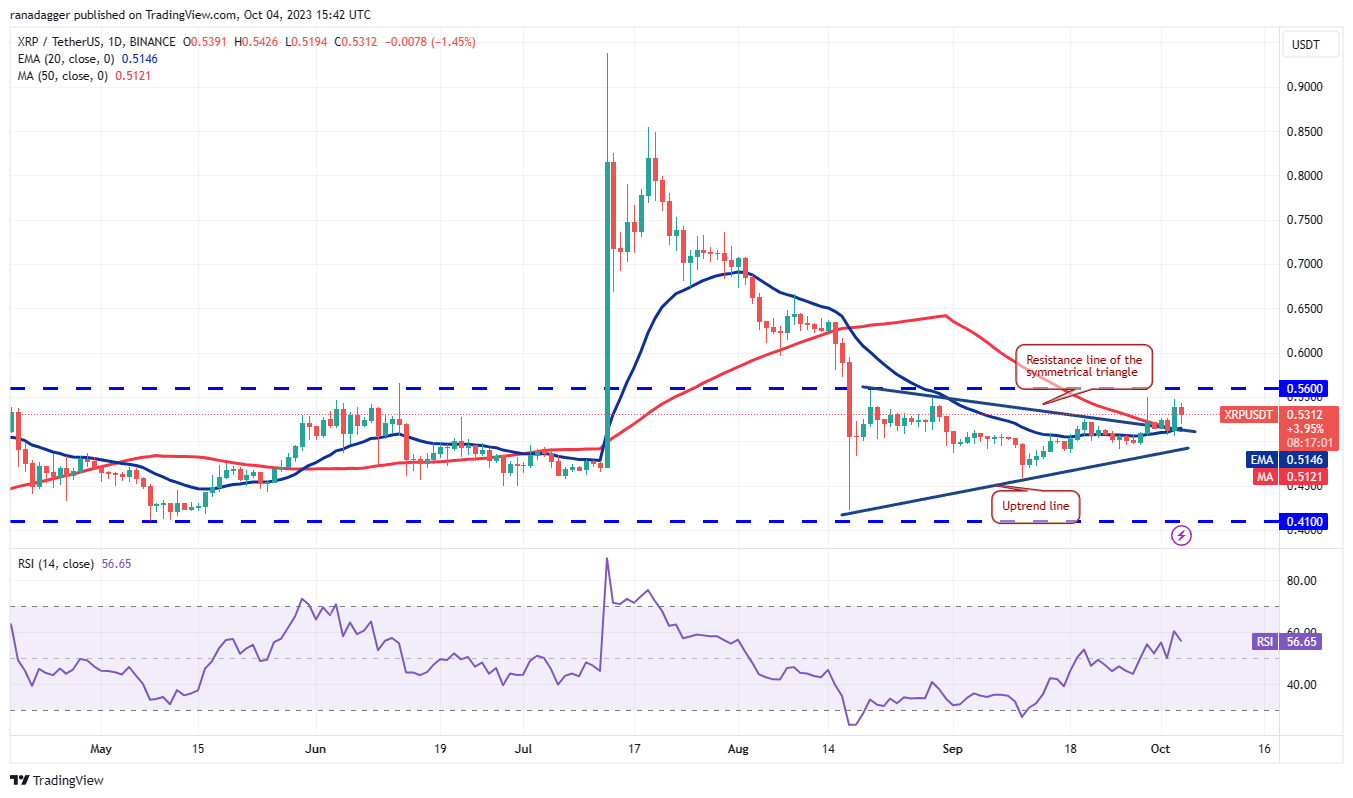
Buyers drove XRP (XRP) above the symmetrical triangle pattern on September 29 and successfully thwarted multiple attempts by the bears to pull the price back into the triangle.
 XRP/USDT daily chart. Source: TradingView
The bulls will next aim to overcome the overhead resistance at $0.56. If they succeed, it will signal the onset of a new uptrend. The XRP/USDT pair could then begin its ascent toward the pattern target of $0.66.
On the other hand, if the price retreats from $0.56 and falls below the uptrend line, it would suggest that the bulls are taking profits. This could keep the pair range-bound between $0.56 and $0.41 for several more days.
Solana price analysis
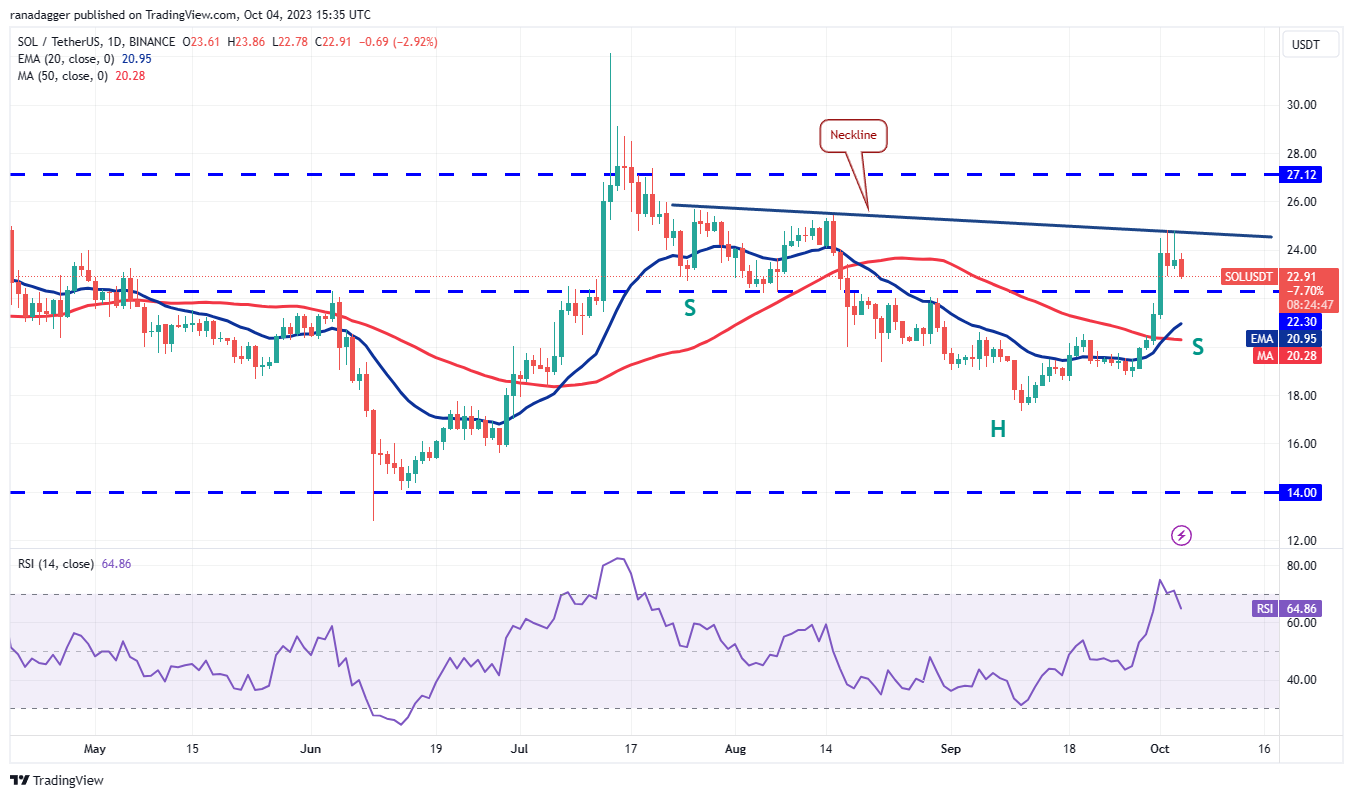
Solana (SOL) has been fluctuating within a broad range between $14 and $27.12. Recent price movements have led to the formation of a potential inverse head and shoulders pattern.
 SOL/USDT daily chart. Source: TradingView
Related Posts
While patterns formed within a range tend to be less reliable, they should not be overlooked. If the price rises and breaks above the neckline, the SOL/USDT pair could attempt a rally to $27.12 and ultimately to the pattern target of $32.81.
The key support to monitor on the downside is the 20-day EMA ($20.95). If the price falls below this level, it would indicate that the bulls have surrendered. This could pave the way for a potential drop to $17.33.
Cardano price analysis
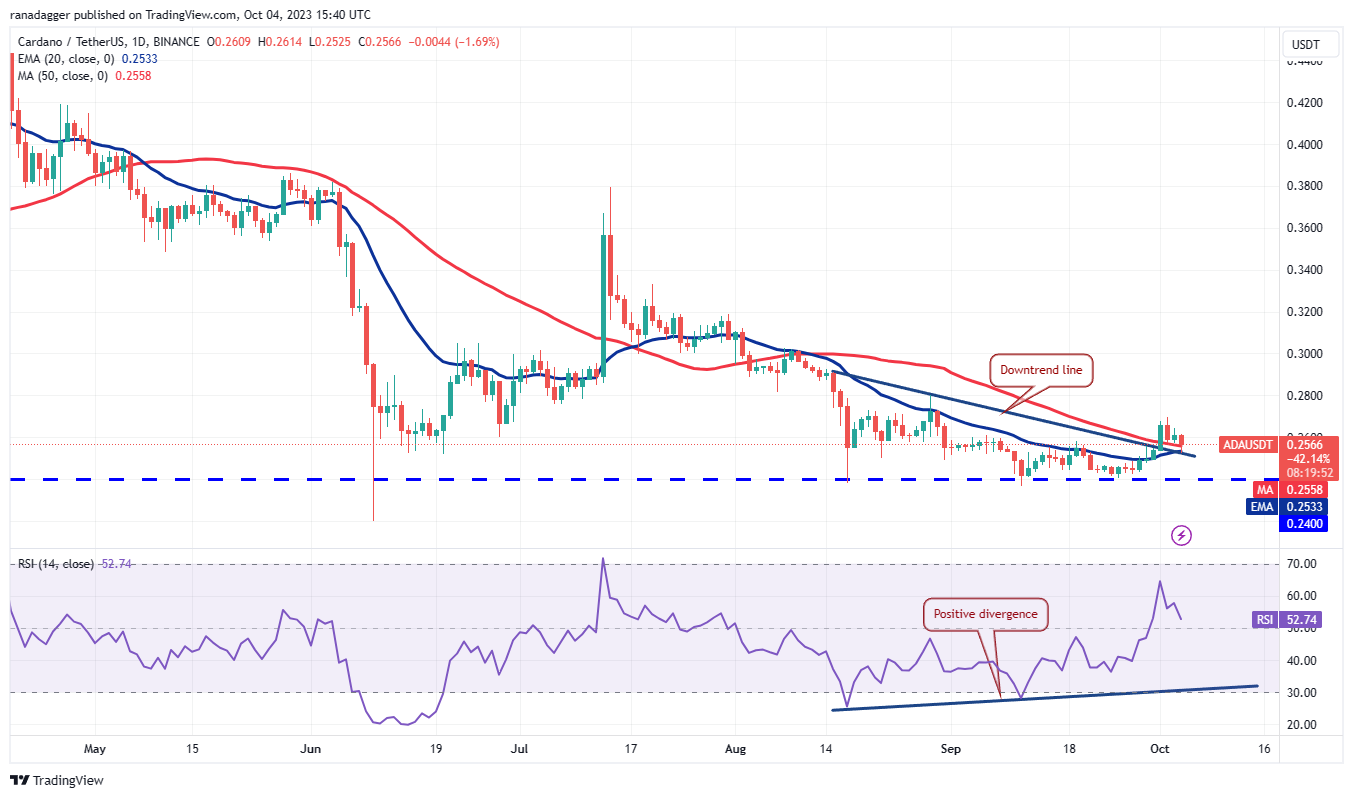
Cardano (ADA) declined from $0.27 on October 2 and reached the 20-day EMA ($0.25) on October 4. This is a crucial level to observe in the near term.
 ADA/USDT daily chart. Source: TradingView
If the price rebounds from the 20-day EMA, it will indicate a shift in sentiment from selling on rallies to buying on dips. The bulls will then attempt to push the price above $0.27 and initiate an upward movement to $0.29 and eventually to $0.32.
If the bears aim to thwart the rally, they will need to pull the price below the 20-day EMA. The ADA/USDT pair may then once again drop to the critical support at $0.24, which the bulls are likely to defend vigorously.
Dogecoin price analysis
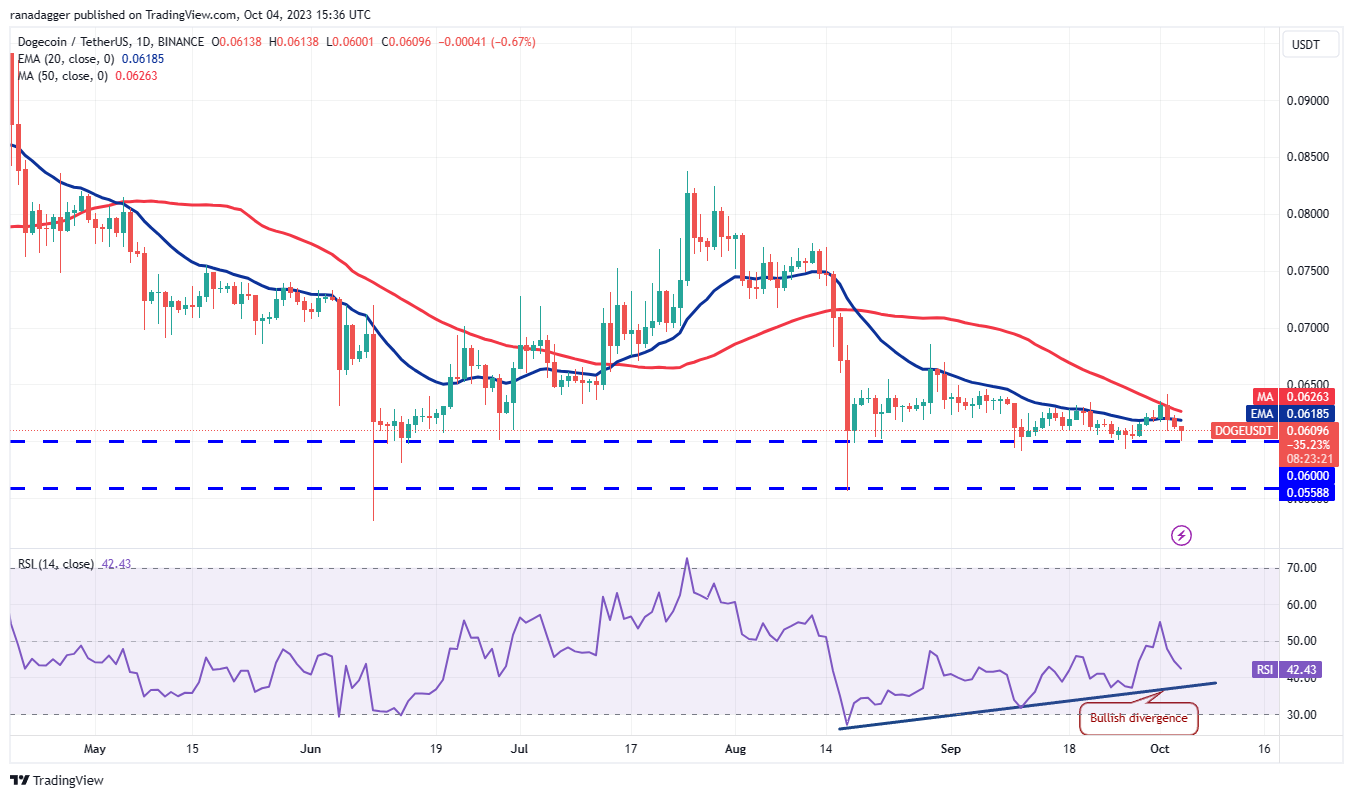
The bulls managed to push Dogecoin (DOGE) above the 50-day SMA ($0.06) on October 2, but could not maintain the higher levels. This indicates that bears are selling during every minor relief rally.
 DOGE/USDT daily chart. Source: TradingView
The DOGE/USDT pair has reached significant support at $0.06. Frequent retesting of a support level within a short timeframe tends to weaken it. If the $0.06 level fails, the pair may decline to the next major support at $0.055.
A slight advantage for buyers is that the RSI has formed a bullish divergence, indicating that bears may be losing their hold. The indicators do not provide clear guidance on the next move. Therefore, it is advisable to wait for the price to close above the 50-day SMA or drop below $0.06 to make directional trades.
Related: Bitcoin traders hope $27K holds as BTC price ignores volatile US dollar
Toncoin price analysis
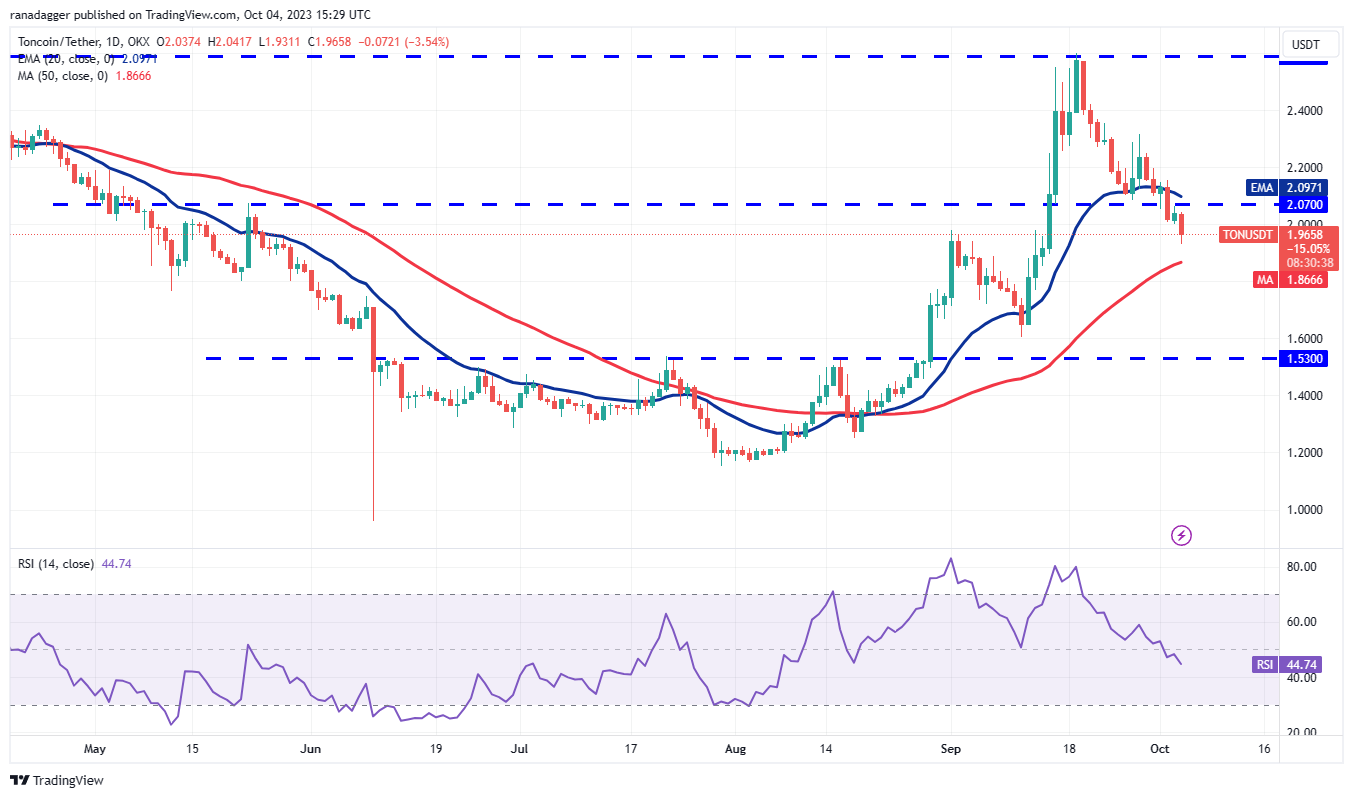
Toncoin (TON) fell below the 20-day EMA ($2.09) on September 30, and the bears thwarted attempts by the bulls to reclaim this level on October 1.
 TON/USDT daily chart. Source: TradingView
The bears are attempting to strengthen their position by driving the price down to the 50-day SMA ($1.86). This level may lead to a rebound, likely facing selling pressure at the 20-day EMA.
If the price declines from this resistance, it would indicate that sentiment has turned bearish and traders are selling on rallies. This would increase the likelihood of a drop below the 50-day SMA.
Conversely, if the price rises and breaks above the 20-day EMA, it would suggest that the markets have rejected lower levels. The TON/USDT pair could then climb to $2.32, where bears will again attempt to halt the upward movement.
Polkadot price analysis
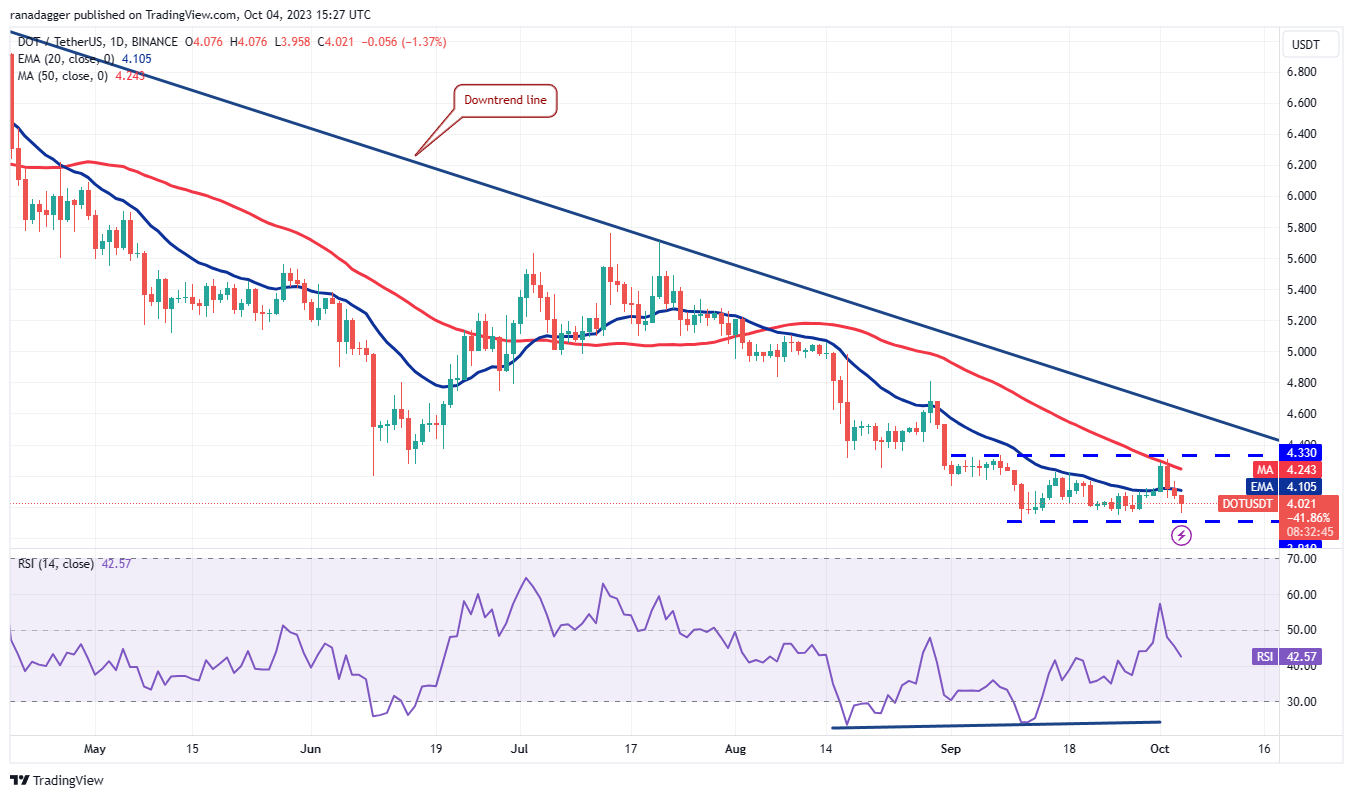
Polkadot (DOT) sharply declined from the 50-day SMA ($4.24) on October 2 and fell below the 20-day EMA ($4.10) on October 3.
 DOT/USDT daily chart. Source: TradingView
The bears tested the crucial support at $3.91 on October 4, but the long tail on the candlestick indicates strong buying at lower levels. The RSI has formed a bullish divergence, suggesting that sellers may be losing their grip.
If the bulls manage to push the price above the 20-day EMA, it would indicate that the DOT/USDT pair may remain within the range of $4.33 to $3.91 for a longer duration. The bears would need to drive the price below $3.91 to initiate the next phase of the downtrend to $3.50.
Polygon price analysis
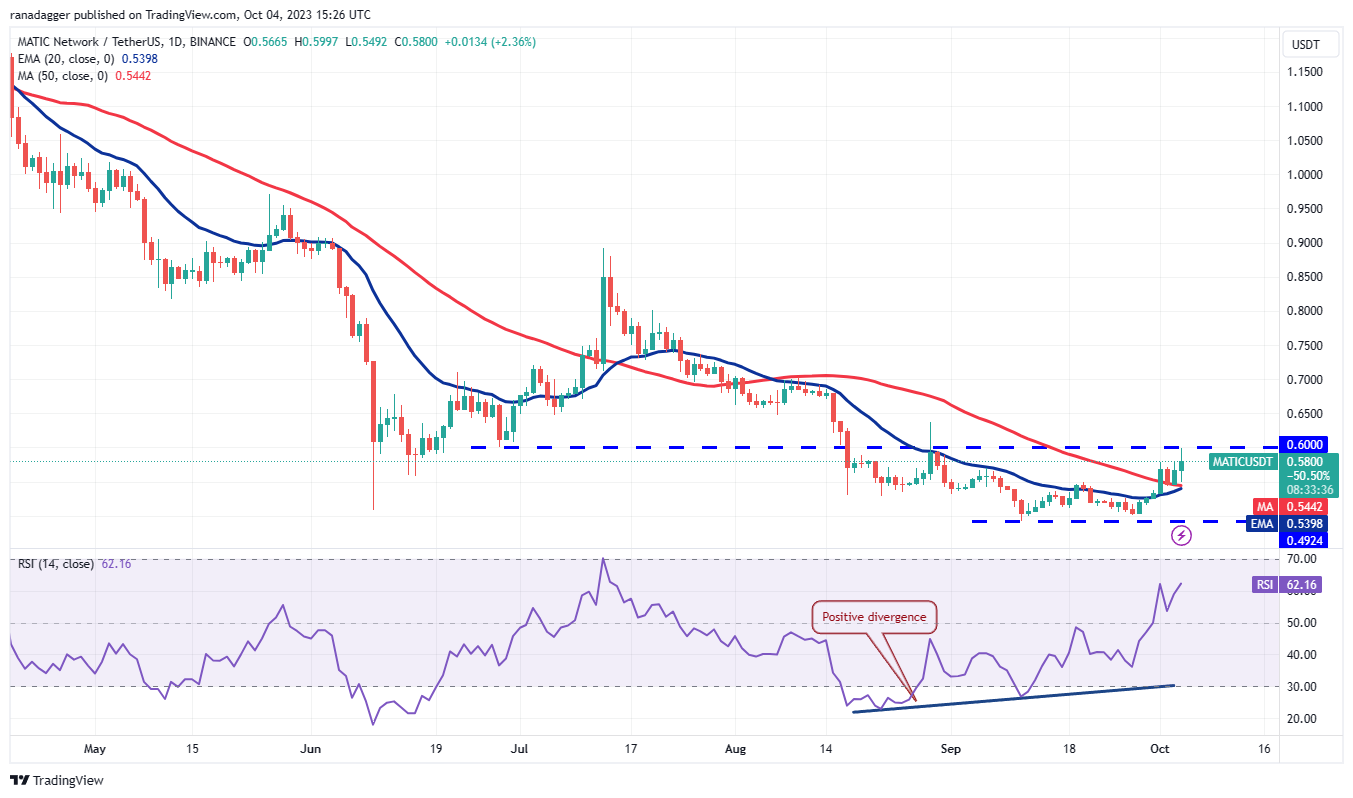
After experiencing a fierce contest between bulls and bears near the moving averages, Polygon (MATIC) rebounded on October 4, signaling that buyers are attempting to take control.
 MATIC/USDT daily chart. Source: TradingView
The bulls are striving to build on this momentum and push the price above the overhead resistance at $0.60. If they succeed, it will indicate the beginning of a sustained recovery. The MATIC/USDT pair could then rise to $0.70.
In contrast, if the price declines and breaks below the 20-day EMA, it would suggest that bears are active at higher levels. The pair may then retest the critical support at $0.49, which is likely to attract significant buying from the bulls.
This article does not contain investment advice or recommendations. Every investment and trading move involves risk, and readers should conduct their own research when making a decision.