Disclaimer: Information found on CryptoreNews is those of writers quoted. It does not represent the opinions of CryptoreNews on whether to sell, buy or hold any investments. You are advised to conduct your own research before making any investment decisions. Use provided information at your own risk.
CryptoreNews covers fintech, blockchain and Bitcoin bringing you the latest crypto news and analyses on the future of money.


The bulls attempted to rouse Bitcoin from its slumber on Sept. 7, but the rally proved short-lived. This indicates a lack of consensus between bulls and bears regarding Bitcoin’s (BTC) next directional move. Analyst CryptoCon stated on X (formerly Twitter) that Bitcoin could remain in a “mid-cycle lull” until the start of the next bull run in November 2024.
In a similar vein, ARK Invest noted in a report that cryptocurrencies may continue to face headwinds for the remainder of 2023 due to several macroeconomic factors, including interest rates, gross domestic product estimates, unemployment, and inflation.
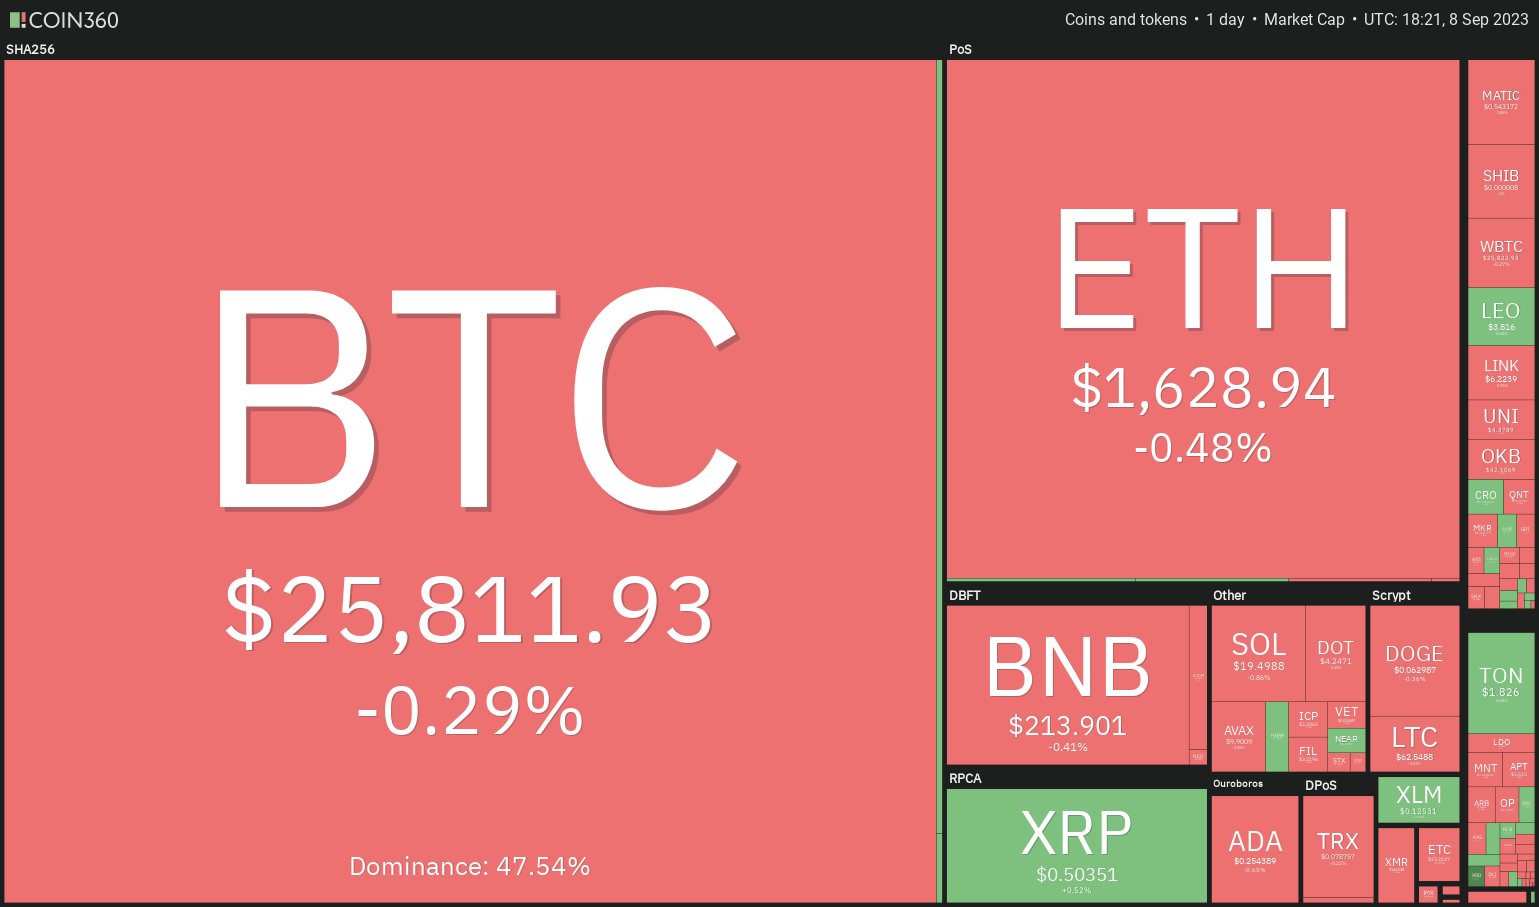
Daily cryptocurrency market performance. Source: Coin360
On Sept. 8, the bulls will closely monitor the United States Securities and Exchange Commission’s decision on various Bitcoin spot exchange-traded fund (ETF) applications. Additionally, the race for a spot Ether (ETH) ETF officially began on Sept. 6 with filings from VanEck and ARK Invest. Bloomberg ETF analyst James Seyffart anticipates more Ether ETF filings in the coming days.
Could Bitcoin’s range-bound action increase selling pressure on altcoins? Let’s examine the charts of the top 10 cryptocurrencies to find out.
Bitcoin price analysis
Bitcoin reached the 20-day exponential moving average (EMA) of $26,419 on Sept. 7, but the bulls failed to overcome this obstacle. This suggests that bears are fiercely defending the 20-day EMA.
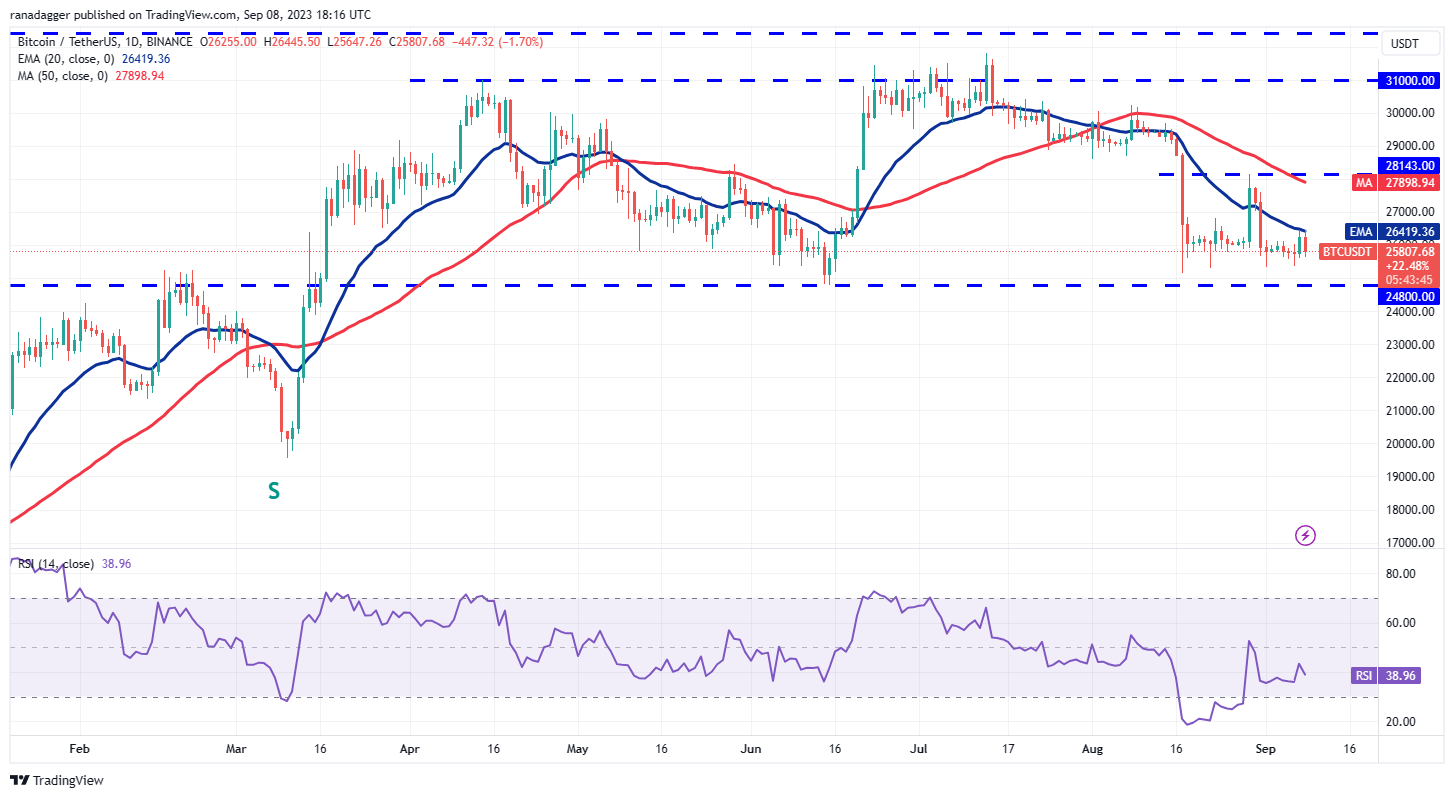
BTC/USDT daily chart. Source: TradingView
However, the bears’ failure to challenge crucial support at $24,800 suggests that selling pressure dries up at lower levels. The relative strength index (RSI) is attempting to form a positive divergence, indicating that bearish momentum is weakening.
The first sign of strength will be a break and close above the 20-day EMA. This would clear the path for a sustained recovery toward $28,143.
Conversely, if the $24,800 support breaks, the BTC/USDT pair could initiate a downtrend. While there is minor support at $24,000, it may not halt the decline. The pair could eventually reach pivotal support at $20,000.
Ether price analysis
Ether continues to trade within a narrow range between the 20-day EMA ($1,668) and formidable support at $1,626.
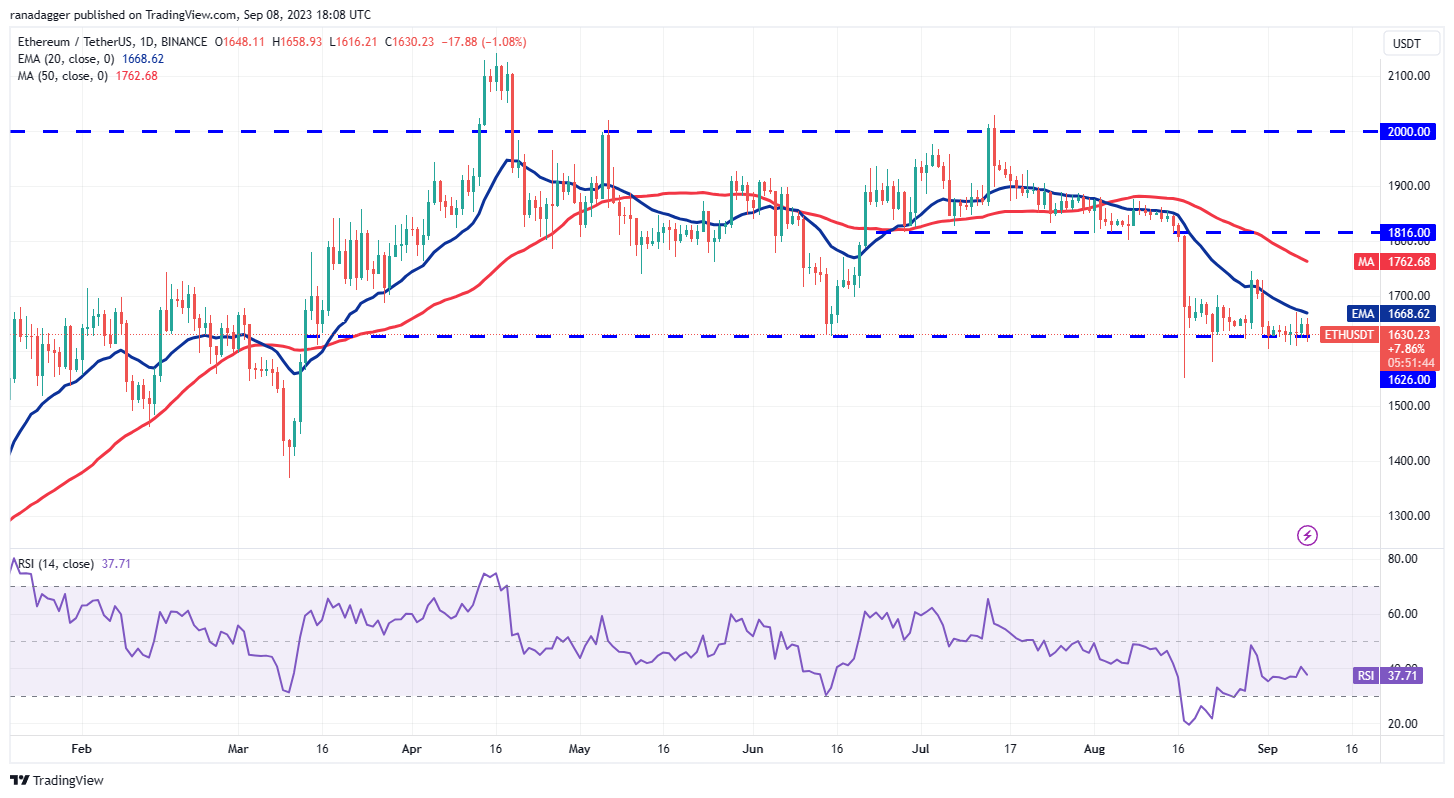
ETH/USDT daily chart. Source: TradingView
The bulls’ failure to clear the overhead hurdle at the 20-day EMA increases the risk of a breakdown. Below $1,626, the ETH/USDT pair could retest the Aug. 17 intraday low of $1,550. Buyers may aggressively purchase the dip to this level because if the support cracks, the pair could plunge to $1,368.
Time is running out for the bulls. To prevent a collapse, they must first drive the price above the 20-day EMA and then attempt a rally to the 50-day simple moving average (SMA) of $1,762. This could increase the likelihood of the pair remaining range-bound between $2,000 and $1,626 for several more days.
BNB price analysis
The bulls attempted to push BNB (BNB) above the breakdown level of $220 on Sept. 6, but the bears did not relent. This indicates that sellers are trying to flip the $220 level into resistance.
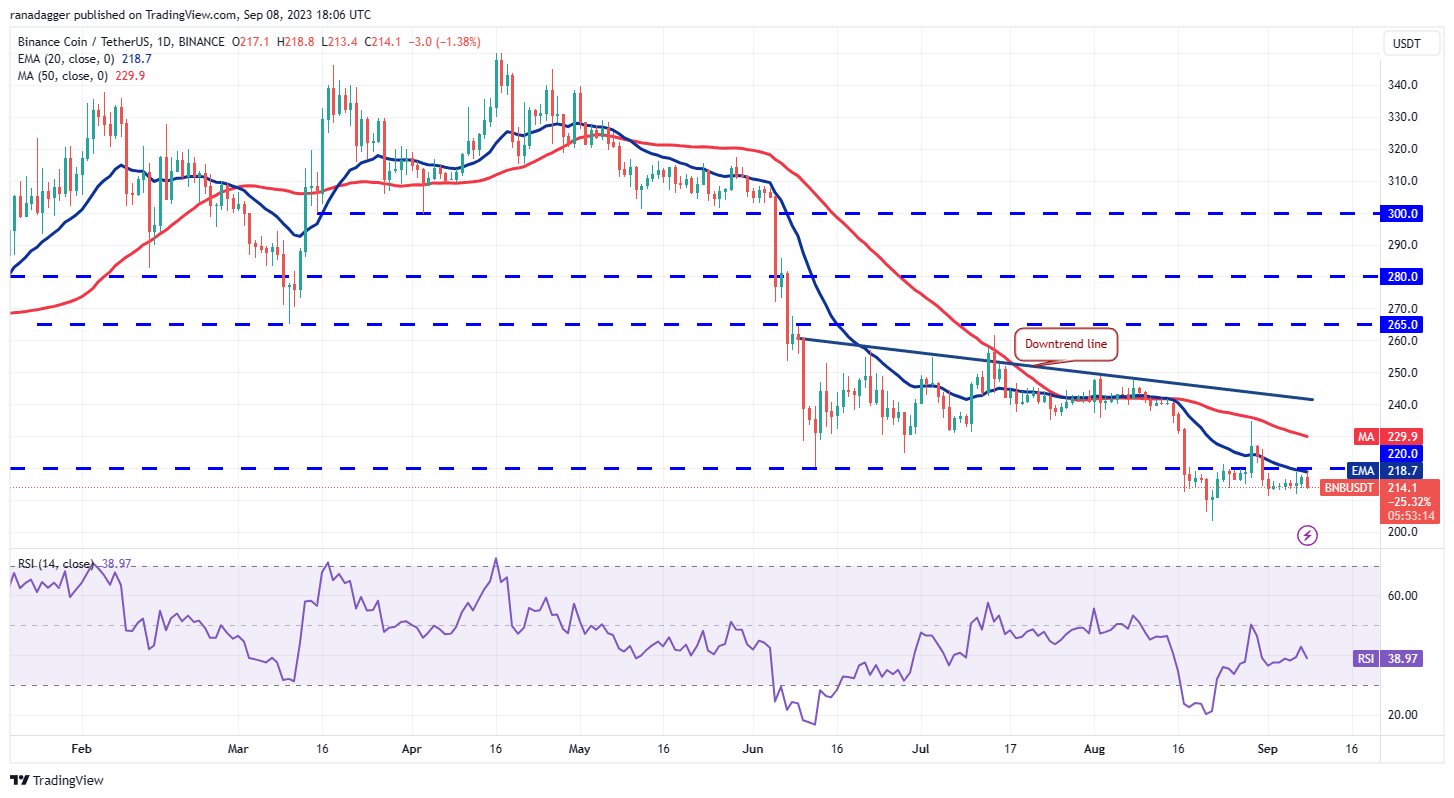
BNB/USDT daily chart. Source: TradingView
There is minor support at $211, but if bears pull the price below it, the BNB/USDT pair could reach the psychological level of $200. This level is likely to attract solid buying from bulls. If the price rebounds off this support, it will indicate that the pair may consolidate between $200 and $220 for a while.
Contrary to this scenario, if the price turns up from the current level and rises above $220, it will suggest accumulation at lower levels. This could launch a recovery toward the downtrend line.
XRP price analysis
The bulls purchased XRP’s (XRP) dip below $0.50 on Sept. 6, but the failure to initiate a strong rebound indicates a lack of demand at higher levels.
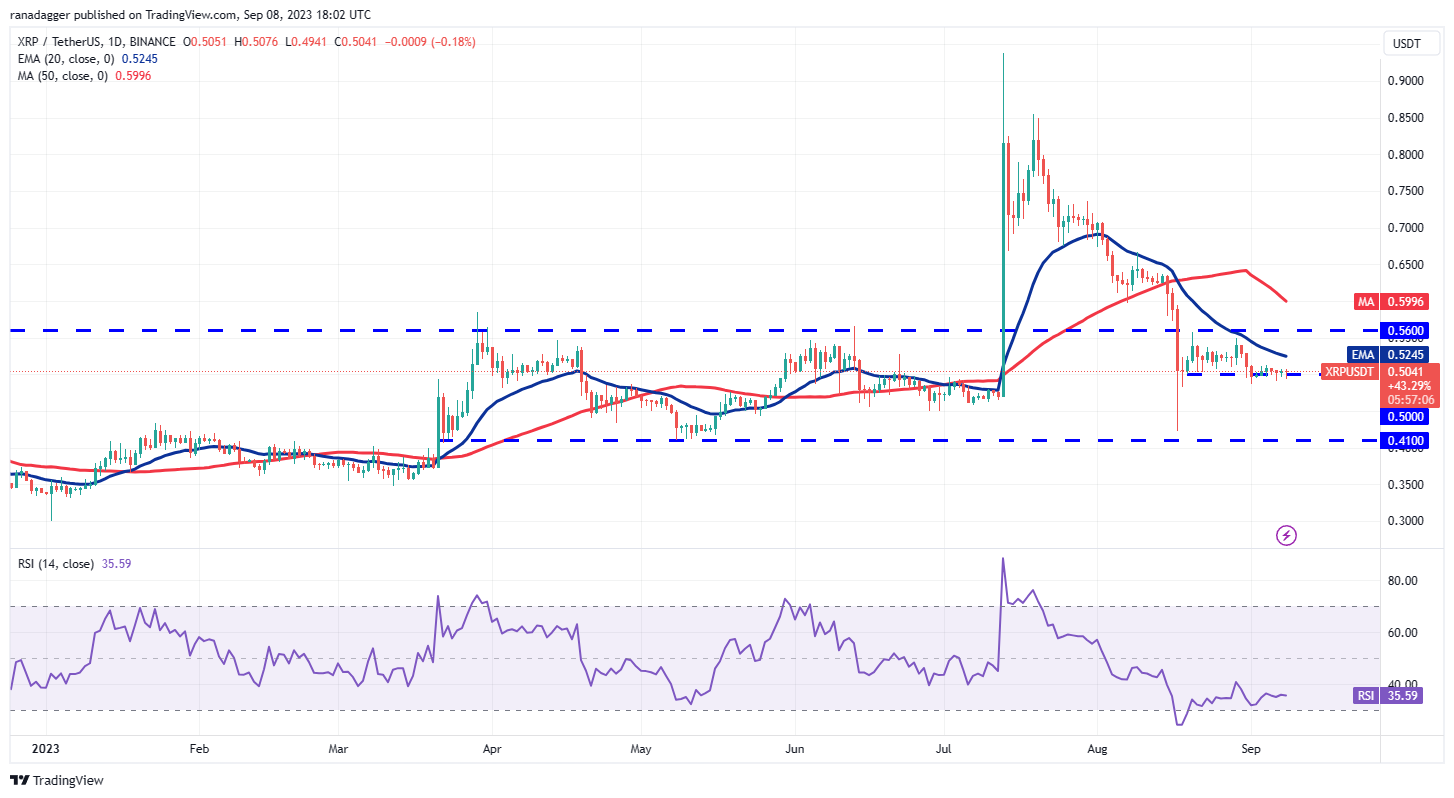
XRP/USDT daily chart. Source: TradingView
Bears will try to strengthen their position by pulling the price below $0.50. If they succeed, the XRP/USDT pair could nosedive to the next major support at $0.41. This fall is likely to be swift, as there is no major support between $0.50 and $0.41.
On the contrary, if the price turns up from the current level, it will suggest that bulls are attempting to flip $0.50 into support. A break above the 20-day EMA will indicate that the pair is likely to oscillate between $0.50 and $0.56 for a while longer.
Cardano price analysis
Cardano (ADA) formed a Doji candlestick pattern on Sept. 6 and again on Sept. 7, showing indecision between bulls and bears.
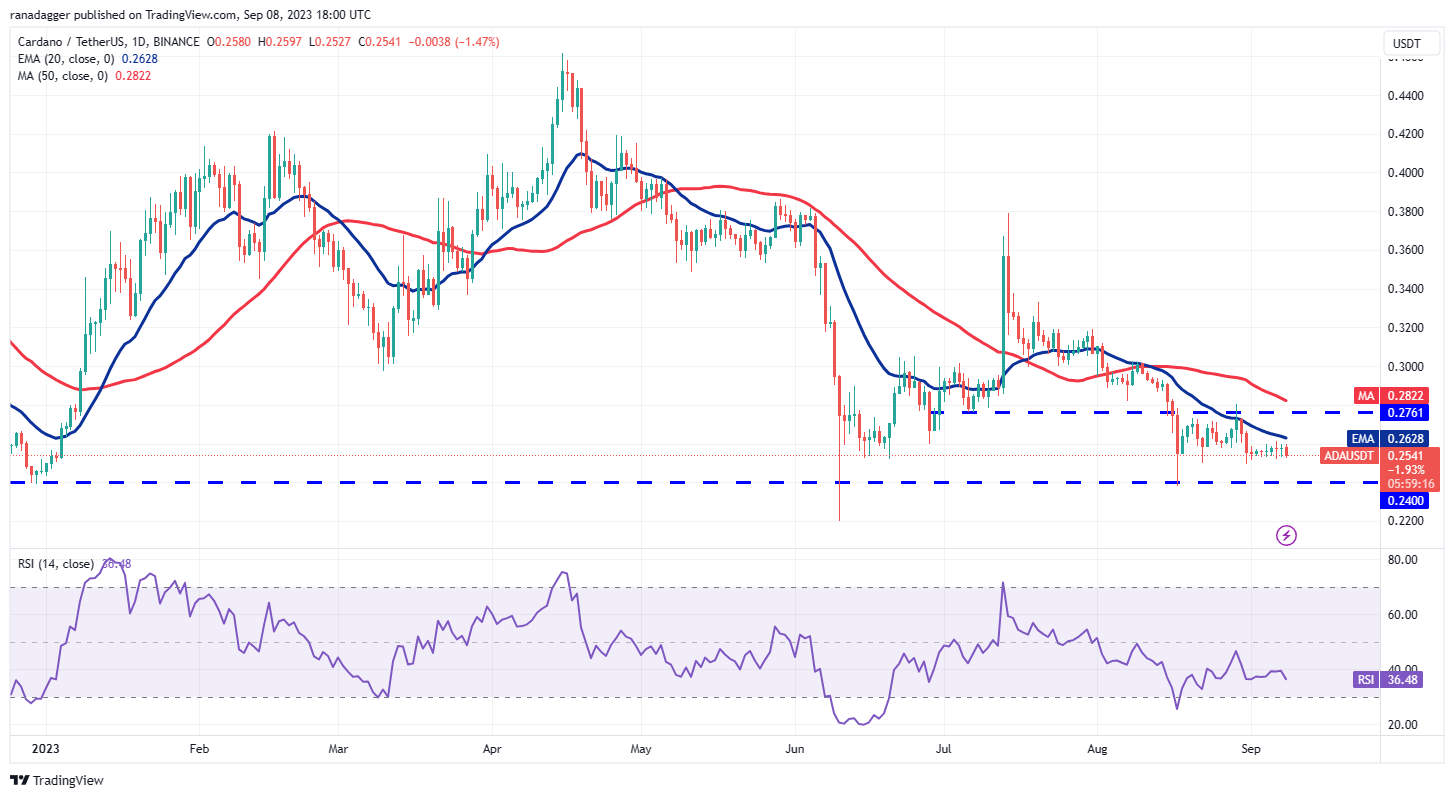
ADA/USDT daily chart. Source: TradingView
Related Posts
The downsloping 20-day EMA ($0.26) and the RSI in negative territory enhance the prospects of a downside breakdown. If the price skids below $0.25, the ADA/USDT pair could drop to critical support at $0.24.
On the upside, bears have repeatedly halted advances near the 20-day EMA, making it an important level to watch. If bulls force the price above the 20-day EMA, the pair could reach the overhead resistance at $0.28.
Dogecoin price analysis
The bulls attempted to push Dogecoin (DOGE) above the 20-day EMA ($0.06) on Sept. 6, but the bears held their ground.
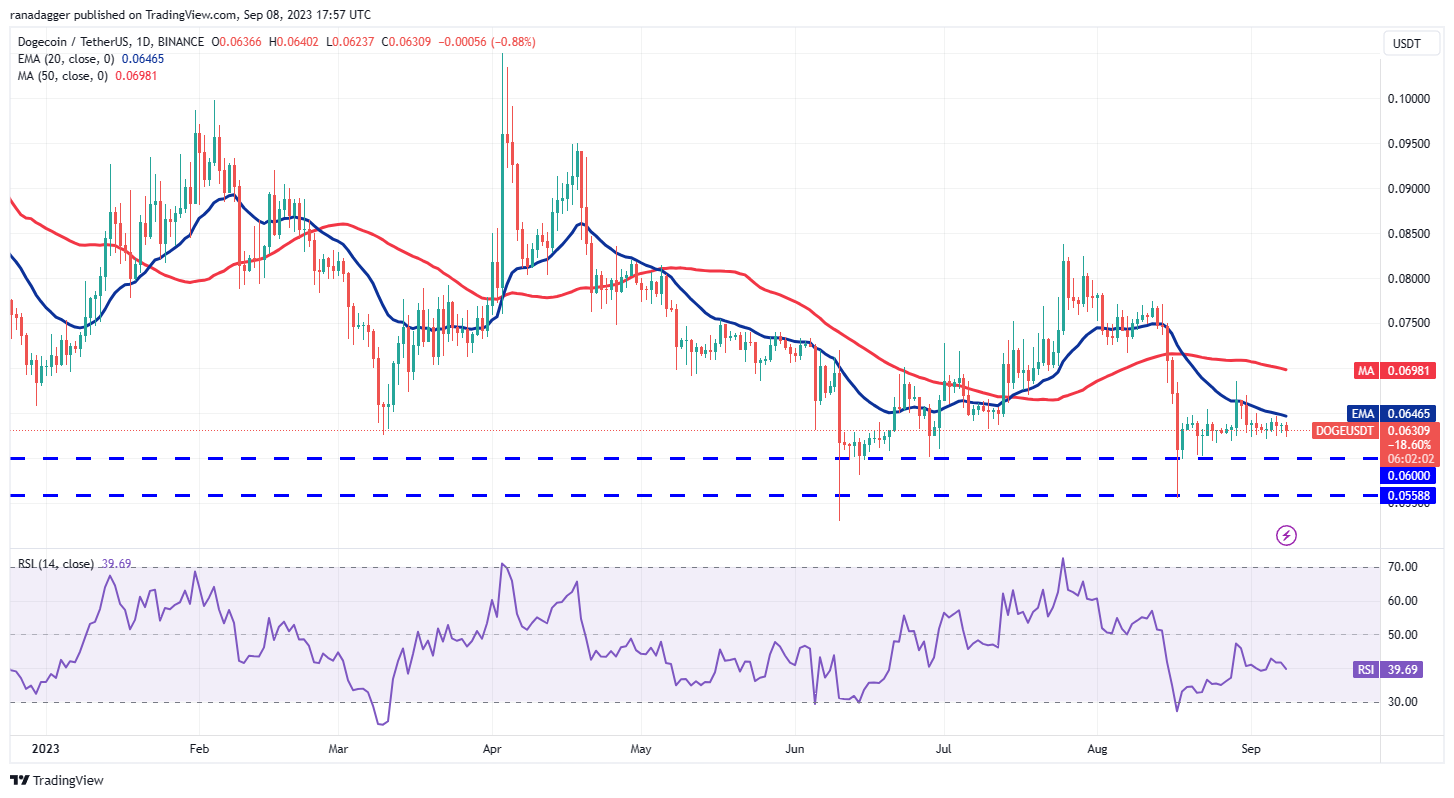
DOGE/USDT daily chart. Source: TradingView
The price remains stuck between the 20-day EMA and horizontal support at $0.06. When the price trades inside a range, predicting the breakout direction is difficult, but the downsloping 20-day EMA and the RSI near 40 signal an edge to the bears. Below $0.06, the DOGE/USDT pair could descend to $0.055.
This negative view will be invalidated in the near term if bulls kick and sustain the price above the 20-day EMA. Such a move will suggest the start of a stronger recovery to $0.07 and eventually to $0.08.
Solana price analysis
Solana (SOL) has been gradually correcting inside the large range between $14 and $27.12. Bears have been selling relief rallies to the 20-day EMA ($20.53), indicating that sentiment remains negative.
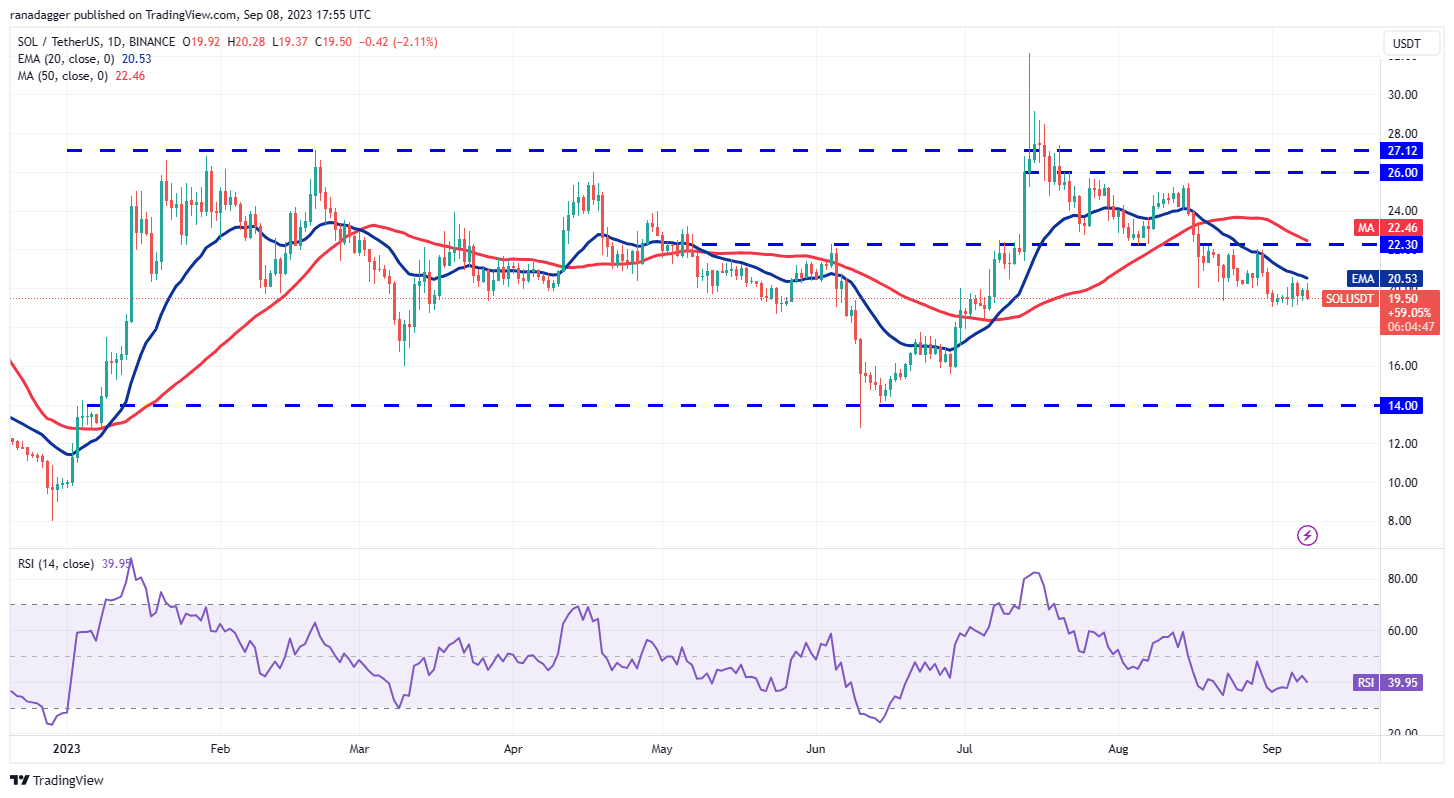
SOL/USDT daily chart. Source: TradingView
The repeated failure of bulls to thrust the price above the 20-day EMA suggests that the path of least resistance is to the downside. If bears tug the price below immediate support at $19, the SOL/USDT pair could slump to $18 and subsequently to $16.
The bulls likely have other plans. They will try to push the price above the 20-day EMA. If they succeed, the pair may reach overhead resistance at $22.30. This is an important level for bears to defend because a break above it could clear the path for a potential rally to $26.
Related: Why is Bitcoin price down today?
Toncoin price analysis
Toncoin (TON) attempted a rebound on Sept. 6, but the long wick on the Sept. 7 candlestick shows that bears continue to sell on rallies.
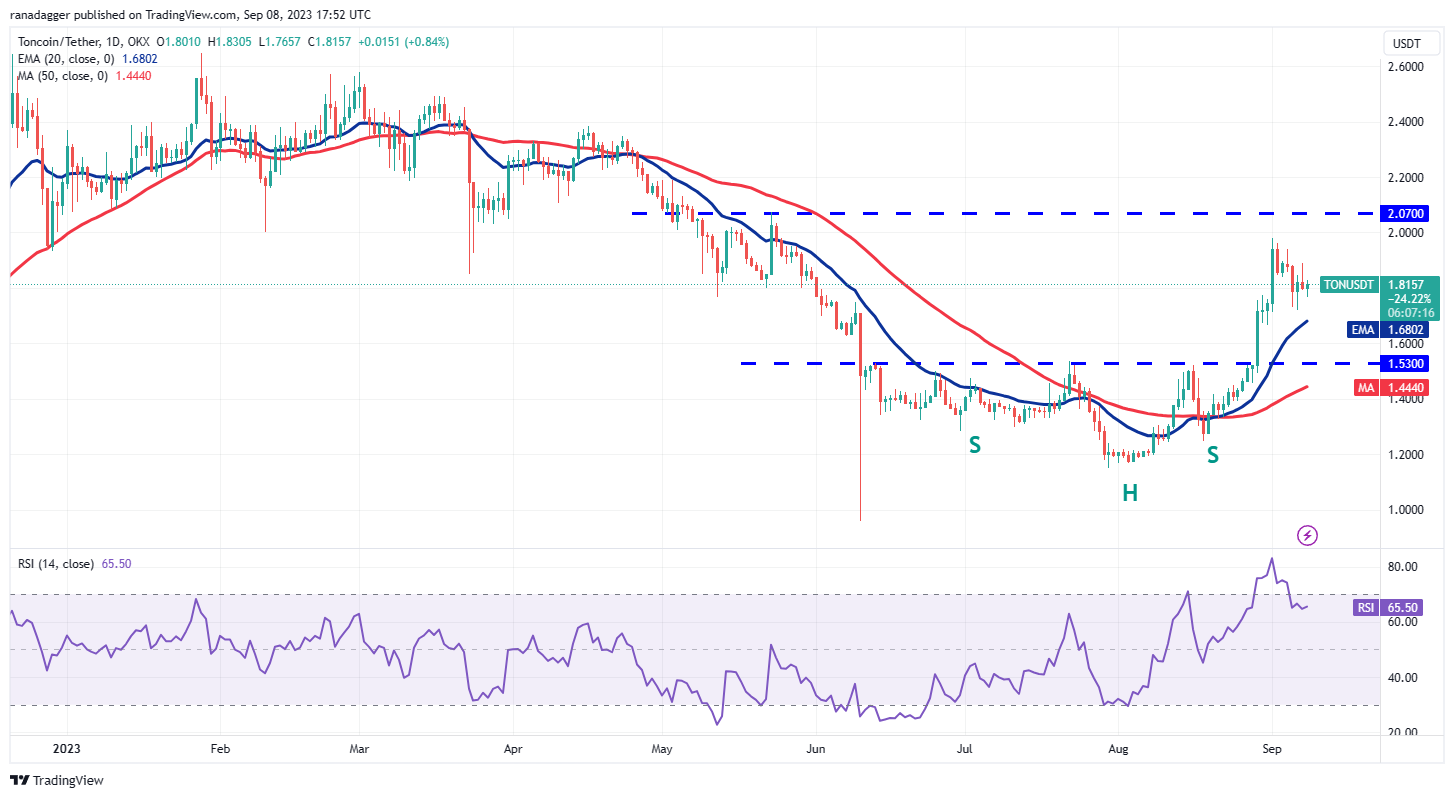
TON/USDT daily chart. Source: TradingView
The 20-day EMA ($1.68) remains the key level to watch in the short term. If the price rebounds off the 20-day EMA, bulls will again attempt to drive the TON/USDT pair above overhead resistance at $2.07.
Conversely, if the price slips below the 20-day EMA, it will suggest that traders are aggressively booking profits. The first stop on the downside is at the breakout level of $1.53, followed by the 50-day SMA ($1.44).
Polkadot price analysis
Bears pulled Polkadot (DOT) below strong support at $4.22 on Sept. 6, but they could not sustain the lower levels, as seen from the long tail on the candlestick. This indicates buying at lower levels.
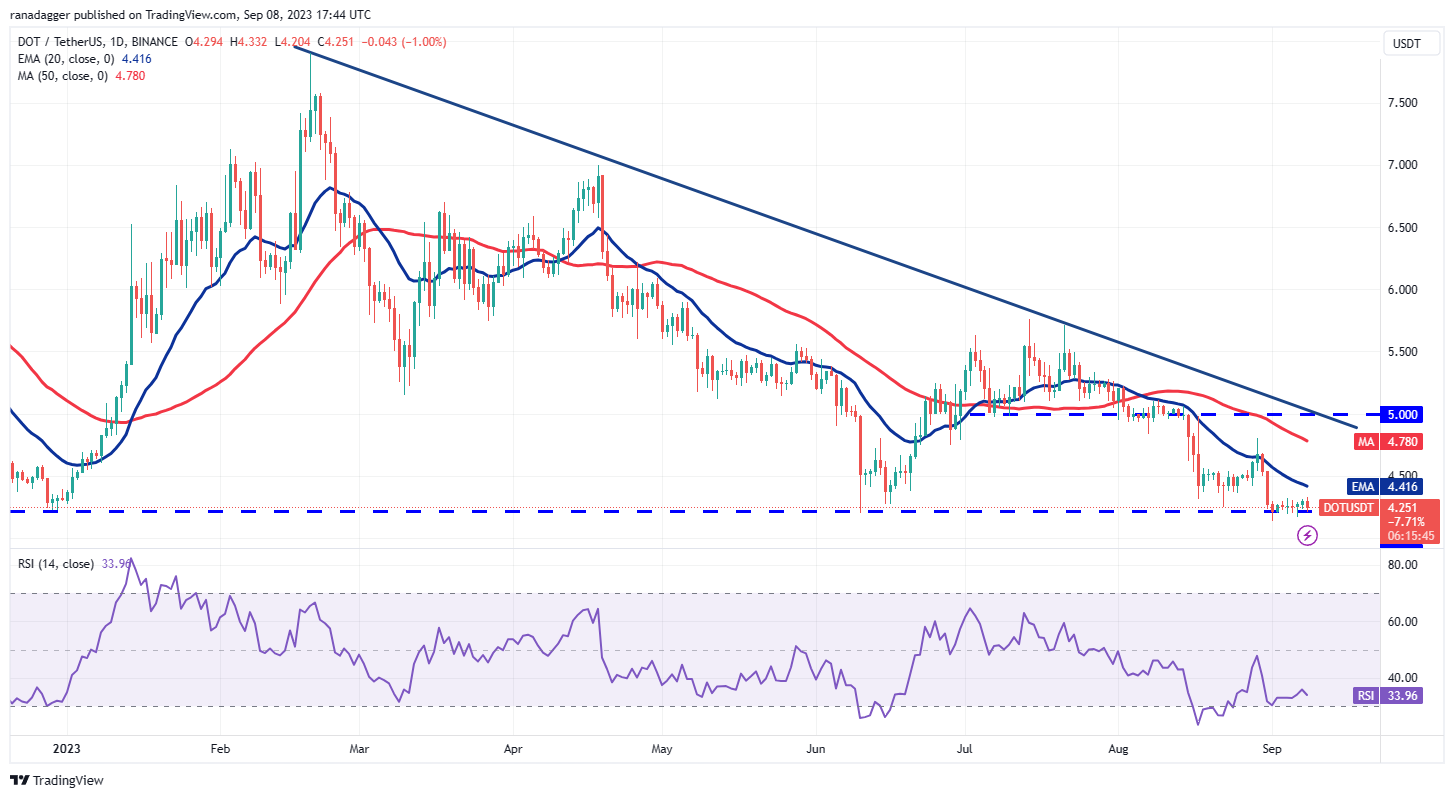
DOT/USDT daily chart. Source: TradingView
However, bulls could not maintain the momentum to push the price to the 20-day EMA ($4.41). This shows that every minor rally is being sold into. Bears have pulled the price back to important support at $4.22. If this support crumbles, the DOT/USDT pair could fall to the psychological support at $4.
If bulls want to make a comeback, they must propel the price above the 20-day EMA. If they do, the pair is likely to climb to the downtrend line. This is the key level to watch because a break above it could signal that the downtrend is ending.
Polygon price analysis
Buyers attempted to propel Polygon (MATIC) above the 20-day EMA ($0.56) for the past three days, but the bears held their ground. This suggests that traders are selling on minor rallies.
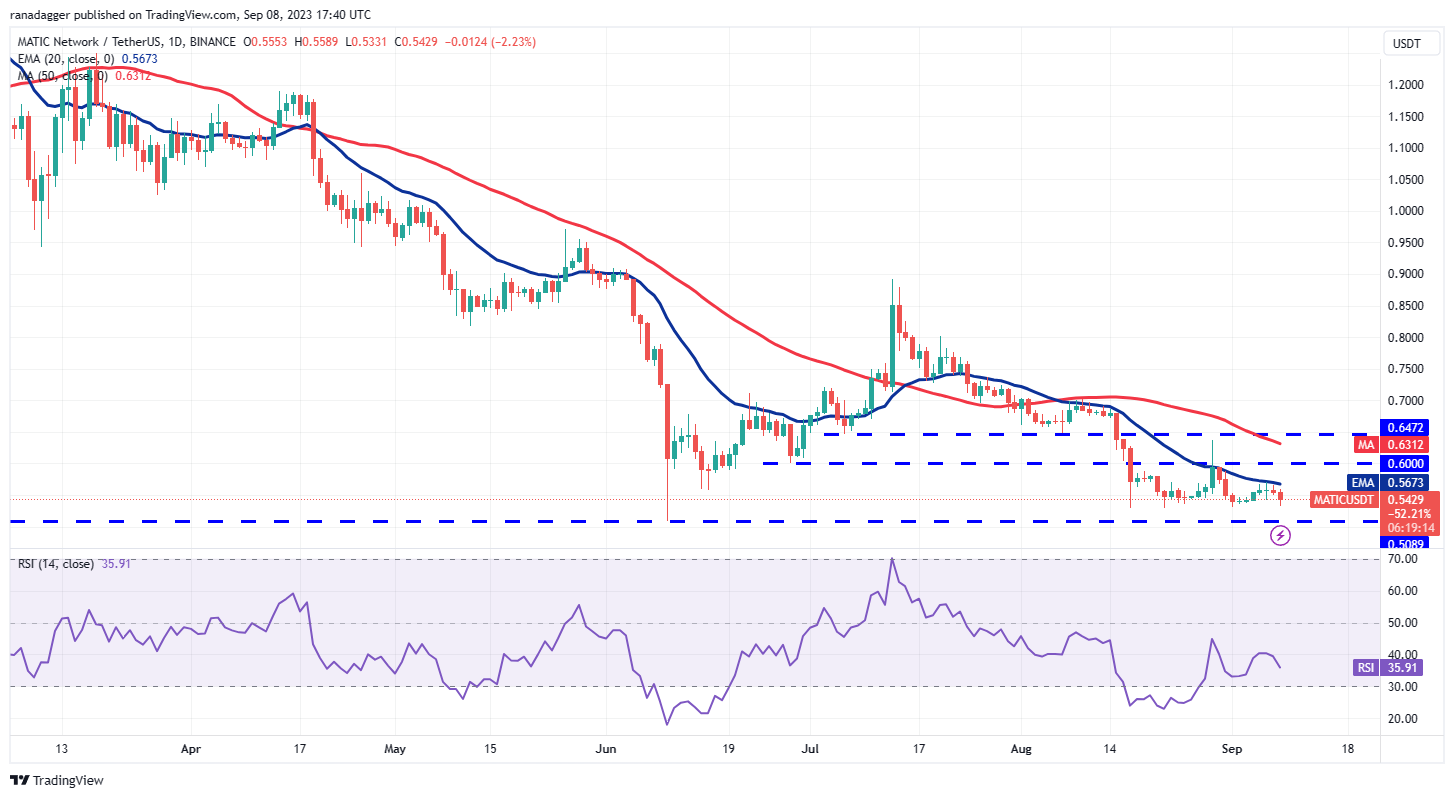
MATIC/USDT daily chart. Source: TradingView
Bears will try to pull the price below immediate support at $0.53. If they manage to do so, the MATIC/USDT pair could plummet to vital support at $0.50. Bulls are expected to protect this level vigorously because a break below it may open the gates for a further fall to $0.45.
Bulls must push and sustain the price above the 20-day EMA to suggest that bearish pressure is reducing. This could start a recovery to $0.64, where bears may again mount a strong defense.
This article does not contain investment advice or recommendations. Every investment and trading move involves risk, and readers should conduct their own research when making a decision.
