Disclaimer: Information found on CryptoreNews is those of writers quoted. It does not represent the opinions of CryptoreNews on whether to sell, buy or hold any investments. You are advised to conduct your own research before making any investment decisions. Use provided information at your own risk.
CryptoreNews covers fintech, blockchain and Bitcoin bringing you the latest crypto news and analyses on the future of money.
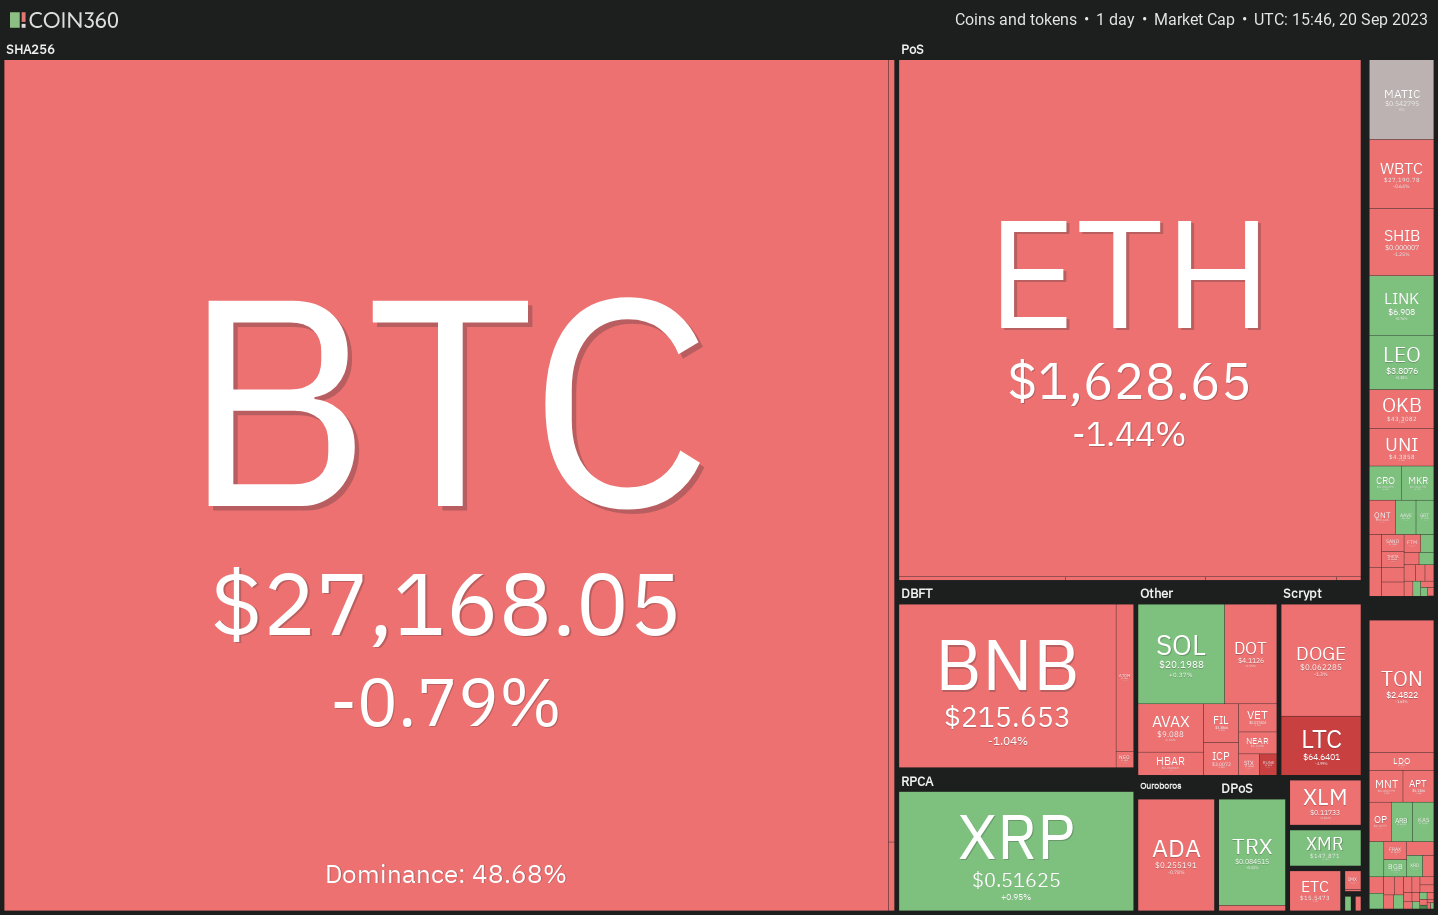
Bitcoin’s (BTC) rebound is encountering selling pressure above $27,000, suggesting short-term apprehension ahead of the Federal Reserve’s meeting on Sep. 20. Nevertheless, long-term investors remain undeterred and have persisted in accumulating. Data from Glassnode indicates that Bitcoin’s dormant supply has reached all-time highs since July.
This optimistic outlook is not mirrored in institutional activity, however. Investors have reduced their cryptocurrency exposure and are on the sidelines, awaiting clearer insights on regulatory and macroeconomic matters. Asset management firm CoinShares reported that outflows from exchange-traded products amounted to $455 million over the last nine weeks.
Meanwhile, analysts are divided regarding Bitcoin’s imminent price movements. Bollinger Bands creator John Bollinger suggested in a post on X (formerly Twitter) that Bitcoin could initiate an upward movement but cautioned that it is “too early to determine.”
Volatility may escalate following Fed Chair Jerome Powell’s press conference, but traders should be vigilant not to fall into a bull or bear trap. It is advisable to remain on the sidelines and enter the market after volatility decreases and a clear directional trend emerges.
What key levels should be monitored for Bitcoin and major altcoins? Let’s examine the charts of the top-10 cryptocurrencies to find out.
Bitcoin price analysis
Bitcoin is encountering significant resistance at the 50-day simple moving average ($27,154), indicating that sellers are attempting to impede the recovery.
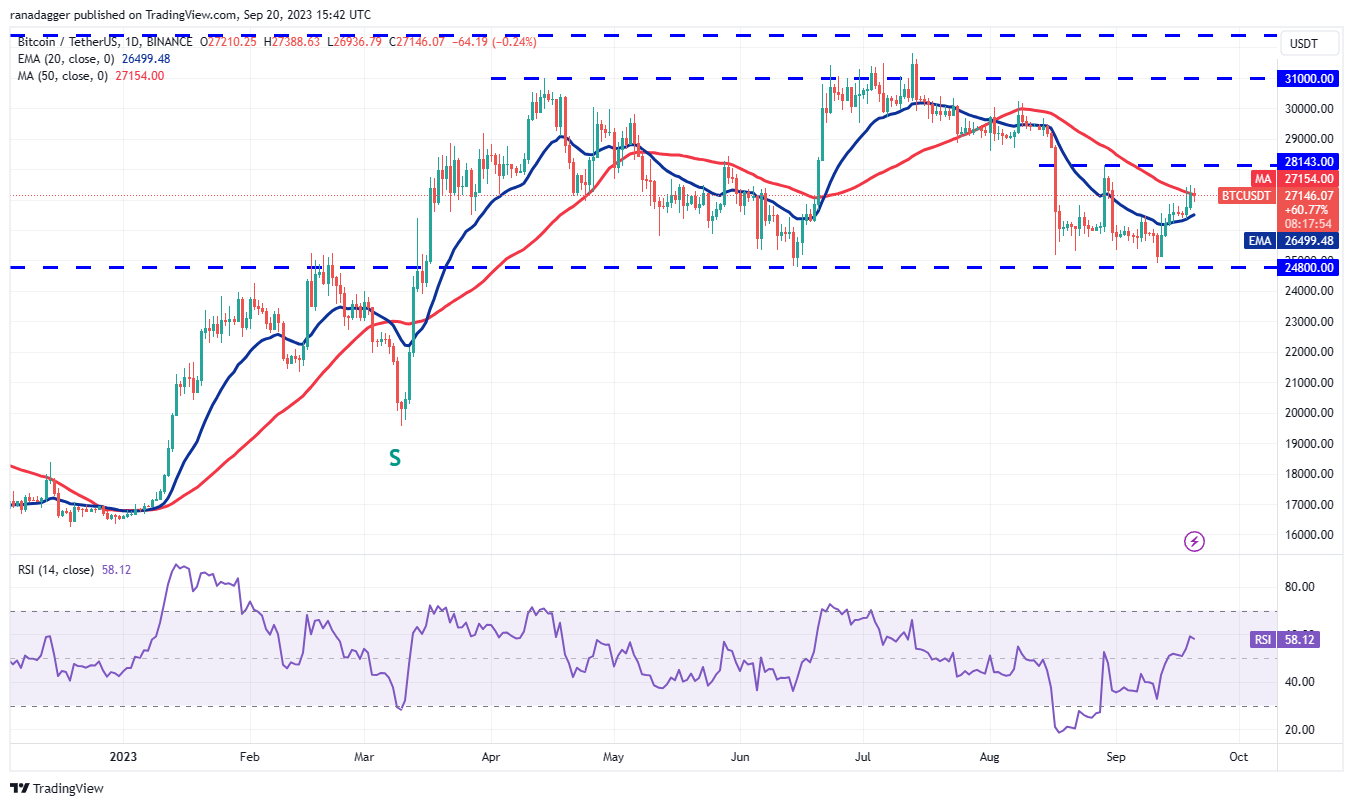
The upward-sloping 20-day exponential moving average ($26,499) and the relative strength index (RSI) being in positive territory suggest that the bulls have the upper hand. If the price bounces off the 20-day EMA, it will improve the chances of a rally above the 50-day SMA. Should this occur, the BTC/USDT pair might rise to $28,143.
Related: Bitcoin price eyes $28K as Binance legal battle spurs bullish momentum
Conversely, if the price declines and falls below the 20-day EMA, it would indicate that sellers remain active at elevated levels. A break and close below $26,000 might intensify selling pressure and drive the pair toward the critical support at $24,800.
Ether price analysis
Ether (ETH) has been holding above the breakdown level of $1,626 for several days, yet the bulls have struggled to capitalize on this strength.
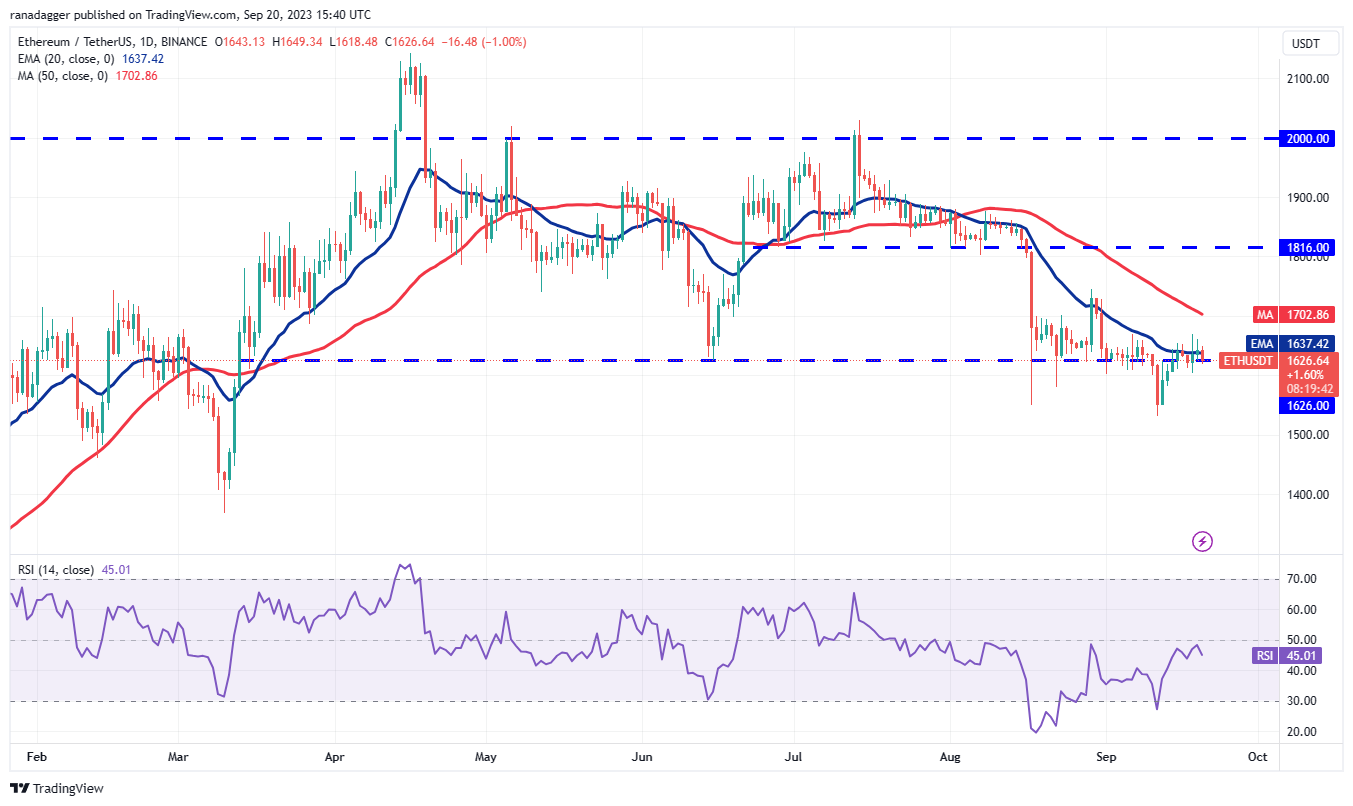
The long wick on the candlesticks from Sep. 18 and 19 indicates selling pressure from the bears at higher levels. The flat 20-day EMA ($1,637) and the RSI just below the midpoint imply a balance between buyers and sellers.
A rise above $1,680 could shift the advantage toward the bulls. The ETH/USDT pair could then surge to $1,745. On the other hand, a drop below $1,600 would suggest that bears have not yet capitulated. This could pull the pair down to $1,530.
BNB price analysis
Buyers attempted to push BNB (BNB) above the resistance level at $220 on Sep. 18 and 19, but the bears successfully defended the position.
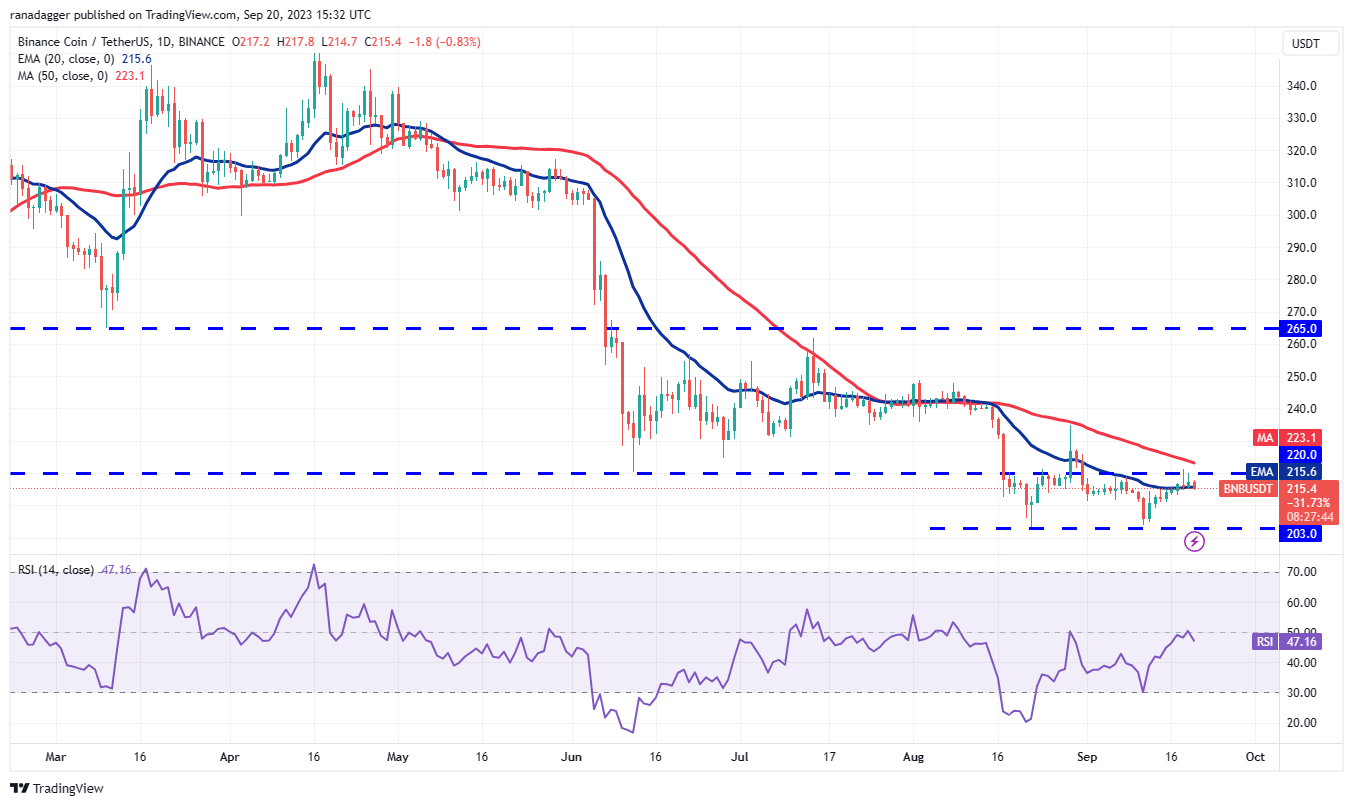
A slight advantage for the bulls is that they have prevented the price from falling below the 20-day EMA ($215). This indicates that bulls are buying the minor dips, anticipating a further upward movement.
If buyers manage to clear the zone between $220 and the 50-day SMA ($223), the BNB/USDT pair could initiate a rally toward $235.
Should the bears wish to thwart the upward movement, they will need to pull the price back below the 20-day EMA. This could keep the price confined within the $203 to $220 range for a longer duration.
XRP price analysis
XRP (XRP) rose and closed above the 20-day EMA ($0.50) on Sep. 19, indicating that the bulls are gaining the upper hand.
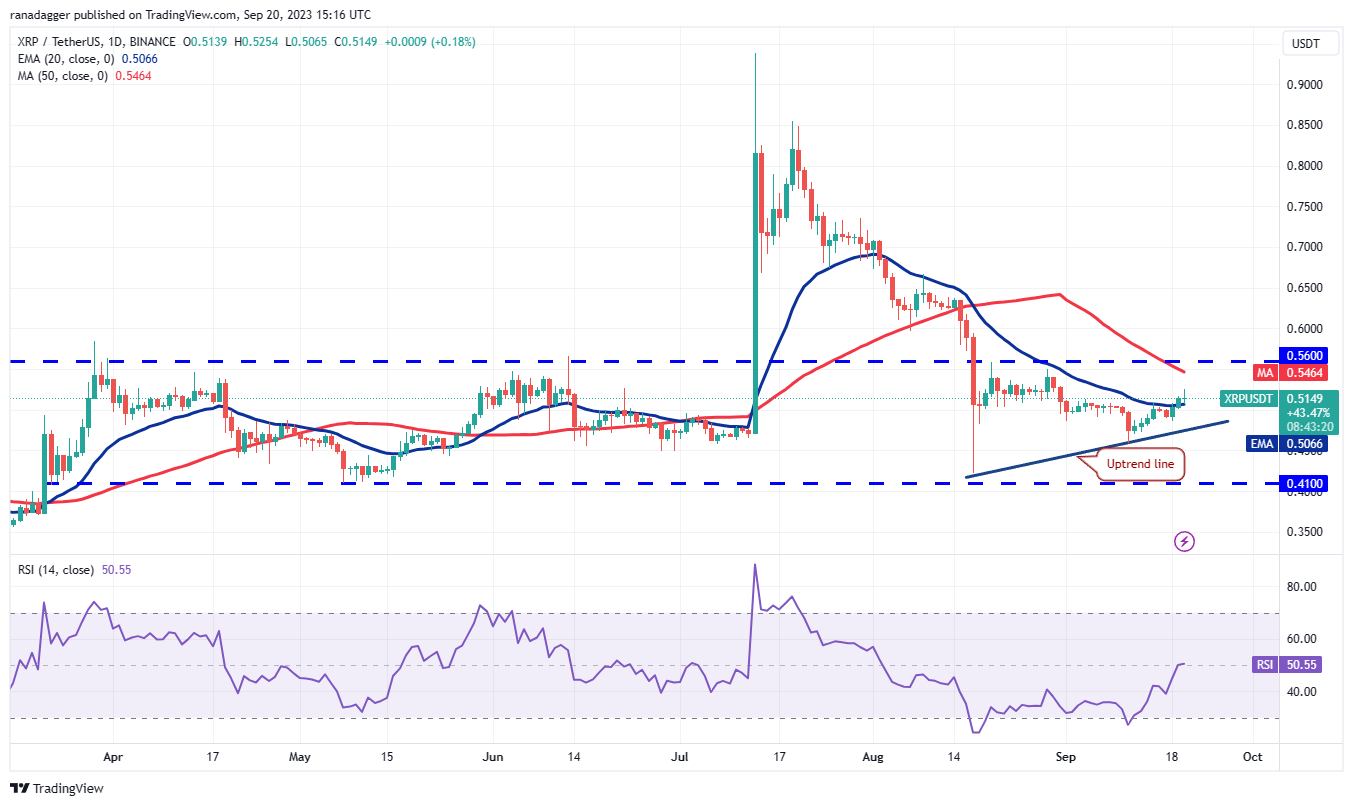
If the price remains above the 20-day EMA, it will suggest that the bulls are attempting to convert the level into support. This would pave the way for a potential rise to the overhead resistance at $0.56, where the bears are likely to take a stance.
The price action over the last few days indicates signs of forming a bullish ascending triangle pattern, which will be completed if there is a break and close above $0.56. Buyers must keep the XRP price above the uptrend line to protect the setup.
Cardano price analysis
Related Posts
The bulls have been striving to push Cardano (ADA) above the 20-day EMA ($0.25) over the past few days, but the bears have not yielded.
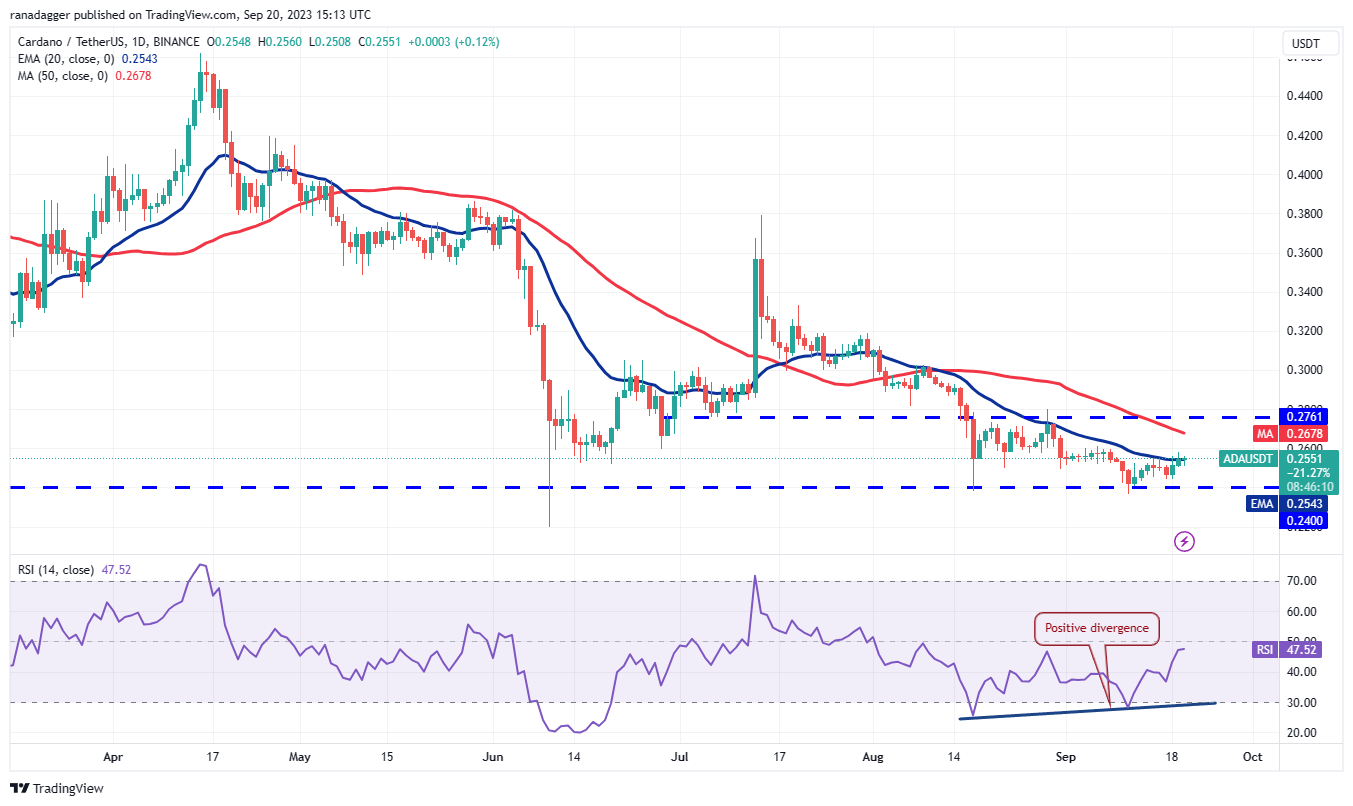
The flattening 20-day EMA and the RSI just below the midpoint indicate a balance between supply and demand. If buyers can maintain the price above the 20-day EMA, the ADA price will attempt to rally to the overhead resistance at $0.28.
In contrast, if the price sharply declines from its current level, it will signal that bears are selling during relief rallies. A break and close below the $0.24 support would indicate the beginning of the next phase of the downtrend, with the next support level at $0.22.
Dogecoin price analysis
Dogecoin (DOGE) has been trading near the 20-day EMA ($0.06) for several days, indicating that bears are aggressively defending this level.
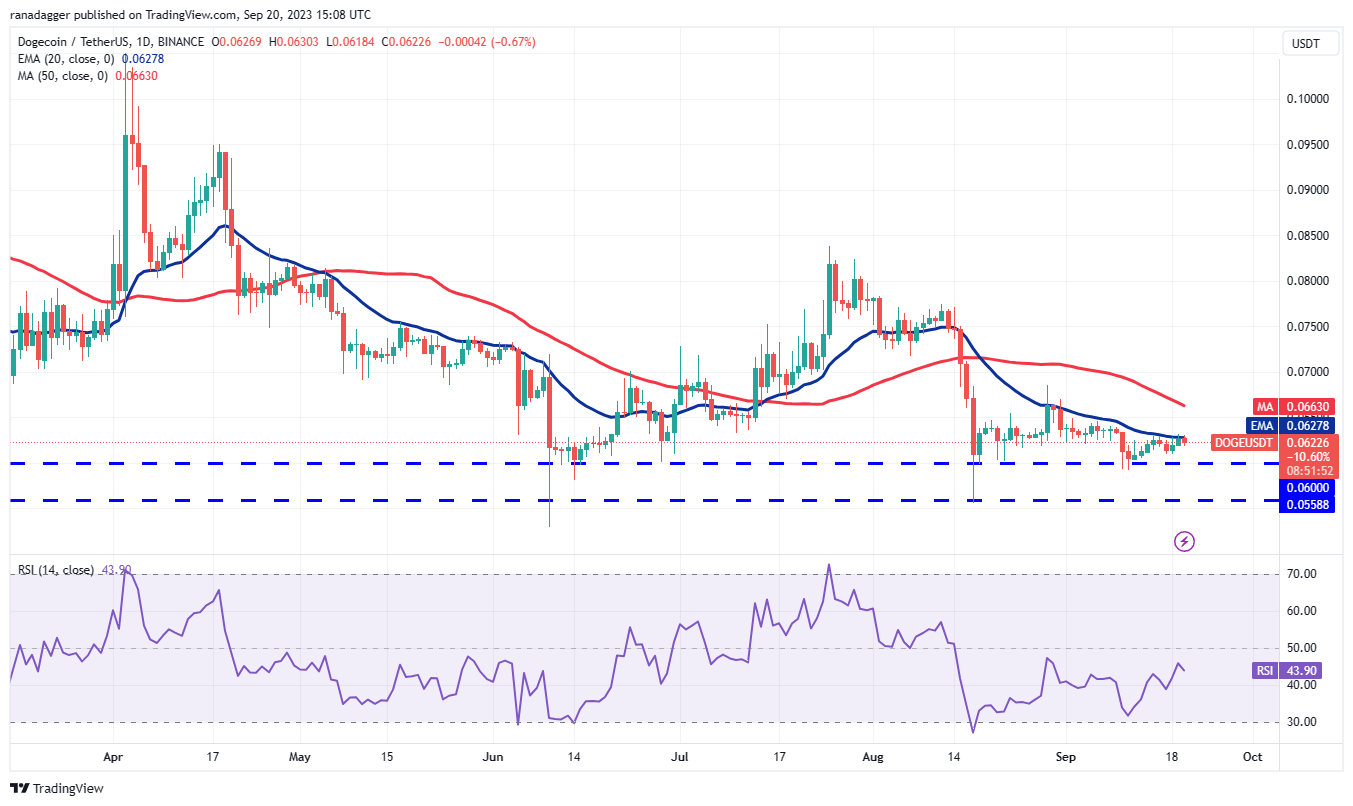
A minor positive for the bulls is that they have prevented the price from dropping below $0.06. This suggests that the bulls are trying to overcome the overhead hurdle. If the 20-day EMA fails, the DOGE/USDT pair could rise to $0.07 and subsequently to $0.08.
On the other hand, if the price sharply declines from the current level, it will indicate that sentiment remains negative and traders are selling during rallies. The bears will then target pushing the price below $0.06 and challenging the crucial support at $0.055.
Solana price analysis
After facing challenges in climbing above the 20-day EMA ($19.55) for several days, Solana (SOL) finally overcame this hurdle on Sep. 18.
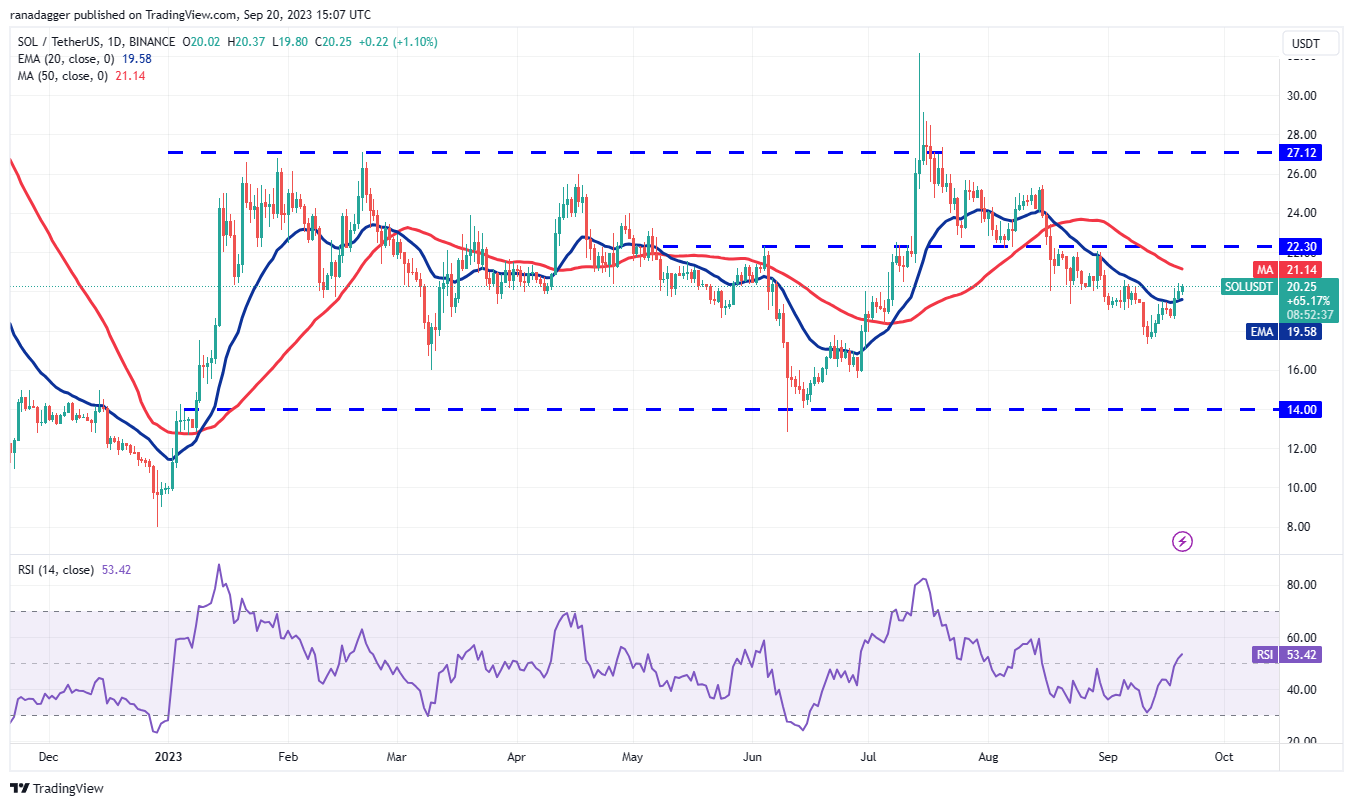
The 20-day EMA is leveling off and the RSI is just above the midpoint, indicating that the bears may be losing their grip. Buyers will attempt to push the price toward the 50-day SMA ($21.14) and subsequently to the overhead resistance at $22.30, where strong selling from bears is likely.
This optimistic outlook may be jeopardized if the SOL/USDT pair turns down and falls beneath $18.50, potentially retesting the strong support at $17.33.
Toncoin price analysis
Toncoin (TON) is currently experiencing a robust uptrend. The bulls are striving to solidify their position by pushing the price above $2.59, but the bears have maintained their stance.
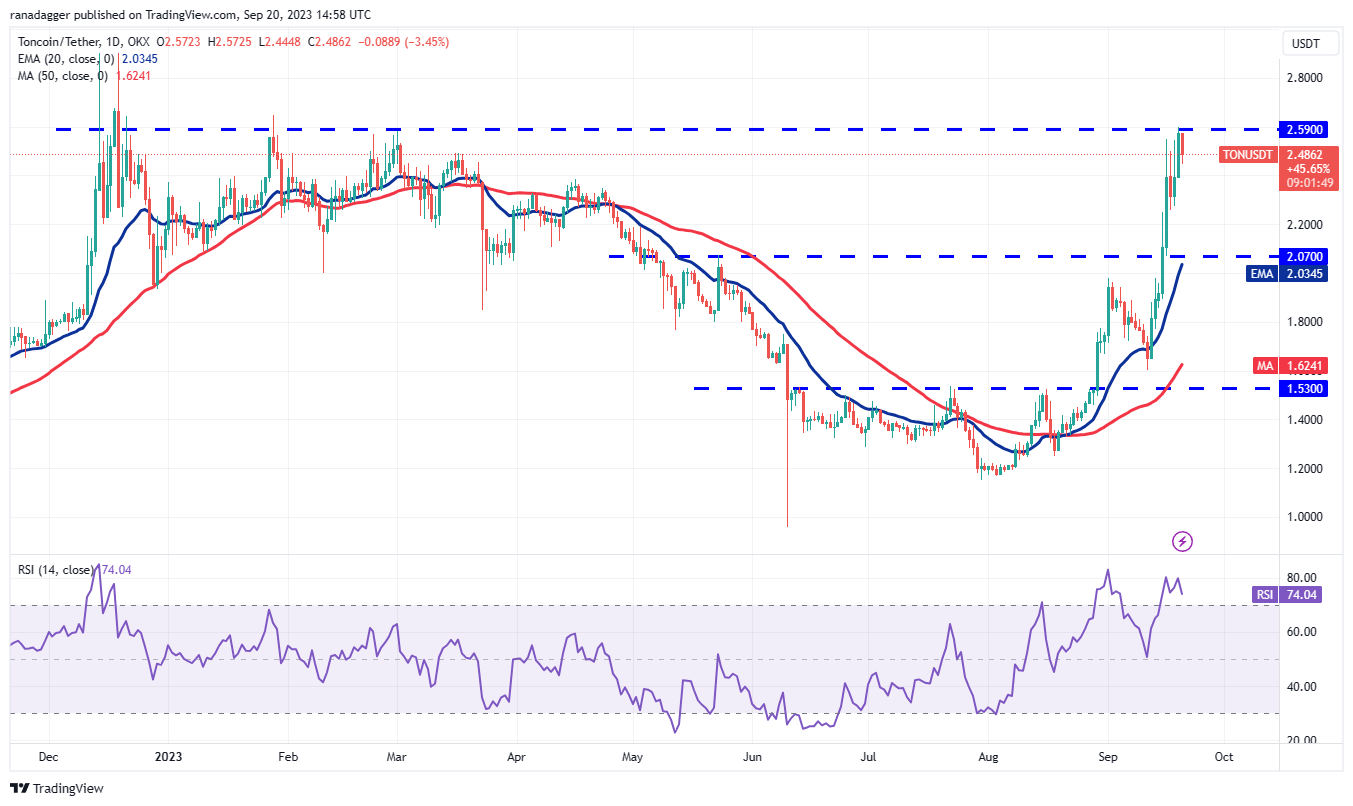
Even though the upward movement is encountering selling pressure near $2.59, the bulls have not yielded to the bears. This indicates that traders are holding onto their positions as they expect another upward movement. Should the price rise above $2.59, the TON/USDT pair could reach $2.90 and eventually $3.28.
The ascending moving averages suggest a favorable situation for buyers, but the overbought condition on the RSI cautions of a potential correction or consolidation in the near term. The first support level for the TON price on the downside is $2.25, with the next level to monitor being $2.07.
Polkadot price analysis
The bulls are having difficulty pushing Polkadot (DOT) above the breakdown level of $4.22, signaling that demand is waning at elevated levels.
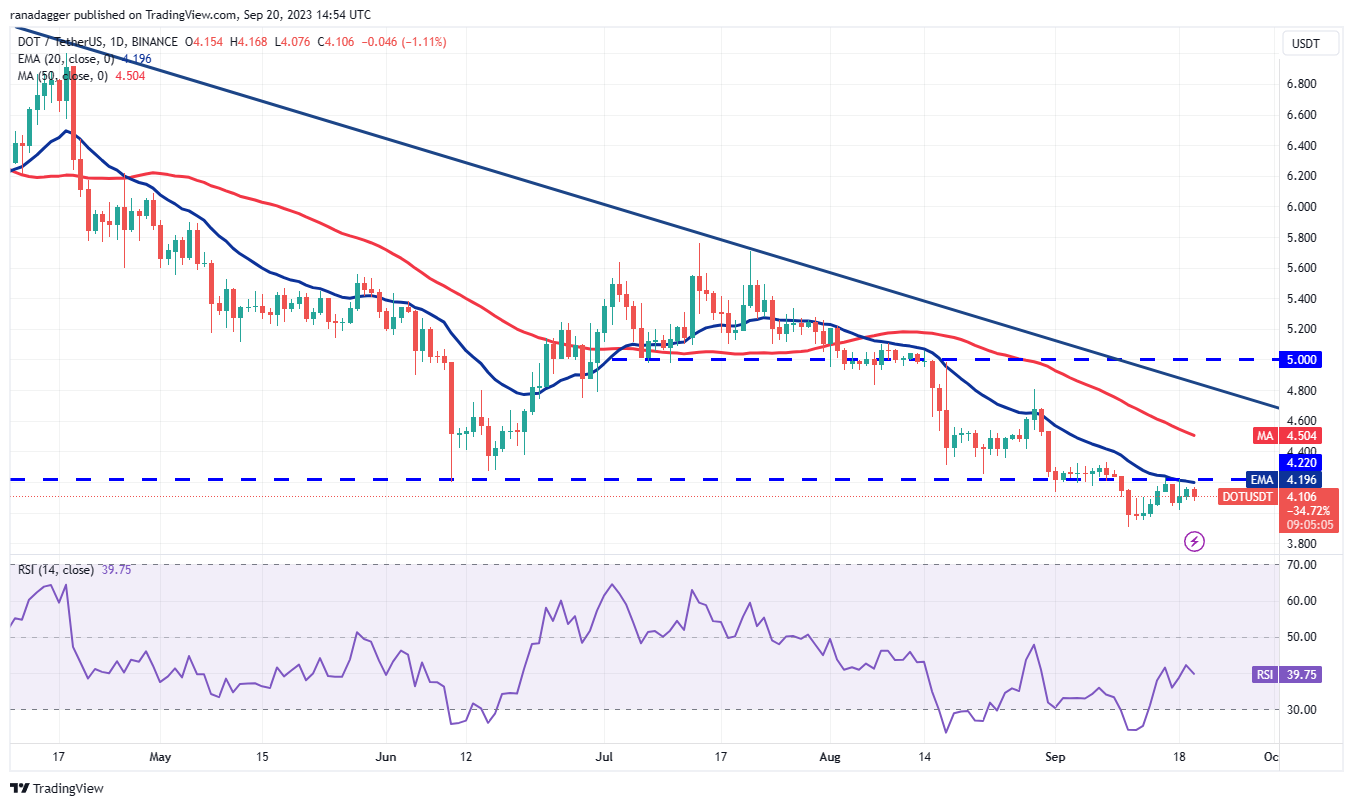
The bears will aim to strengthen their position by driving the price below the immediate support at $4. If successful, the DOT/USDT pair risks a drop to the crucial support level at $3.90. A break and close below this threshold could initiate the next phase of the downtrend.
Conversely, if the price rebounds from the current level and surpasses the $4.22-4.33 resistance zone, it could trigger short covering. The pair could then first reach the 50-day SMA ($4.50) and subsequently climb toward the downtrend line.
Polygon price analysis
Polygon (MATIC) rose and closed above the 20-day EMA ($0.54) on Sep. 19, signifying that the bulls are making an effort to recover.
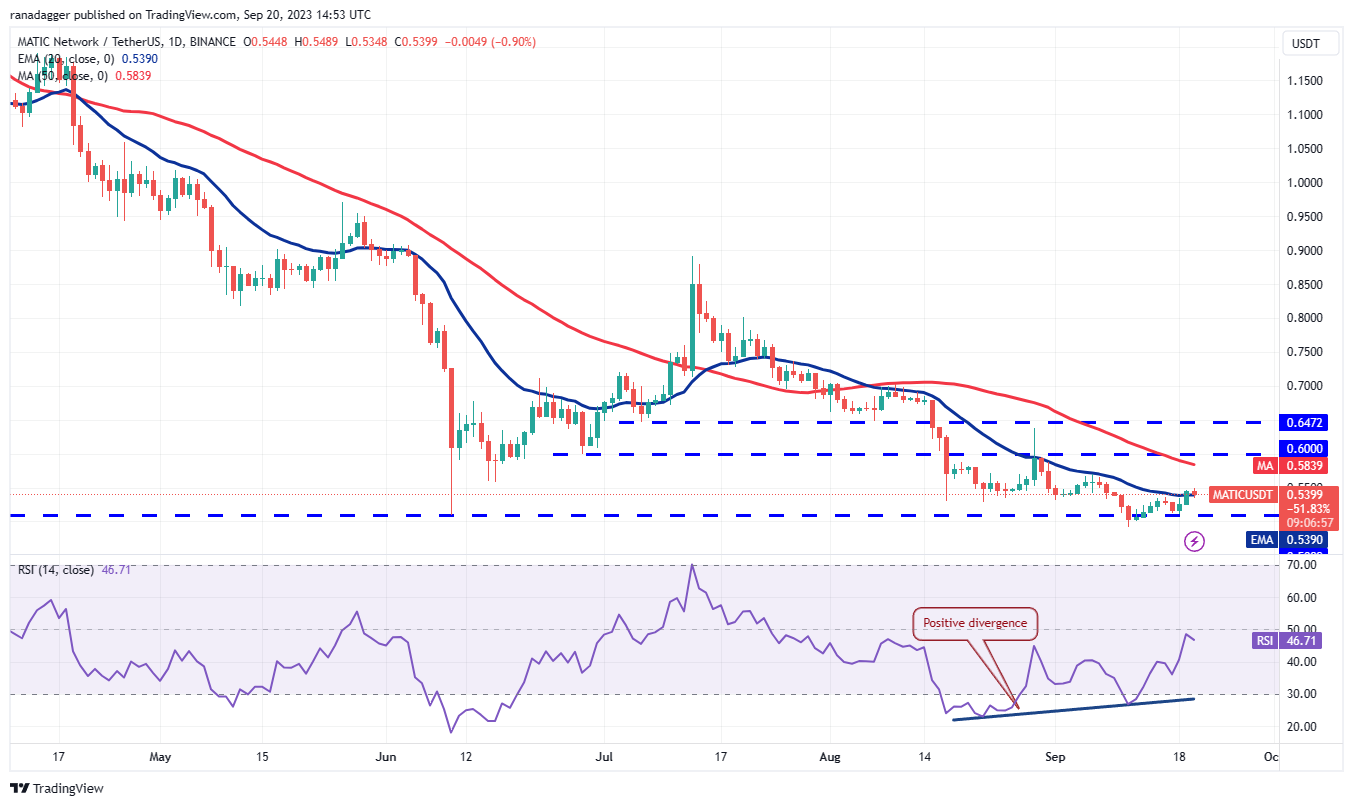
Nevertheless, the 20-day EMA is likely to witness fierce contention between the bulls and bears. If the bulls sustain the price above the 20-day EMA, the MATIC/USDT pair could ascend to the overhead resistance at $0.60 and then to $0.65.
In contrast, if the bears manage to pull the price back below the 20-day EMA, it will indicate that higher levels continue to attract selling pressure. The bears will then attempt to build upon their lead by dragging the price below $0.49.
This article does not contain investment advice or recommendations. Every investment and trading move involves risk, and readers should conduct their own research when making a decision.